*Corresponding author: [email protected]
28
2017 UTHM Publisher. All right reserved. penerbit.uthm.edu.my/ojs/index.php/ijie
Influence of Soil Stabilizing Materials on Lead Polluted Soils
using Jet Erosion Tests
Ghazi M. Mutter
1, Abdul-Sahib T. Al-Madhhachi
1,*, Raghad R. Rashed
11Department of Environmental Engineering, College of Engineering,
Al-Mustansiriya University, Baghdad 10047, Iraq.
Received 13 December 2016; accepted 14 March 2017, available online 15 March 2017
1.
Introduction
The stabilization of soils has been performed for ages. For instance, the Mesopotamians and Romans separately discovered that it was possible to improve the ability of pathways to carry traffic by mixing weak soils with a stabilization agent like pulverized limestone or calcium [1]. Generally, soil stabilization aims to improve soil strength and increases resistance to softening by water through binding the soil particles together, water proofing the particles or combination of the two [2].
Soil erosion is one of the serious world problems that make the soil to become unstable. Soil erosion is a natural process that slough off and land transport material through the action of natural erosive agents such as: water, wind, gravity, or artificial processes caused by human activities. Recent researches showed that Pb-polluted soil is more erodible than clean soils [3]. Increasing the erodibility of cohesive soils indicated that there is a defect results from pollution in the environment. Soil erodibility is typically defined by excess shear stress model depend on two soil parameters: the critical shear stress (c, Pa) and the erodibility coefficient (kd,
cm3/kN.s). Currently, there is no widely accepted or
reliable method to estimate these parameters for cohesive soils based on the soil properties. The best approach to determine these parameters is to measure them. One of the techniques to determine soil erodibility that is becoming more widely accepted in practice is the Jet Erosion Test, JET [4-6].
The accumulation of heavy metals in soil is an important issue because of the adverse effects that may have on food quality, soil usage, human health, and the environment [7, 8]. In response to these negative effects, there has been ongoing development of variety of technologies to remediate soil affected by heavy metal contamination. Solidification and stabilization immobilization techniques are the most commonly selected treatment options for metal-contaminated sites [9]. According to Wiles [10], chemical treatment of solidification and stabilization either binds the heavy metal and hazardous compound waste stream to a stable insoluble form (stabilization), or entraps the waste within a solid cementitious matrix (solidification). This technique is significant because it is relatively cheaper than most alternatives and resulted in well qualified long term physical and chemical stability, and also because
Abstract: Solidification or stabilization treatment is usually used to stabilize site of contaminated land. Several
common binding materials, such as cement, hydrated lime, and bitumen, were usually utilized as stabilizer materials for contaminated soil and tested by conventional techniques (such as wet sieving and dispersion ratio methods). Recent studies have been proved that the high lead (Pb) concentration in soil causes an increase in soil erodibility, which is a major global environmental problem. An excess shear stress model is normally applied to measure soil erodibility based on two empirical soil parameters: critical shear stress (τc) and erodibility coefficient (kd). Jet Erosion Test (JET) is one of recent technique to measure the soil erodibility parameters (τc and kd) in the field as well as in the laboratory. The objective of this study was to investigate the influence of many stabilizer materials (cement, hydrated lime, and bitumen) on the stability of an artificially Pb-contaminated soil, using “mini” JET device as a function of measuring soil erodibility parameters (τc and kd). Hence, different percentages of three common Iraqi stabilizer materials (cement, hydrated lime, and bitumen) at different curing time were conducted to observe the effect of these materials on soil properties; such as Atterberg limits, dry density, optimum moisture content, and hardness as well as to soil erodibility parameters (τc and kd). The results showed a reduction in kd value with increasing in the percentage of stabilizer materials and curing time, while τc values were increased. The ideal mixing ratios of stabilizer materials showed that hardness degree increased by a ratio of 22% to 28.4%, while Atterberg limits either decreased or increased by a ratio of 5% to 28.5%. The results showed that all these materials can improve soil properties of Pb-contaminated soil and the cement was the best stabilizer. This study provides the benefit of using JET device in consume testing time and conserving energy, compared with other conventional techniques usually used for studying soil stabilization.
G.M. Mutter et al., Int. J. Of Integrated Engineering Vol. 9 No.1 (2017) p. 28-38
29
resultant products often possess superior mechanical and structural characteristics [9].
The most commonly-applied pozzolanic materials are Portland cement, lime, and/or fly ash [11-13]. Stabilization with cement and lime are common treatment technologies for the safe management, reuse, and treatment for disposal of contaminated waste. Portland cement is composed of silicates and calcium-aluminates that when combined with water, it will hydrate to form the cementing compounds of calcium-silicate-hydrate, and calcium-aluminates-hydrate, as well as excess calcium hydroxide [14]. Because of the cementation materials formed with the cement, and with the calcium hydroxide (lime), the stabilizing may be successful in both granular and fine-grained clay soils. The mechanism of treatment with bituminous material consists of adding cohesive strength and reducing water penetration by the physical presence of bitumen. There is no chemical interaction in this process. Bitumen stabilization includes both water proofing and cementation actions [15].
Several researches were utilized building materials to stabilize polluted soils [16-18]. Al-Layla et al. [16] investigated the tensile stress properties of natural and stabilized clayey soil. The tensile strengths were obtained using the flexural test. The compressive strength on a portion of the beam was determined for both soils after curing time of 7 and 30 days. The results revealed that both the tensile and compressive strengths increased with the addition of lime and with increasing curing time. Shubber et al. [17] studied the effect of bituminous materials on gypseous sandy soil using different percentages of bitumen. The results revealed that the addition of cutback bitumen with different soaking periods of (0, 4, 7, and 21) days would improve its strength and stiffness characteristics and enhance its waterproofing characteristics. Saeed et al. [18] performed experimental studies to evaluate strength development in cement-lime stabilized/solidified soils contaminated with either copper or zinc. Their results confirmed the interference of heavy metals in the process of cement and lime hydration as a direct reflection of varied strength developments in tested soil samples with 200 days curing time selected.
All the pervious techniques were required more time and conservation to test soil stabilization. This research was investigated a new technique to reduce time consuming and energy conservation to investigate the influence of Iraqi local building materials (cement, lime, and bitumen) on Pb-contaminated soil using JET device by measuring soil erodibility parameters (c and kd). The
original JET device was first developed by Hanson [4]. Hanson and Cook [5, 6] developed the analytical method of JET to measure τc and kd immediately using Excel
spreadsheet depending on the diffusion principles. Al-Madhhachi et al. [19, 20] developed a new miniature version of JET, refers as to “mini” JET device. Al-Madhhachi et a1. [19] compared the performance of the origin and “mini” JET devices under controlled laboratory setting to investigate the performance of
“mini” JET versus original JET. They found equivalent results between the two JET devices. The “mini” JET device has several benefits over the original JET device; such as, the small size of the “mini” JET, more converted to use in many setting, consume less water, and could be used in situ as well as in the laboratory in comparison to the original JET.
Al-Madhhachi et al. [20] verified the results of the origin and “mini” JET devices with the results of flume tests. Khanal et al. [21] conducted 20 “mini” JETs under control laboratory condition on two soi1 types of contrasting texture to investigate the variability of “mini” JET device on estimating soil erodibility parameters. They recommended that at high pressure head, the initial time interval should be taken at least 30 s and a termination time interval should be at least 300 s for less erodible soils. Salah and Al-Madhhachi [3] investigated the influenced of lead (Pb) pollution on the erodibility of cohesive soil using “mini” JET device. Their results showed that the high lead concentration in soil causing an increase in soil erodibility. They found that polluted soil is more unstable than clean soils.
The objectives of this study were 1) to investigate the influence of different percentage of building materials (cement, hydrated lime, and bitumen) on the stability of an artificially Pb-contaminated soil using “mini” JET device as a function of measuring soil erodibility parameters (τc and kd) at different curing times, and 2) to
developed relationships between soil erodibility parameters (τc and kd) and other soil properties; such as
Atterberg limits, and hardness.
2.
Materials and Methods
2.1
Materials
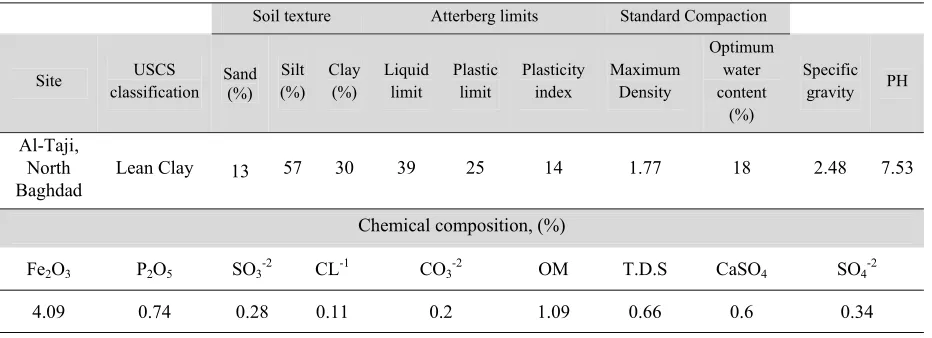
Lean clay soil samples were used as a model in this study to carry out the experiments, acquired from Al-Taji region, North of Baghdad city. Table (1) shows the physical properties and the chemical composition of lean clay soil used in this study. Soil texture, liquid limit, plastic limit, plasticity limit, maximum dry density, optimum water content, soil PH, in addition to chemical composite were reported in Table (1). The soil samples were tested and analyzed according to ASTM standards [22]. The soil sample was classified according to the Unified Soil Classification System (USCS). Soil analyses were carried out in the soil laboratory of the Civil Engineering Department, Al-Mustansiriya University.
Chemical analyses were tested at sanitary laboratory of the Environmental Engineering Department, Engineering College, Al-Mustansiriya University. Other chemical tests were carried out by the State Company of Geological Survey and Mining, Ministry of Industry and Minerals. Three stabilizers were employed in this study; cement, lime, and bitumen. The type of cement, lime, and bitumen used in this study were the ordinary Portland cement, Hydrated lime Ca(OH)2, and bitumen emulsion,
30
Table 1 Physical properties and chemical composition of soil used in this study.
Soil texture Atterberg limits Standard Compaction
Site USCS
classification Sand (%) Silt (%)
Clay (%)
Liquid limit
Plastic limit
Plasticity index
Maximum Density
Optimum water content
(%)
Specific gravity PH
Al-Taji, North Baghdad
Lean Clay 13 57 30 39 25 14 1.77 18 2.48 7.53
Chemical composition, (%)
Fe2O3 P2O5 SO3-2 CL-1 CO3-2 OM T.D.S CaSO4 SO4-2
4.09 0.74 0.28 0.11 0.2 1.09 0.66 0.6 0.34
Table 2 Chemical composition of stabilizers (cement, lime, and bitumen) used in this study.
Chemical composition
(%)
MgO +
CaO CaO SiO2 Al2O3 Fe2O3 MgO K2O Na2O SO3 L.O.I Total
Cement - 62.37 20.81 3.57 4.62 1.2 0.64 0.29 2.36 3.64 99.5
Lime 71.50 - 0.98 0.21 0.17 1.28 - - 0.13 25.73 100
Bitumen
Properties Form Color Density, g/cm3
Penetration at
25 C⁰ Solid
Content% Service Temp, C
⁰ Setting time, hrs.
Values viscose Thick liquid
Dark brown 1.03 ±0.02 40 ±5 6 to 47 8 touch dry to 24 firm set
Test
standard visible visible
ASTM
D2939 ASTM D5 ASTM D2939 ASTM D2939
2.2
Experimental procedure
The soil samples were air-dried, broken into smaller pieces size, and sieved through a 4.75 mm sieve according to ASTM standard [22]. The sieving was performed to ensure that the soil was of uniform grade. Several groups were tested in this study. Each group contained 8 samples with a total of 96 samples. Two of them are prepared without stabilizer and the other six were prepared with stabilizer.
For samples without stabilizer, the artificial Pb-contaminated soil samples were prepared by mixing lead nitrate, as the source of lead (Pb), to produce lead concentration of 4000 mg/kg into the natural soil of 2000 g in weight of each sample. The mixture was mixed by hands for (5-10) min until the mixture has a
homogenous and uniform appearance and left for 24 hrs. with required water content in a closed bucket to allow moisture equilibrium, then soil moisture content (
) of the samples was determined.G.M. Mutter et al., Int. J. Of Integrated Engineering Vol. 9 No.1 (2017) p. 28-38
31
mixture has a homogenous and uniform appearance and left for 24 hrs. in a closed bucket to allow moisture equilibrium, then soil moisture content (
) of the samples was determined.Eight soil samples of each group with a total of 96 samples were prepared for testing after 24 hrs. by mixing in standard mold, using proctor compaction test which is consists of a standard mold with standard compaction energy according to ASTM standard. The standard mold was a 101.6 mm in diameter and the soils were compacted at three separate layers using 25 blowing in each layer by a 2.5 kg hammer falling of 305 mm in height according to ASTM standard [22].
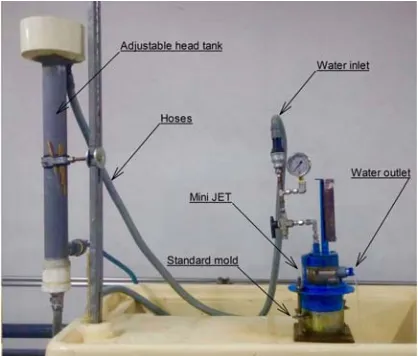
The “mini” JET device (Figure 1) was performed to derive excess shear stress model parameters (τc and
kd). The description, dimension, and functions of this
device were defined in Al-Madhhachi et al. [19]. In this study, the “mini” JET was calibrated according to Al-Madhhachi et al. [19] and the coefficient of discharge (C) was found to be 0.65. The sample without stabilizer was tested using “mini” JET directly after compaction while the sample with stabilizer were tested after (1, 3, and 7) days after compaction, in order to investigate the stabilizer effect on soil stabilization using “mini” JET device. Every two soil samples from each group were prepared for testing with the “mini JET device at the same time and in the same manner. The soil specimen was place in the center of the submergence tank directly below the jet nozzle. The adjustable head tank was then set at the desire constant head (70 cm for all experiment) and hoses (including water source) were connected to the JET device (Figure 1). Tests were repeated twice for each curing time of one additive. The procedure of running JET and collecting data were followed Al-Madhhachi et al. [19, 20] and Khanal et al. [21] with test length of 120 minutes.
Fig. 1 Laboratory setup of the “mini” JET device.
Digital Shore-D durometer, which is usually used to measure the hardness of rubber according to ASTM, was performed for measuring the hardness of soil-stabilizer mixture [23] to determine the hardness of 26 soil samples tested in this study after 7 days of curing time. Two samples of each percent of addition of the three stabilizers were tested to increase the accuracy of the tests.
2.3
Analysis method of JETs
The excess shear stress model is the most commonly used model to predict soil erodibility depends on two empirical soil parameters: kd and c. It
is expressed as [24, 4]:
r
k
d
c
a (1)where
r is the detachment rate (cm/s), τ is theaverage hydraulic boundary shear stress (Pa), and a is an empirical exponent assumed to be unity according to Hanson [4] and Al-Madhhachi et al. [19, 20].
The solution method of excess shear stress model parameters was based on principles of fluid diffusion presented by Stein and Nett [25] and a hyperbolic function modeling the depth progression of the scour hole developed by Blaisdell et al. [26]. The equilibrium depth (Je) is defined as the maximum
depth of the scour hole beyond which the water jet cannot erode further. This solution method predetermines the c parameter based on Je of scour
hole as predicted by the Blaisdell’s function as following [5, 6]:
2
e p o cJ
J
(2)where o = CfwUo2 is the maximum shear stress due
to the jet velocity at the nozzle (Pa); Cf = 0.00416 is
the coefficient of friction;w is water density (kg/m3);
Uo = C 2gh is the velocity of jet at the orifice
(cm/s); C is discharge coefficient (ranged from 0.6 to 0.8 for “mini” JET according to Al-Madhhachi et al. [19]); h is the pressure head (cm); Jp = Cd do is the
potential core length from jet origin (cm); do is the
nozzle diameter (cm); and Cd = 6.3 is the diffusion
constant. The kd is then determined by solving for the
least squared deviation between the observed scour time and predicted time of the following equation [5]:
* * * * * *
1
1
ln
5
.
0
p pJ
J
J
J
T
T
* * 1 1 ln 5 . 0 p p J J(3)
where T* = t / T
r is the dimensional time, t is the time
32
reference time according to Stein and Nett [25], J* =
J/Je; J is the scour depth (cm), and Jp* = Jp /Je. The
parameters of the excess shear stress model were derived using equations 1 through 3 for JET data using Spreadsheet Tool, Version 2.1.1 that developed by Daly et al. [27]. The above procedure is referred to Blaisdell solution.
3.
Results and Discussion
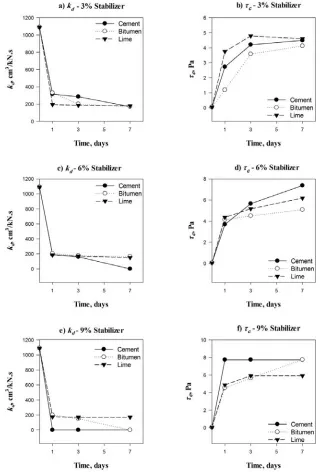
A total of 96 soil samples were tested using “mini” JETs to drive the erodibility parameters (kd and c) of excess shear stress model. Figure (2) shows the
relationships between excess shear stress parameters (kd and c) and curing time (0, 1, 3, and 7) days after
adding different percentage (0%, 3%, 6%, and 9%) of stabilizers (cement, hydrated lime, and bitumen) to the Pb-contaminated soil. The zero percentage indicated to soil samples tested without adding any stabilizers.
Fig. 2 Effect of different percentage of stabilizers (cement, hydrated lime, and bitumen) on excess shear stress parameters at different curing times: (a) kd – 3% stabilizer, (b) c – 3% stabilizer, (c) kd – 6% stabilizer, (d) c – 6%
International Journal of Integrated Engineering, Vol. 9 No. 1 (2017) p. 28-38
33
Table 3 Excess shear stress parameters (kd and c) values at different percentage of stabilizers (cement, hydrated lime,
and bitumen) after 7 days of curing time.
Cement Hydrated lime Bitumen
Percentage,
% cm3k/kN.s d. c, pa Percentage, % cm3k/kN.s d, c, pa Percentage, % cm3k/kN.s d, c, pa
0 1090 0.045 0 1090 0.045 0 1090 0.045
3 170 4.49 3 180 4.605 3 170 4.125
6 0.1 7.37 6 150 6.18 6 165 5.085
9 1.0000e-3 7.74 9 170 5.925 9 0.1 7.74
It can be observed that the erodibility coefficient kd decreased with increased curing time for the same
percentage of stabilizers and kd decreased with
increased stabilizer percentages, while the critical shear stress c increased with increased curing time for
the same percentage of stabilizer and with increasing stabilizer percentages. The decreased in kd values with
cement was due to the chemical compositions of cement contributed to adhesive and cohesive property of the cement which make it capable of binding fragments of minerals into whole compacted soil. The contested area between chemical components of cement and chemical components of soil produced more stable soils [28]. The decreasing in kd values with
hydrated lime was due to the cementitious products of the lime which obtained strengths to lime-stabilized soil layers [29]. Note that the chemical reactions with lime required more time compared with cement [30]. The decreasing in kd values with bitumen was due to
increase in the cohesive and load bearing capacity of the soil particles which is increased the resistant to the action of water. The soil particles were covered with bitumen that prevents or slows the penetration of water [28]. The entire samples in this study after stabilization were converted to very resistant and more stable soils. Hanson and Simon [31] reported that the very erodible soils had low c and high kd, while the very resistant
soils had high c and low kd.
The results of excess shear stress parameters (c
and kd) with different percentages (0%, 3%, 6%, and
9%) of stabilizers (cement, hydrated lime, and bitumen) after 7 days of curing time were reported in Table (3). This curing time was enough to obtain the desired results compared with other old techniques that required a long time ranged from 21 to 200 days for testing soil stabilization. This proved the beneficial of JET device in consume testing time and conserving energy when compared with other conventional techniques. Table (3) showed that the ideal mixing ratios of stabilizers were 6% for cement, 6% for hydrated lime, and 9% for bitumen to obtain the significant values of excess shear parameters values (c
and kd) after 7 days of curing time.
In order to investigate the influence of some soil properties on soil erodibility parameters (kd and τc);
Atterberg limits, dry density, moisture content, and
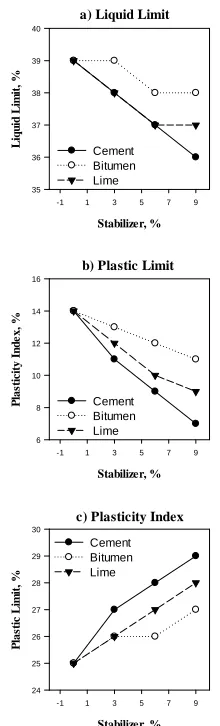
hardness were reported in this study. The Atterberg limits reflect to the physical response of a soil to water, and hence are significant as indices of behavior of clay soils. The relationships between Atterberg limits (liquid limit, plastic limit, and plasticity index) and different percentages (0%, 3%, 6%, and 9%) of stabilizers (cement, hydrated lime, and bitumen) are shown in Figure 3.
Fig. 3 Relationships of Atterberg limits with different percentage of stabilizers (cement, hydrated lime, and bitumen) for: a) Liquid limit, b) Plastic limit, and c) Plasticity index.
Stabilizer, %
-1 1 3 5 7 9
Li
q
u
id
Li
m
it
,
%
35 36 37 38 39 40
Cement Bitumen Lime
Stabilizer, %
-1 1 3 5 7 9
P
la
sti
c L
im
it,
%
24 25 26 27 28 29 30
Cement Bitumen Lime
a) Liquid Limit
b) Plastic Limit
Stabilizer, %
-1 1 3 5 7 9
P
la
sti
ci
ty
In
d
e
x
, %
6 8 10 12 14 16
Cement Bitumen Lime
34
The liquid limit decreased gradually with increasing percentages of cement and hydrated lime, but showed less reduction with bitumen percentage (Figure 3a). This reduction in liquid limit was 5%, 5%, and 2.5%, for the ideal mixing ratios of cement, hydrated lime, and bitumen, respectively. This could be as a result of the pores in the clay soil being occupied by the particles of the three stabilizers and hence less vulnerable with increasing water content. Similar results were reported in Kadhim [32].
Increasing in plastic limits was observed as percentage of stabilizers increased as shown in Figure 3b. The increasing in plastic limit was 12%, 8%, and 8% for ideal mixing ratios of cement, hydrated lime, and bitumen, respectively. This was due to the phenomenon of flocculation and agglomeration that obtained after the addition of stabilizing agents which leads to decrease in the thickness of the water layer (electric double layer). Therefore, the clay becomes less affected by the addition of water. Similar results were observed by Locat et al. [33]. As a result of differences between liquid limit and plastic limit, the reduction in plasticity index was 35.7%, 28.5%, and 21.4% for ideal mixing ratios of cement, hydrated lime, and bitumen (Figure 3c), respectively. These differences were also observed by other researches [34].
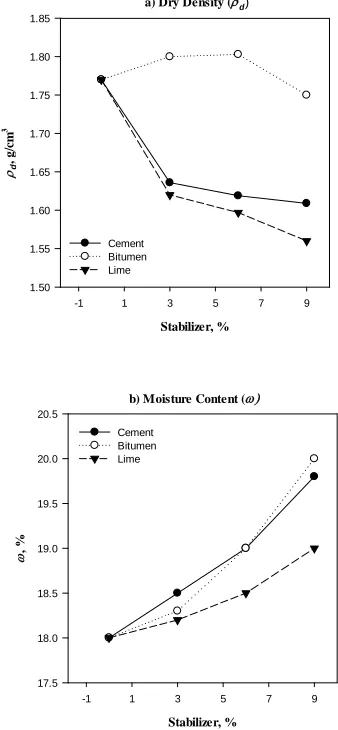
A comparison of dry density and optimum moisture content at different percentage (0%, 3%, 6% and 9%) of stabilizers (cement, hydrated lime and bitumen) added to the Pb-contaminated soil using Proctor compaction test is shown in Figure 4. The dry density of soil decreased with increased in percentage of cement and lime. The increasing of 8.5% and 10% at the ideal mixing ratios was due to flocculation and agglomeration of fine grained soil particles which occupied larger space and lead to a corresponding drop in dry density. Sherwood [2] and Al-Qaisee [35] reported similar results.
The dry density of compacted soil increased with increased bitumen percentage by 1.1% for the ideal ratio was due to that the pore spaces were filled with bitumen that could move through the soil particles and link them together (Figure 4a). Similar behaviors were found by Ogundipe [36]. The increasing in moisture content of soil with cement and lime was 5.5% and 2.7% for the ideal mixing ratios because cement and lime powders are finer than the soil particles (Figure 4b). The finer particles resulted in more surface area; therefore, more water is required to provide better lubrication. The increasing was also attributed by the pozzolanic reaction of these materials with the soil [37]. The increasing in moisture content with bitumen was 11% for the ideal ratio (Figure 4b). This was probably due to lubricating effect and fluid content of bitumen, as observed in Kadhim [32].
Stabilizer, %
-1 1 3 5 7 9
d
, g
/c
m
3
1.50 1.55 1.60 1.65 1.70 1.75 1.80 1.85
Cement Bitumen Lime
Stabilizer, %
-1 1 3 5 7 9
, %
17.5 18.0 18.5 19.0 19.5 20.0 20.5
Cement Bitumen Lime
a) Dry Density (d)
b) Moisture Content (
Fig. 4 Relationships between different percentage of stabilizers (cement, hydrated lime, and bitumen) with: a) Dry density, and b) Moisture content.
Fig. 5 The variation of average degree of hardness on different percentage of stabilizers (cement, hydrated lime, and bitumen).
Stabilizer, %
1 3 5 7 9
D
e
g
re
e
o
f ha
rd
ne
ss
(
D
H
)
75 80 85 90 95 100
G.M. Mutter et al., Int. J. Of Integrated Engineering Vol. 9 No.1 (2017) p. 28-38
35
As expected, increased in average degree of hardness (DH) was observed as stabilizer percentages (0%, 3%, 6% and 9%) of cement, hydrated lime, and bitumen, increased (Figure 5). The increased in hardness was 28.4%, 22%, and 27.7% at the ideal mixing ratios of cement, hydrated lime, and bitumen, respectively. The higher hardness with cement was due to the pozzolanic reactions which produced a
cementitious bond between soil mineral substances that increased the cohesion of soil particles [38]. The lower hardness was with hydrated lime, because the pozzolanic reactions required several months or years to be stabilized [33]. The hardness with bitumen includes both waterproofing of soil and cementation actions which bind the particles together [15].
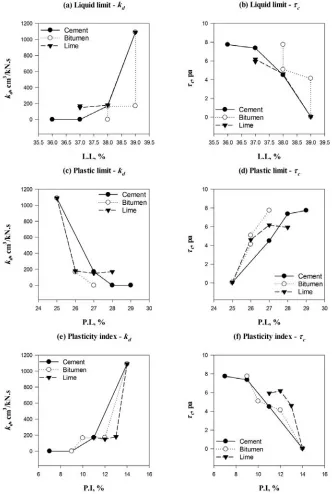
Fig. 6 Relationship between excess shear stress parameters and Atterberg limits for different stabilizer materials (cement, hydrated lime, and bitumen): a) Liquid limit–kd, b) Liquid limit–c, c) Plastic limit–kd, d) Plastic limit–c, e)
36
The relationships between excess shear stress parameters (c and kd) and Atterberg limits of different
percentage (0%, 3%, 6%, and 9%) of stabilizers (cement, hydrated lime, and bitumen) added to the Pb-contaminated soil were reported (Figure 6). The results showed that there were increasing in erodibility coefficient kd associated with increasing in liquid limit,
with correlation coefficient (R2) of 0.47 to 0.77 and
with increasing in plasticity index, with R2 of 0.61 to
0.81 (Figures 6a and 6e). While there was a reduction in kd as plastic limit increased, with R2 of 0.61 to 0.87
(Figure 6c). As expected, the critical shear stress c
followed opposite behavior to kd in relation to the
Atterberg limits, with R2 of 0.62 to 0.97 (Figures 6b,
6d, and 6f).
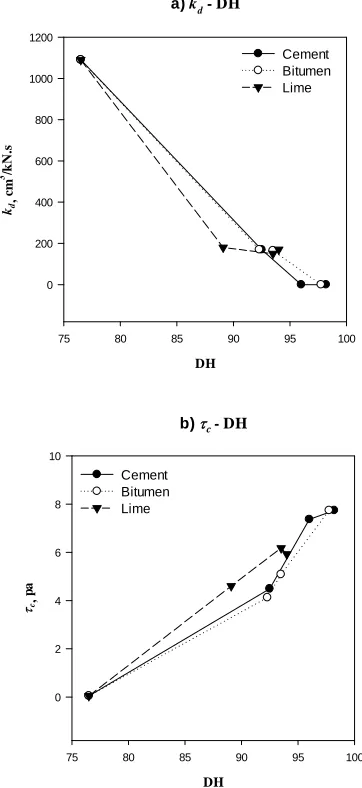
Fig. 7 Relationship between excess shear stress parameters (kd and c) and the degree of hardness (DH)
after 7 days for different stabilizer materials (cement, hydrated lime, and bitumen) where; a) kd-DH, and b) c-DH.
Figure (7) shows the relationships between excess shear stress parameters (c and kd) and the degree of
hardness (DH) at different percentages (0%, 3%, 6%, and 9%) of stabilizers (cement, hydrated lime, and bitumen) added to the Pb-contaminated soil. As expected, an inverse relationship between kd and the
degree of hardness, with R2 of 0.94 to 0.99, while the
critical shear stress c followed a direct correlation
versus the degree of hardness, with R2 of 0.94 to 0.99.
Low kd values indicted to more stable soils.
4.
Conclusion
Cement, lime, and bitumen are considered as stabilizers of contaminated land, since they can reduce the mobility of contaminant soils. Ninety-six tests were performed using “mini” JET device to investigate the influence of these stabilizers on the resistance of Pb-contaminated cohesive soil erodibility by measuring the excess shear stress parameters (c and kd). The data
obtained from the “mini” JETs were analyzed with the linear model using Blaisdell solution technique to derive c and kd. Relationships between erodibility
parameters (c and kd) and soil properties (Atterberg
limits and soil hardness) were developed. The results indicated that the erodibility coefficient kd of the soil
decreased with increasing curing time for the same stabilizer percentage, and with increased stabilizer percentages. While the critical shear stress c
increased with increasing curing time for the same stabilizer percentage and with increasing stabilizer percentages.
An inverse relationship between c and kd were
observed as developed in previous studies. The results showed that the ideal mixing ratios to stabilize Pb-contaminated soil was at 7 days of curing time with 6% cement, 6% hydrated lime, and 9% bitumen. At ideal mixing ratios of these stabilizers, the value of kd
decreased from 1090 to 0.1 cm3/kN.s, soil hardness
increased from 22% to 28.4%, and the Atterberg limits either decreased or increased from 5% to 28.5%. As expected, a strong inverse relationship between kd and
the degree of hardness with R2 of 0.94 to 0.99 was
observed, while the critical shear stress c followed a
direct correlation with the degree of hardness, R2 of
0.94 to 0.99. The results indicated that low kd values
referred to more stable soils and the cement was superior in stabilizing contaminated soil among lime and bitumen. This study proved the beneficial of using JET device in consume testing time and conserving energy when compared with other conventional techniques used for testing soil stabilization.
References
[1] Hejazi, S.M, Sheikhzadeh, M., Abtahi, S. M., and Zadhoush, A. A simple review of soil reinforcement by using natural and synthetic
a) kd - DH
DH
75 80 85 90 95 100
kd, cm
3/k
N
.s
0 200 400 600 800 1000 1200
Cement Bitumen Lime
b) c - DH
DH
75 80 85 90 95 100
c, pa
0 2 4 6 8 10
G.M. Mutter et al., Int. J. Of Integrated Engineering Vol. 9 No.1 (2017) p. 28-38
37
fibers. Construction and Building Materials, Volume 30, (2012), pp. 100-116.
[2] Sherwood, P. Soil stabilization with cement and lime. State of the Art Review, London, Transport Research Laboratory, HMSO, (1993).
[3] Salah, M., and Al-Madhhachi, A. T. Influence of Lead Pollution on Cohesive Soil Erodibility using Jet Erosion Tests. Environment and Natural Resources Research, Volume 6(1), (2016), pp. 88-98.
[4] Hanson, G. J. Surface erodibility of earthen channels at high stresses. II: Developing an in situ testing device. T. ASAE, Volume 33(1), (1990), pp. 132-137.
[5] Hanson, G. J., and Cook, K. Development of excess shear stress parameters for circular jet testing. ASAE Paper, 972227, (1997), St. Joseph, Mich: ASAE.
[6] Hanson, G. J., and Cook, K. Apparatus, test procedures, and analytical methods to measure soil erodibility in situ. Appl. Eng. Agr., Volume 20(4), (2004), pp. 455-462.
[7] Arora, M., Kiran, B., Rani, S., Rani, A., Kaur, B., and Mittal, N. Heavy metal accumulation in vegetables irrigated with water from different sources. Food Chemistry, Volume 111, (2008), pp. 811–815.
[8] Qishlaqi, A., Moore, F., and Forghani, G. Impact of untreated wastewater irrigation on soils and crops in Shiraz sub urban area, SW Iran. Environmental Monitoring and Assessment, Volume 141, (2008), pp. 257–273.
[9] Conner, J. R. Chemical Fixation and Solidification of Hazardous Wastes. Van Nostrand Reinhold, New York, NY., (1990), ISBN 0-4422-0511-2. [10]Wiles, C. C. A review of solidification /
stabilization technology. Journal of Hazardous Materials, Volume 14, (1987), pp. 5-21.
[11]Palomo, A., and Palacios, M. Alkali-activated cementitious materials: alternative matrices for the immobilization of hazardous wastes part II: Stabilization of chromium and lead. Cement and concrete research, Volume 33, (2003), pp. 289-295.
[12]Dermatas, D., and Meng, X. Utilization of fly ash for stabilization/solidification of heavy metal contaminated soils. Engineering Geology, Volume 70, (2003), pp. 377-394.
[13]Terzano, R., Spagnuolo, M., Medici, L., Tateo, F., and Ruggiero, P. Zeolite synthesis from pre-treated coal fly ash in presence of soil as a tool for soil remediation. Applied Clay Science, Volume 29(2), (2005), pp. 99-110.
[14]Lee, C. Y., Lee, H. K., and Lee, K. M. Strength and microstructural characteristics of chemically activated fly-ash-cement systems. Cem. Conr. Res., Volume 33(3), (2003), pp. 425-431.
[15]Ingles, O.G., and Metcalf, J.B. Soil Stabilization (Principle and Practice). Butterworth, Sydney, (1972), pp. 165-186.
[16]Al-Layla, M. T., Al-Dabbagh, A. W., Jaro, M. N. Tensile strength of natural and lime stabilized Mosul clay. Journal of Al-Rafidain Engineering, Volume 16(2), (2007), pp. 1-11.
[17]Shubber, A., Diogo, J., and Liu, X. Low Cost Roads Construction by Soil Stabilization using Bituminous Materials in Al-Anbar Gypseous Sandy Soil. ASCE, Volume 330(362), (2009), pp. 2459-2466.
[18]Saeed, K. A., Kassim, K. A., and Nur, H. Physicochemical characterization of cement treated kaolin clay. Građevinar, Volume 66(6), (2014), pp. 513-521.
[19]Al-Madhhachi, A. T., Hanson, G. J., Fox, G. A., Tyagi, A. K., and Bulut, R. Measuring soil erodibility using a laboratory “mini” JET. Trans. ASABE, Volume 56(3), (2013a), pp. 901-910. [20]Al-Madhhachi, A. T., Hanson, G. J., Fox, G. A.,
Tyagi, A. K., and Bulut, R. Deriving parameters of a fundamental detachment model for cohesive soils from flume and jet erosion tests. Trans. ASABE, Volume 56(2), (2013b), pp. 489-504. [21]Khanal, A., Fox, G. A., and Al-Madhhachi, A.T.
Variability of erodibility parameters from laboratory mini Jet Erosion Tests. Journal of Hydrologic Engineering, ASCE, Volume 21(10), (2016), ISSN 1084-0699/ 04016030-1.
[22]ASTM. Annual Book of ASTM Standards, Section 4: Construction. Philadelphia, PA, ASTM, (2006).
[23]Wang, Z. F., Shen, S. L., and Yin, Z. Y. Rapid field evaluation of the strength of cement-stabilized clayey soil. Bull. Eng. Geol. Environ., Volume 74(3), (2015), pp. 991-999.
[24]Partheniades, E. Erosion and deposition of cohesive soils. J. Hydraulics Div. ASCE, Volume 91(1), (1965), pp. 105-139.
[25]Stein, O. R., and Nett, D. D. Impinging jet calibration of excess shear sediment detachment parameters. Trans. ASAE, Volume 40(6), (1997), pp. 1573-1580.
[26]Blaisdell, F. W., Clayton, L.A., and Hebaus, C. G. Ultimate dimension of local scour. J. Hydraulics Division, ASCE, Volume 107(HY3), (1981), pp. 327-337.
[27]Daly, E. R., Fox, G. A., Al-Madhhachi, A. T., and Miller, R. A scour depth approach for deriving erodibility parameters from Jet Erosion Tests. Trans. ASABE, Volume 56(6), (2013), pp. 1343-1351.
[28]Onyelowe, K.C., and Okafor, F.O. Geochemistry of Soil Stabilization. ARPN Journal of Earth Sciences, PAKISTAN, Volume 1(1), (2012), pp. 32-35.
[29]Quang, N. D., and Chai, J. C. Permeability of lime-and cement-treated clayey soils. Canadian Geotechnical Journal, Volume 52(9), (2015), pp. 1221-1227.
38
reaction products and expansion. Clay Minerals, Volume 28 (4), (1993), pp. 569-583.
[31]Hanson, G. J., and Simon, A. Erodibility of cohesive streambeds in the loess area of the Midwestern USA. Hydrol. Proc., Volume 15(1), (2001), pp. 23-38.
[32]Kadhim, A. J. Stabilization of Gypseous Soil by Cutback Asphalt for Roads Construction. Journal of Engineering and Development, Volume 18(1), (2014), pp. 46–67.
[33]Locat, J., Berube, M.A., and Choquette, M. Laboratory investigations on the lime stabilization of sensitive clays: Shear strength development. Canadian Geotechnical Journal, Volume 27(3), (1990), pp. 294-304.
[34]Sridharan, A., Nagaraj, H.B., and Prakash, K. Determination of the Plasticity Index from Flow Index. Geotechnical Testing Journal, Volume 22(2), (1999), pp. 169-175.
[35]AL-Qaissee, A. E. The effect of (Sand-Cement) Mixture on the swelling characteristics of compacted clayey soil. [M. Sc. Thesis] University of Al-Mustansiriya, Civil Engineering Department, (2004).
[36]Ogundipe, O. M. Strength and Compaction Characteristics Of Bitumen-Stabilized Granular Soil. International Journal of Scientific & Technology Research, Volume 3(9), (2014), pp. 218-221.
[37]Sarkar, R., Abbas, S. M., and Shahu, J. T. A Comparative Study of Geotechnical Behavior of Lime Stabilized Pond Ashes from Delhi Region. International Journal on GEOMATE, Japan, Volume 3(1), (2012), pp. 273-279.