Licensed under Creative Common Page 262
http://ijecm.co.uk/
ISSN 2348 0386
THE INFLUENCE OF INDUSTRY COMPETITIVE FORCES AND
DISTINCTIVE CAPABILITIES ON COMPETITIVENESS AND
THE IMPLICATION ON THE PERFORMANCE OF
BANKING COMPANIES IN INDONESIA
Irwan Lubis
Doctorate Program in Management, Faculty of Economic and Business, Univesitas Padjadjaran, Bandung, Indonesia
Ina Primiana
Doctorate Program in Management, Faculty of Economic and Business, Univesitas Padjadjaran, Bandung, Indonesia
Nury Effendi
Doctorate Program in Management, Faculty of Economic and Business, Univesitas Padjadjaran, Bandung, Indonesia
Surachman
Doctorate Program in Management, Faculty of Economic and Business, Univesitas Padjadjaran, Bandung, Indonesia
Abstract
The performance of companies of national banking in Indonesia is lower than foreign banking.
The level of penetration is lower than the banking in ASEAN. Such condition presummably due
to the weaknesses in competitiveness. Besides, there are some problems that presummably
impact on that condition, such as the weaknesses of the distinctive capabilities and the ability of
banking companies that still low in adapting the banking industry competitive forces. Refer to
Licensed under Creative Common Page 263
distinctive capabilities on the competitiveness, and the implication on company performance of
banking companies in Indonesia. This study conducted through Mix Method Research (MMR)
with the explanatory design. The unit of analysis is the banking industry in Indonesia which is
the unit of observation is the management of the national banks, whether state-owned, private
and foreign banks that have go public. The time horizon is cross section. The data is analyzed
and verified through PLS. The findings reveal that distinctive capabilities is a more dominant
factor compared to industry competitive forces in improving the competitiveness.
Competitiveness has a significant influence in improving company performance. Distinctive
capabilities and industry competitive forces can improve the performance of company through
their ability in improving competitiveness.
Keywords: Industry Competitive Forces, Distinctive Capabilities, Competitiveness, Company
Performance
INTRODUCTION
Even though the number of go public conventional commercial banks is only 37% compared to the total number of general banks, but the number its office reach out 84% of all of the offices owned by total general banks., reaching 5,184 offices or 23% in the last 5 years. The market capitalization value of go public conventional commercial banks by December 2015 was IDR 1,143 trillion, up 48% when compared to the value as of December 2011.
Judging from the total assets, the assets of go public conventional banks by December 2015 had a share of 74% of the total assets of commercial banks with a rising trend. In the last 5 years (2011-2015), the total assets of go public conventional banks increased by IDR 1,829 trillion, or 67% compared to total assets as of December 2011, so as to IDR 4.559 trillion.
Within the last 5 years (2011-2015), go public conventional banks posted a profit increase of IDR 29 trillion, or up to 49%, to IDR 87 trillion. The profits were booked by conventional banks in 2015, is 83% of the total profit of commercial banks, of which 64% of the profits derived from the profits of Limited Bank. While national commercial banks’s income contributed 33% to the go public conventional commercial bank profits and the profit of BPD contribute of 3%. The growth of bank assets and liabilities, followed by the performance of go public conventional commercial banks fairly well during the last 4 years up to 2015, which indicated some basic financial ratios of the banking industry.
Licensed under Creative Common Page 264 the ratio of Capital Adequacy Ratio (CAR) that was stable above the threshold of 8% namely CAR of 15.36% in 2015. The financial ratios were also in relatively good condition, namely BOPO amounting to 78.30%, ROA of 2.55%, LDR amounted to 87.53% and the NPL, despite increased due to deteriorating economic conditions, relatively well preserved well enough that in 2015 the NPL of go public conventional commercial banks at 2.28% .
Meanwhile, the Indonesian banking structure is not healthy for about 73.9 percent of total Indonesian banking assets is controlled by 22 large banks. While the medium-sized banks and small banks amounting to only 96 banks dominate the banking assets of not more than 26.1 percent. This condition describes the lack of specialization in the banking industry, especially the specialties related to the value chain in an industry sector.
Based on the results of preliminary observations, the unstable performance of the Indonesian banking companies, allegedly because the low superior competitiveness of the industry today which is still relatively weak in the eyes of its stakeholders. This was indicated by the lack of competitiveness of products compared with products of foreign banks; development of product variations are relatively not unique compared to competitor banks; as well as aspects of the service that has not superior to certain circles. Yet according to Castro et al. (2004, p.302) that in order for a company considered to be competitive from the point of view of the operative, then the company must design a strategy to complete the conditions: a competitive price, the products with superior quality, and service of high level to the customer (speed and variety).
The low performance of the banking companies was also presummably because the management has not been fully able to anticipate the fluctuation of the industry competitive forces, such as government policies, the movement of banking industry opportunities, the movement of customers demands, and the higher mobility of the competitor. Meanwhile, according to Porter (1980) in Wheelen and Hunger (2012), Hubbard and Beamish (2011) and Pearce & Robinson (2011), the framework of five forces to achieve sustainable profitability in industries consisting of: threat of new entrants, competition between industry players, the power of suppliers of production inputs, the power of consumers, and the threat of substitutes and complements.
Licensed under Creative Common Page 265 inadequate, and branch office locations that are less strategic. In addition, the company's reputation was also relatively not so good in the eyes of the market..
LITERATURE REVIEW
Industry Competitive Forces
Wheelen et al. (2015), put forward the concept of the Porter’s industry competitive forces which
is essentially the study of the extent to which companies are able to enter the existing industrial environment, where the competitive power of industry competition is the ability of companies to adapt the opportunities and threats that arise in entering an industry. It was explained that in observing the industry, companies must assess the importance of the six powers, namely: the threat of new entrants, competition among existing companies, the threat of substitute products or services, the bargaining power of buyers, bargaining power of suppliers, and the relative strength of other stakeholders.
Porter also be a reference to Thompson, Peteraf, Gamble, Strickland III (2014), which suggests that the character and strength of competitive forces in an industry was never the same as other industries. Five forces of competition model is a tool that has been used extensively to measure the fundamental competitive pressure in a market. Competitive pressures on companies in an industry derived from the five forces are: rivalry among competitors, competition from new entrants, competition from manufacturers or product substitution, bargaining power of suppliers, and bargaining power of customer, in line with Hitt, Ireland, Hoskisson, (2015), and Pearce and Robinson (2015).
Distinctive Capabilities
Wheelen et al. (2015:162) argue: “Resources are an organization’s assets and are thus the basic building block of organization. They include tangible assets, such as its plant, equipment, finances, and location, human assets, in terms of the number of employees, their skill and motivation, and intangible assets, such as its technology (patents and copyrights) culture and reputation. Capabilities refer to corporation ability to exploit its resources. A Competency is a cross-functional integration and coordination of capabilities”. A core competency is a collection
Licensed under Creative Common Page 266 Simonceska (2010) proposed the distinctive capabilities as the process of identifying the advantages and characteristics of the company and exploit them in creating a particular product by those who were aware of competition in the market. Meanwhile, according to Ireland, Hoskisson and Hitt (2013), the resource-based model assumes that each organization is a collection of unique resources and capabilities. The uniqueness of the resources and capabilities are fundamental to the company's strategy and its ability to obtain returns above average. Resources are inputs to the production process of the company, such as capital equipment, individual skills of employees, patents, financial and talented managers. In general, company resources are classified into three categories: physical, human resources, and organizational capital.
Competitiveness
According to Ireland et al (2013, p.4) “Strategic competitiveness is achieved when a firm successfully formulates and implements a value-creating strategy”. According to the opinion, the
strategic competitiveness will be achieved when a company has successfully formulate and execute a strategy of value creation.
Castro; Castro; Miron; Martinez (2004, p.301) argues about the strategic and operative competitiveness adapted from Gabina (1996, p.184):
Strategic competitiveness = innovation + anticipation + speed
Operative competitiveness = cost + quality + flexibility + delivery time
According to Castro et al (2004, p.302) a company is considered to have competitiveness of operative standpoint, the company must design a strategy to equip conditions: competitive prices, with superior quality products and high level of service to the customer (speed and variety).
Jin Su & Gargeya (2012, p.146) cites Kumar and Arbi (2008) that one of the methods to improve the competitiveness of a company is through a strategic approach from suppliers around the world. Customization demands of consumers and the need for “quick response” in a
rapidly changing market to make more and more companies recognize the strategic role of resources in achieving a sustainable competitive advantage and improve financial performance. Opinion was implicitly reveals that one of the characteristics of the condition of competitiveness is the speed of response.
Licensed under Creative Common Page 267 company linked to how well the business model interacts with the environment to produce value-added offers.
Company Performance
According to Marr and schiuma (2003), the company's performance is a multi -dimensional measure of the company which covers various aspects, such as: accounting, economic, human resource management, marketing, psychology, sociology and strategic management. Tangen (2003) revealed that the company's performance is generally used as a management tool to measure the effective and efficient in the future.
According to Ferguson & Reio (2010), the company's performance can be measured on the basis of two perspectives, namely: financial performance and business performance. In short, through the company's performance can be presented efficiency and effectiveness of the company to measure and evaluate the performance of the finance department, employees, businesses, and organizations. Aras, Aybars, Kutlu (2010) suggests financial performance (profitability) is indicated through ROE, ROA and ROS.
METHODOLOGY
This study aimed to examine the influence of industry competitive forces and distinctive capabilities on competitiveness and its implications on the performance of the go public banking companies in Indonesia. This study conducted through Mix Method Research (MMR) with the explanatory design. The unit of analysis is the banking industry in Indonesia which is the unit of observation is the management of the national banks, whether state-owned, private and foreign banks that have go public with a total 42 respondents. The time horizon is cross section / one shot. The data is verified and analyzed through PLS using Smart PLS v.2.0.
ANALYSIS
Test of Model Suitability
Licensed under Creative Common Page 268 Analysis of Structural Model (Inner Model)
The Structural analysis model (inner model) shows the relationship between the latent-variables. Inner models were evaluated using Goodness of Fit Model (GoF), which shows the difference between the values of the observations with the values predicted by the model. This test is indicated by the value of R2 and Q-Square where if Q-Square value above 80% is considered good. Here are the values GoF and Q-Square on the construct:
Table 1. Test of Structural Model (Inner Model)
Variable R Square Communality GoF Q-Square
Industry competitive forces 0.690
0,846 0,999
Distinctive capabilities 0.714
Competitiveness 0.982 0.751
Company Performance 0.976 0.770
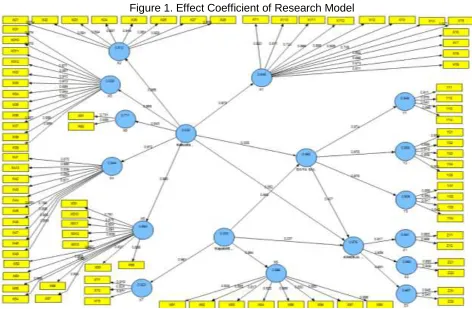
The above table shows the value of R2 is in the quite high criteria with the value of GoF as 0.625 and the value of Q-Square is greater than 0.8, so it can be concluded that the research model is supported by empirical condition or in other word the model is fit. The figure below show the result of evaluation model through Smart PLS 2.0:
Licensed under Creative Common Page 269 Analysis of Measurement Model (Outer Model)
The analysis of measurement model show the relationship between manifest variable and each latent variables. The analysis aims to examine the validity and reliability of dimensions and indicator used in measuring each construct variable. This analysis can be shown with the value of discriminant validity, loading factor, Construct Validity and Composite Reliability.
The value of square root of average variance extracted (AVE) is the methods to assess the discriminant validity, which the suggested value is above 0.5.Contruct Validity described by the value of factor loading. According to Chin (2000), of the loading factor greater than 0.50 or t of loading factor is greater than table in significant of 5% shows that it is valid in measuring the variables. Composite Reliability and Cronbachs Alphaare used to see the reliability of dimension in measuring the variable. If their value are greater than0.70 (Nunnaly, 1994), it means that the dimensions and indicators are reliable in measuring the variables.
Table 2. Analysis of Measurement Model (Outer Model)
Variable AVE Composite
Reliability
Cronbachs Alpha
Industry competitive forces 0.690 0.992 0.992
Distinctive capabilities 0.714 0.965 0.960
Competitiveness 0.751 0.975 0.972
Company Performance 0.770 0.952 0.940
The table shows that the value of AVE > 0,5, it means that all of variables in the estimated model fit with the criteria of discriminant validity. The composite reliability of each variable > 0,70, means that all of variables has a good reliability.
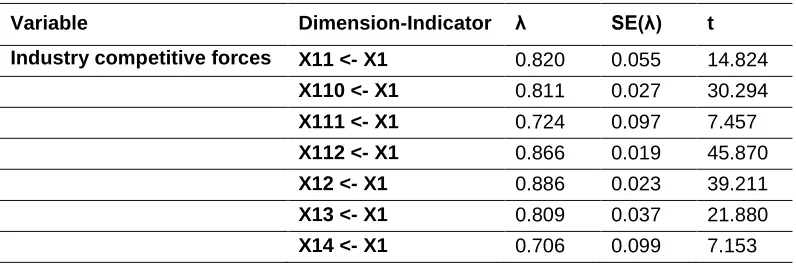
The usage of Second Order in the research model cause the loading factor gains describe the relationship between latent variable-dimension and dimension-indicator, as shown below.
Table 3. Loading Factor of Dimension – Indicator
Variable Dimension-Indicator λ SE(λ) t
Industry competitive forces X11 <- X1 0.820 0.055 14.824
X110 <- X1 0.811 0.027 30.294 X111 <- X1 0.724 0.097 7.457 X112 <- X1 0.866 0.019 45.870 X12 <- X1 0.886 0.023 39.211
Licensed under Creative Common Page 270
Variable Dimension-Indicator λ SE(λ) t
X15 <- X1 0.847 0.022 38.651 X16 <- X1 0.882 0.017 52.767
X17 <- X1 0.895 0.018 49.501 X18 <- X1 0.673 0.102 6.569 X19 <- X1 0.811 0.035 23.280 X21 <- X2 0.834 0.041 20.275
X22 <- X2 0.891 0.023 39.112 X23 <- X2 0.694 0.106 6.540 X24 <- X2 0.857 0.022 38.299 X25 <- X2 0.919 0.018 51.358
X26 <- X2 0.861 0.027 31.744 X27 <- X2 0.928 0.012 79.121 X28 <- X2 0.889 0.018 50.457 X31 <- X3 0.876 0.016 56.354
X310 <- X3 0.875 0.023 38.128 X311 <- X3 0.871 0.027 31.869 X312 <- X3 0.851 0.028 30.735 X32 <- X3 0.910 0.019 48.286
X33 <- X3 0.913 0.014 64.909 X34 <- X3 0.889 0.017 52.978 X35 <- X3 0.944 0.010 90.685
X36 <- X3 0.921 0.014 65.550 X37 <- X3 0.907 0.018 49.671 X38 <- X3 0.888 0.019 47.816 X39 <- X3 0.889 0.021 41.419 X41 <- X4 0.870 0.022 40.136
X410 <- X4 0.880 0.025 35.181 X42 <- X4 0.836 0.030 27.662 X43 <- X4 0.859 0.017 51.982 X44 <- X4 0.877 0.016 54.659
X45 <- X4 0.883 0.016 54.026 X46 <- X4 0.788 0.044 17.878 X47 <- X4 0.885 0.022 39.374
X48 <- X4 0.908 0.017 54.345 X49 <- X4 0.893 0.021 42.653 X51 <- X5 0.761 0.049 15.665 X510 <- X5 0.878 0.018 48.397 X511 <- X5 0.924 0.015 62.459
Licensed under Creative Common Page 271
Variable Dimension-Indicator λ SE(λ) t
X53 <- X5 0.814 0.036 22.420 X54 <- X5 0.866 0.020 43.523
X55 <- X5 0.865 0.021 42.093 X56 <- X5 0.881 0.022 40.422 X57 <- X5 0.920 0.017 55.587 X58 <- X5 0.821 0.031 26.460
X59 <- X5 0.895 0.018 49.023 X61 <- X6 0.731 0.170 4.312 X62 <- X6 0.935 0.018 52.598 Distinctive capabilities X71 <- X7 0.919 0.014 66.982
X72 <- X7 0.824 0.028 29.770 X73 <- X7 0.877 0.024 36.140 X81 <- X8 0.833 0.025 33.132 X82 <- X8 0.865 0.021 40.614
X83 <- X8 0.817 0.028 28.877 X84 <- X8 0.822 0.038 21.771 X85 <- X8 0.865 0.026 33.073 X86 <- X8 0.830 0.025 32.830
X87 <- X8 0.885 0.026 34.482 X88 <- X8 0.895 0.017 54.252
Competitiveness Y11 <- Y1 0.911 0.019 48.818
Y12 <- Y1 0.876 0.020 44.532 Y13 <- Y1 0.840 0.025 33.832 Y14 <- Y1 0.898 0.021 43.152 Y21 <- Y2 0.914 0.019 48.833 Y22 <- Y2 0.869 0.026 34.043
Y23 <- Y2 0.919 0.017 52.670 Y24 <- Y2 0.859 0.021 40.751 Y25 <- Y2 0.931 0.011 84.380 Y31 <- Y3 0.855 0.021 41.238
Y32 <- Y3 0.894 0.018 48.576 Y33 <- Y3 0.917 0.016 58.373 Y34 <- Y3 0.848 0.024 34.802 Company Performance Z11 <- Z1 0.953 0.009 100.933
Z12 <- Z1 0.956 0.008 116.496 Z21 <- Z2 0.930 0.011 82.676 Z22 <- Z2 0.939 0.010 95.774 Z31 <- Z3 0.945 0.012 75.881
Licensed under Creative Common Page 272 The result of measurement model analysis of the dimensions by their indicator show that the indicator is valid, which is most of the value of loading factor greater than 0.70 and the value of t greater than t table (2.02).
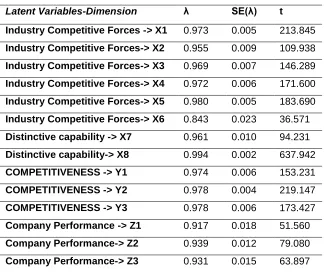
The measurement model of latent variables on the dimensions show to what extents the validity of dimensions in measuring latent variables. The table below show the result of measurement model of each latent variable on its dimension.
Table 4. Loading Factor of Latent Variables-Dimension
Latent Variables-Dimension λ SE(λ) t
Industry Competitive Forces -> X1 0.973 0.005 213.845
Industry Competitive Forces-> X2 0.955 0.009 109.938
Industry Competitive Forces-> X3 0.969 0.007 146.289
Industry Competitive Forces-> X4 0.972 0.006 171.600
Industry Competitive Forces-> X5 0.980 0.005 183.690
Industry Competitive Forces-> X6 0.843 0.023 36.571
Distinctive capability -> X7 0.961 0.010 94.231
Distinctive capability-> X8 0.994 0.002 637.942
COMPETITIVENESS -> Y1 0.974 0.006 153.231
COMPETITIVENESS -> Y2 0.978 0.004 219.147
COMPETITIVENESS -> Y3 0.978 0.006 173.427
Company Performance -> Z1 0.917 0.018 51.560
Company Performance-> Z2 0.939 0.012 79.080
Company Performance-> Z3 0.931 0.015 63.897
The result of measurement model analysis of variable on its dimension show that all of dimensions are valid with the value of t is greater than t table (2.02)with the value> 0.50.
Hypothesis Testing
a. Hypothesis 1. There is the influence of industry competitive forces and distinctive
capabilities on competitiveness
The structural model of the hypothesis is:
Licensed under Creative Common Page 273 Table 5. Simultaneous hypothesis testing of the influence of industry competitive forces and
distinctive capabilities on competitiveness
Hypothesis R2 F Conclusion
Industry competitive forces and distinctive capabilities
competitiveness
0,982 1066.37* Accept
*significant at α=0.05
According to the table above is known that with the degree of confidence of 95% (=0.05), simultaneously there are significant influence of industry competitive forces and distinctive capabilities to the competitiveness, equal to 98.2%, while the remaining 1.8% influenced by other factors not examined.
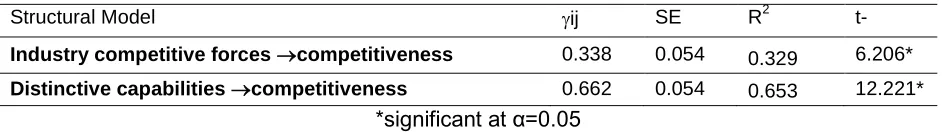
Table 6. Partial hypothesis testing of the influence of industry competitive forces and distinctive capabilities on competitiveness
Structural Model ij SE R2 t-
Industry competitive forces competitiveness 0.338 0.054 0.329 6.206*
Distinctive capabilities competitiveness 0.662 0.054 0.653 12.221* *significant at α=0.05
Partially, the exogenous variables significantly influence competitiveness, where the distinctive capabilities have a greater influence than industry competitive forces for competitiveness.
b. Hypothesis 2. There is the influence of industry competitive forces and distinctive
capabilities on Company Performance
The structural model of the hypothesis is : 𝜼𝟐 = 𝟎. 𝟑𝟓𝟐𝝃𝟏+ 𝟎. 𝟐𝟑𝟕𝝃𝟐+ 𝜻𝟐
Table 7. Simultaneous hypothesis testing of the influence of industry competitive forces and distinctive capabilities on company performance
Hypothesis R2 F Conclusion
Industry competitive forces and distinctive capabilities
company performance
0,341 10.077* Accept
*significant at α=0.05
According to the table above is known that with the degree of confidence of 95% (=0.05),
Licensed under Creative Common Page 274 Table 8. Partial hypothesis testing of the influence of industry competitive forces and distinctive
capabilities of company performance
Structural Model ij SE R2 t-
Industry competitive forces company performance 0.352 0.094 0.204 3.756*
Distinctive capabilities company performance 0.237 0.126 0.137 1.877
*significant at α=0.05
In the above table, shown that partially, only competitive forces that have a significant influence on performance, whereas no significant effect of distinctive capability.
c. Hypothesis 3. There is the influence of competitiveness on company performance
The structural model of the hypothesis is: 𝜼𝟐 = 𝟎. 𝟒𝟎𝟕𝜼𝟏+ 𝜻𝟑
Table 9. Partial Hypothesis testing of the influence of competitiveness on company performance
Structural model ij SE R2 t-
Competitiveness ->Company Performance 0.407 0.166 0.166 2.458*
*significant at α=0.05
In the above table, shown that competitiveness has a significant influence on company performance for 16.6%
d. Hypothesis 4. There is the influence of industry competitive forces and distinctive
capabilities on Company Performance through competitiveness
Table10. Simultaneous hypothesis testing of the influence of industry competitive forces and distinctive capabilities on Company Performance through competitiveness
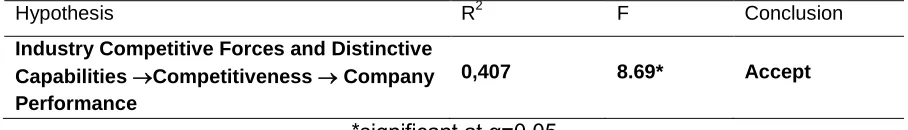
Hypothesis R2 F Conclusion
Industry Competitive Forces and Distinctive Capabilities Competitiveness Company Performance
0,407 8.69* Accept
*significant at α=0.05
Licensed under Creative Common Page 275 Table 11. Partial Hypothesis Testing of the influence of industry competitive forces and
distinctive capabilities on Company Performance through competitiveness
Structural Model ij SE t-
Industry Competitive Forces Competitiveness Company Performance 0.137 0.006 23.416*
Distinctive Capabilities Competitiveness Company Performance 0.269 0.006 45.951* *significant at α=0.05
In the table above is known that partially, exogenous variables significantly affect the company performance through competitiveness, where the distinctive capabilities have a greater influence than the industry competitive forces.
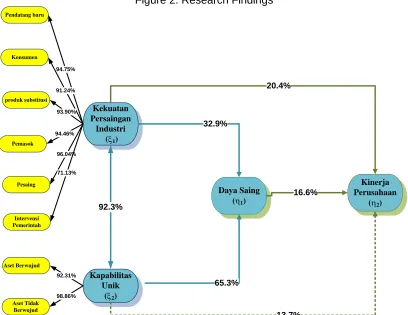
The results thus show that the increase in the adaptation of industry competitive forces and the developing of distinctive capabilities can improve company performance indirectly through its ability to improve competitiveness. 40.7% change in the company's performance caused by changes in the industry competitive forces and the distinctive capabilities that causes changes in competitiveness. The changes in the performance of the company's most dominant obtained from the influence that comes from the distinctive capabilities. Based on the above test results, it is revealed the results as illustrated in Figure 2 below:
Figure 2. Research Findings
Kekuatan Persaingan
Industri (x1)
Kapabilitas Unik
(x2)
Kinerja Perusahaan
(h2)
94.75% 91.24% 93.90% Pendatang baru Konsumen produk substitusi 94.46% 96.04% 92.31% Pemasok Pesaing Aset Berwujud 98.86% Aset Tidak Berwujud 71.13% Intervensi Pemerintah Daya Saing (h1)
Licensed under Creative Common Page 276 The results of the study illustrate that the distinctive capabilities is the dominant factor in improving competitiveness. The industry competitive forces have the significant effect on the performance of the company, while the distinctive capabilities have not a significant influence on the company's performance. The competitiveness affects the company's performance. The influence of industry competitive forces and the distinctive capabilities on the company's performance is greater if through the competitiveness. The improvement in the adaptation of industry competitive forces and the development of distinctive capabilities will improve company performance through competitiveness.
Based on these findings, in an effort to improve the company's performance in the banking industry in Indonesia, thus the development of competitiveness is a very important factor, especially on the most dimensions factor reflect the competitiveness that is, the products with superior quality and speed & excellent. Those efforts also need to be supported by the creation of a competitive price.
The distinctive capabilities is the dominant factor in the effort to develop a superior competitiveness. To increase competitive advantage, required an increase in intangible assets, which are supported by the increase in intangible assets. Meanwhile, to improve the ability to adapt the industry competitive forces, the most important aspect of adaptation is the strength of the competition, followed by adapting to the new entrants strength, power of suppliers, power of substitution products, consumer power, and the power of government intervention.
Based on the findings, it can be said that the increase in sales volume, profitability, and market share in the banking industry in Indonesia, is influenced by how the company can drive itself in competitiveness through the improvements in the distinctive capabilities and adapting the industry competitive forces.
Licensed under Creative Common Page 277 CONCLUSION AND SUGGESTIONS
The development of the distinctive capabilities and adaptation of industry competitive forces together is able to encourage the competitiveness of the banking company in Indonesia. Meanwhile, the distinctive capabilities are the aspects that play a greater role in encouraging superior competitiveness, compared to the adaptation of industry competitive forces. The competitiveness of companies is mainly formed by the development of intangible assets, compared to tangible assets.
The development of distinctive capabilities and adaptation of industry competitive forces together is able to drive the performance of the banking company in Indonesia. However, only the adaptation of industry competitive forces that contribute directly in improving company performance.
Competitiveness is significantly influence the performance of company that is mainly formed by the creation of products with superior quality and speed & excellent which is supported by the creation of a competitive price.
The development of distinctive capabilities and adaptation of industry competitive forces together is able to push the performance of the banking company in Indonesia through their ability to improve competitiveness.
It is hoped that the findings of this study can be used as a reference for further studies to related to the development of banking services, by making these findings as part of the premise in preparing the framework.
REFERENCES
Aras, Güler; Aybars, Asli; Kutlu, Ozlem, 2010, Managing corporate performance: Investigating the relationship between corporate social responsibility and financial performance in emerging markets; International Journal of Productivity and Performance Management 59.3 : 229-254.
Casadesus-Masanell, Ramon; Ricart, Joan E, 2010, Competitiveness: business model reconfiguration for innovation and internationalization, Management Research 8.2 : 123-149.
Castro, William Ariel Sarache ;Castro, Roberto Cespon ; Miron, Santiago Ibarra; Alonso Martinez, Pedro U, 2004, Modular manufacturing: an alternative to improve the competitiveness in the clothing industry, International Journal of Clothing Science and Technology 16.3/4 : 301-309.
Chin W., 2000, Partial Least Squares for Researchers: An Overview and Presentation of Recent Advances Using the PLS Approach, http://disc-nt.cba.uh.edu/chin/indx.html.
Ferguson, L. K., & Reio, G. T. (2010). Human resource management system and firm Performance .Journal of Management Development, 29(5), 471-494.
Hitt, Michael A.; Ireland, R. Duane; Hoskisson, Robert E., 2015, Strategic Management : Competitiveness & Globalization: Concepts and Cases, Eleventh Edition, Stamford : Cengage Learning.
Licensed under Creative Common Page 278 Ireland, DR, Hoskisson, RE, dan Hitt , MA, 2013, Understanding Business Strategy, 3rd edition, South-Western College.
Marr, B. and Schiuma, G., 2003, Business Performance Measurement - Past, Present, and Future, Management Decision, Vol. 41, No. 8, pp. 680-687.
Nordås, Hildegunn K; Kim, Yunhee, 2013, The Role of Services for Competitiveness in Manufacturing, OECD Trade Policy Papers 148.
Nunnaly, Jum.C, Ira H. Bernstein, 1994, Psychometric Theory, McGraw-Hill.
Pearce, John A. II, Richard B. Robinson, Jr., 2015, Strategic Management: Planning for Domestic & Global Competition, International Edition, New York : McGraw Hill.
Su, Jin; Gargeya, Vidyaranya B, 2012,Strategic sourcing, sourcing capability and firm performance in the US textile and apparel industry, Strategic Outsourcing: an International Journal 5.2 : 145-165.
Tangen, S., 2003, An overview of frequently used performance measures. Work study, 52(7), 347-354.
Thompson, Arthur A; Peteraf, Margareth A.; Gamble, John E.; Strickland III, A.J., 2014, Crafting and Executing Strategy, The Quest for Competitive Advantage, Concepts and cases, Nineteenth Edition, McGraw Hill Education.