INTERNATIONAL JOURNAL OF PHARMACEUTICAL, CHEMICAL AND BIOLOGICAL SCIENCES
Available online at www.ijpcbs.com
OPTIMIZATION OF THE PRODUCTION OF PROTEASE BY BACILLUS
CEREUS WITH RESPONSE SURFACE METHODOLOGY USING
GROUNDNUT SHELL
P. Rathakrishnan* and P. Nagarajan
Department of Chemical Engineering, Annamalai University, Annamalainagar-608002, Tamil Nadu, India.
INTRODUCTION
Proteases are enzymes that catalyze hydrolytic reactions in which protein molecules are degraded to peptides and amino acid. Protease enzymes have tremendous applications in both physiological and commercial fields. Among all the different commercial enzymes, microbial protease in particular, represents about 60% of all the industrial enzyme’s sales in the world due to their applications in several industrial sectors like in the detergent, food, pharmaceuticals, chemicals, leather, paper and pulp and silk industries1.
Proteases have a first place in the world market of enzymes, estimated at ~US$3 billion2.
Proteases are widely distributed in animals, plants, fungi and bacteria. Several alkaline proteases from different sources are currently in the market, but almost all are products of microbial origin. Protease are produced by both neutralophilic and alkaliphilic microorganisms. These two groups represent almost all sources of commercial proteases currently available in
the market3. Recently, large portions of
commercial protease are available from the
Bacillus species.
Microbial proteases are gaining more importance than conventional chemicals that cleave peptides because of the cheaper production cost and use of renewable resources. Microbial proteases can be produced from bacteria, fungi and yeast using many processes like solid-state Fermentation, submerged fermentation 4, 5, 6, 7.
Recently SSF has generated much interest, because it need lower manufacturing costs by utilizing unprocessed or moderately processed raw materials. Solid state fermentation is defined as the growth of microorganisms on moist solid substrates in the absence of free flowing water. The microorganisms obtain water, carbon, nitrogen, minerals, and other nutrients from the solid substrate. The substrate also provides anchorage for the micro organism, thus stimulate the growth condition occurring in nature 8.
Research Article
ABSTRACT
The production of protease was optimized using groundnut shell as a substrate by Bacillus cereus. The nutrient variables were selected in accordance with the Plackett-Burman design. Four significant variables (NaNO3, Tryptone, K2HPO4 and Malt extract) were selected for the
optimization studies. The selected components were optimized using Response Surface Methodological approach. The optimum conditions are: NaNO3 0.0386g/gds, Tryptone
0.0338g/gds, K2HPO4 0.2373g/gds and Malt extract 0.2090g/gds. A second-order model
equation was suggested and then validated experimentally. The maximum protease production was 74.62U/gds.
In SSF, solid material is non-soluble that acts both as physical support and source of nutrients. Solid material could be a naturally occurring solid substrate such as agricultural crops, agro-industrial residues or inert support 9, 10.
Production of biocatalysts using agro-biotech substrates under solid-state fermentation conditions provide several advantages in productivity, cost-effectiveness in labour, time and medium components in addition to environmental advantages like less effluent production, waste minimization, etc.11.
The present investigation aimed to describe the selection of medium components and to exploit the locally available, inexpensive agro-substrate, groundnut husk, for the optimal protease production using Bacillus
cereus under solid-state fermentation.
MATERIALS AND METHODS Bacterial strain
Bacterial strain used in this work is well preserved in the laboratory. Bacterial strain
Bacillus cereus was a stock of the Microbial
Type Culture collection Centre (MTCC), Chandigarh, India. The strain was maintained on nutrient agar medium at 4◦C. The medium composition (g/l) was comprised off the following: Beef extract 1.0; Yeast extract 2.0; Peptone 5.0; NaCl 5.0 and Agar 2.0. Cells were subcultured at monthly intervals.
Solid-state fermentation
Groundnut shell was collected from local market in Panruti, Tamilnadu, India. The shells were washed thoroughly with tap tap water and then dried. The dried materials obtained were milled and sieved to powder
for using as a carbon source for protease production. Fermentation was carried out in Erlenmeyer flasks (250 ml) with 10g of Groundnut shell powder, supplemented with nutrients concentrations defined by the experimental design. Each flask was covered with hydrophobic cotton and autoclaved at 121°C for 15 min. After cooling the flasks to room temperature, the flasks were inoculated with 2 ml 24-h grown culture broth under sterile conditions. The contents of the flasks were well mixed and incubated at 33±1ºC for 120 hrs.
During the preliminary screening process, the experiments are carried out for 5 days and it was found that at the 28 hrs, the maximum production occurs. Hence experiments are carried out for 28 hrs.
Extraction of Protease
The enzyme was extracted according to the method described by Nagamine et al. (2003)12. Fermented medium was mixed
thoroughly with 50 mM glycine–NaOH buffer, pH 11 for 30 min and the extract was separated by squeezing through a cloth. This process was repeated three times and extracts were pooled together and then centrifuged. The supernatant was used as enzyme source for protease assay.
Optimization of Protease production
RSM consist of a group of empirical techniques used for evaluation of relationship between cluster of controlled experimental factors and measured response. A prior knowledge with understanding of the related bioprocesses is necessary for a realistic modeling approach.
Table 1: Nutrients screening using a Plackett-Burman design
Nutrient Code Nutrient Low (-1) High (+1)
A NH4NO3 0.01 0.05
B Yeast extract 0.03 0.15
C NaNO3 0.01 0.05
D Tryptone 0.01 0.05
E Gelatin 0.03 0.15
F Maltose 0.03 0.15
G CaCl2 0.03 0.15
H ZnSO4 0.03 0.15
J CuSO4 0.03 0.15
K Malt extract 0.1 0.5
L MgSO4.7H2O 0.1 0.5
To determine which variables significantly affect protease production by Bacillus
Substilis, Plackett–Burman design was used.
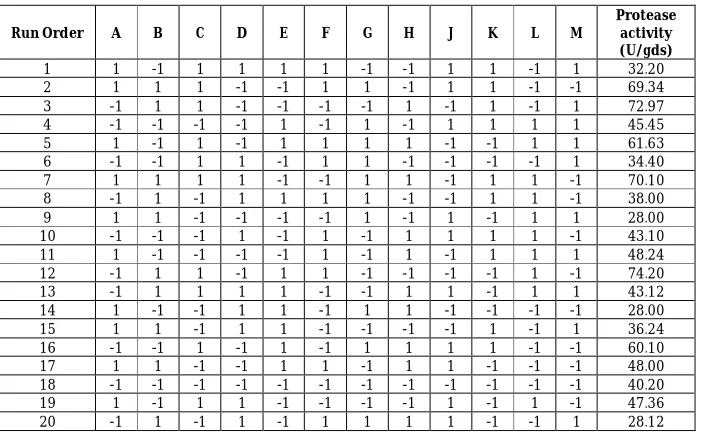
Twelve variables (Table 1) were screened in 20 experimental runs (Table 3) and insignificant ones were eliminated in order
to obtain a smaller, manageable set of factors. The low level (-1) and high level (+1) of each factor are listed in (Table 3). The statistical software package ‘Minitab 15’, was used for analyzing the experimental data.
Table 2: Plackett–Burman experimental design matrix for screening of important Variables for protease production
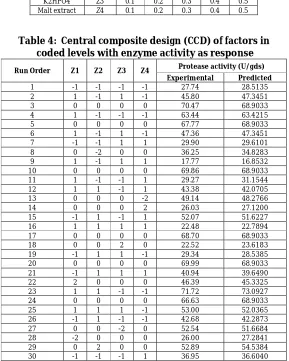
Once the critical factor were identified through the screening, the central composite design (CCD) was used to obtain a quadratic model, consisting of factorial trials and star points to estimate quadratic effects and central points to estimate the pure process variability with protease production as response. Response surface methodology (RSM) was employed to optimize the four significant factors viz., NaNO3, Tryptone, K2HPO4 and Malt extract which enhances the protease production. The four independent variables were studied at three different levels (Table 3) and a set of 30 experiments were carried out (Table 4). The statistical software package ‘Design Expert 7.1.5 was used to analyze the experimental data. All variables were taken at a central coded value of zero. The minimum and maximum ranges of variables investigated are listed in Table 3. Upon the completion of experiments, the
average maximum proteases were taken as the response (Y). A multiple regression analysis of the data was carried out for obtaining an empirical model that relates the response measured to the independent variables. A second order polynomial equation is:
……… (Eqn. 1)
Where Y is the measured response, β0 is the intercept term, βi are linear coefficients, βii are quadratic coefficient, βij are interaction
coefficient and Zi and Zj are coded independent variables. The optimal concentrations of the critical variables were obtained by analyzing contour plots. The statistical analysis of the model was represented in the form of analysis of variance (ANOVA).
Run Order A B C D E F G H J K L M
Protease activity (U/gds)
1 1 -1 1 1 1 1 -1 -1 1 1 -1 1 32.20
2 1 1 1 -1 -1 1 1 -1 1 1 -1 -1 69.34
3 -1 1 1 -1 -1 -1 -1 1 -1 1 -1 1 72.97
4 -1 -1 -1 -1 1 -1 1 -1 1 1 1 1 45.45
5 1 -1 1 -1 1 1 1 1 -1 -1 1 1 61.63
6 -1 -1 1 1 -1 1 1 -1 -1 -1 -1 1 34.40
7 1 1 1 1 -1 -1 1 1 -1 1 1 -1 70.10
8 -1 1 -1 1 1 1 1 -1 -1 1 1 -1 38.00
9 1 1 -1 -1 -1 -1 1 -1 1 -1 1 1 28.00
10 -1 -1 -1 1 -1 1 -1 1 1 1 1 -1 43.10
11 1 -1 -1 -1 -1 1 -1 1 -1 1 1 1 48.24
12 -1 1 1 -1 1 1 -1 -1 -1 -1 1 -1 74.20
13 -1 1 1 1 1 -1 -1 1 1 -1 1 1 43.12
14 1 -1 -1 1 1 -1 1 1 -1 -1 -1 -1 28.00
15 1 1 -1 1 1 -1 -1 -1 -1 1 -1 1 36.24
16 -1 -1 1 -1 1 -1 1 1 1 1 -1 -1 60.10
17 1 1 -1 -1 1 1 -1 1 1 -1 -1 -1 48.00
18 -1 -1 -1 -1 -1 -1 -1 -1 -1 -1 -1 -1 40.20
19 1 -1 1 1 -1 -1 -1 -1 1 -1 1 -1 47.36
Table 3: Ranges of the independent variables used in RSM
Variables Code
Levels (g/g dry substrate)
-2 -1 0 +1 +2
NaNO3 Z1 0.01 0.02 0.03 0.04 0.05 Tryptone Z2 0.01 0.02 0.03 0.04 0.05
K2HPO4 Z3 0.1 0.2 0.3 0.4 0.5
Malt extract Z4 0.1 0.2 0.3 0.4 0.5
Table 4: Central composite design (CCD) of factors in coded levels with enzyme activity as response
Assay of enzyme activities
Protease activity was determined using modified Auson–Hagihara method 13. In this
1 ml of the enzyme solution was added to 1 ml casein solution (1%, w/v casein solution prepared in 50 mM glycine–NaOH buffer, pH 11) and incubated at 70ºC for 20 min. The reaction was terminated by adding 4 ml of 10% trichloroacetic acid and the contents were filtered through a Whatman No. 1 filter paper. The filtrate absorbance was read at 280 nm using UV–Visible spectrophotometer and the protease activity was calculated using tyrosine standard curve. One unit of alkaline protease activity was defined as 1 µg of
tyrosine liberated ml‾1 under the assay
conditions.
Validation of the experimental model
The statistical model was validated with respect to protease production under the conditions predicted by the model in shake-flasks level. Samples were drawn at the desired intervals and protease activity was determined as described above.
RESULT AND DISCUSSION
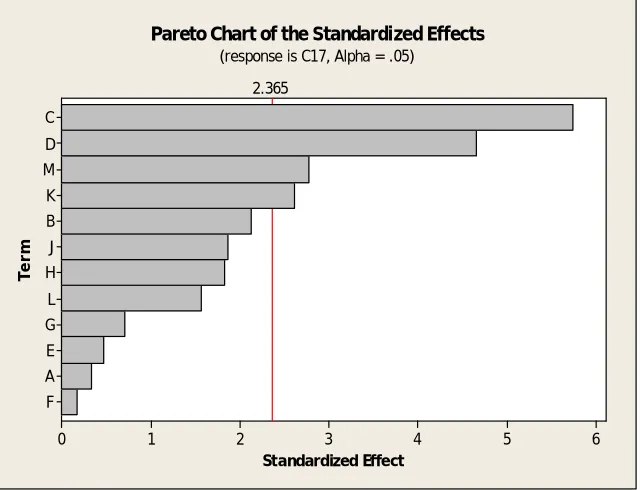
Plackett–Burman experiments (Table 2) showed a wide variation in protease activity. This variation reflected the importance of optimization to attain higher productivity. From the Pareto chart (Fig.1)
Run Order Z1 Z2 Z3 Z4 Protease activity (U/gds)
Experimental Predicted
1 -1 -1 -1 -1 27.74 28.5135
2 1 -1 1 -1 45.80 47.3451
3 0 0 0 0 70.47 68.9033
4 1 -1 -1 -1 63.44 63.4215
5 0 0 0 0 67.77 68.9033
6 1 -1 1 -1 47.36 47.3451
7 -1 -1 1 1 29.90 29.6101
8 0 -2 0 0 36.25 34.8283
9 1 -1 1 1 17.77 16.8532
10 0 0 0 0 69.86 68.9033
11 1 -1 -1 1 29.27 31.1544
12 1 1 -1 1 43.38 42.0705
13 0 0 0 -2 49.14 48.2766
14 0 0 0 2 26.03 27.1200
15 -1 1 -1 1 52.07 51.6227
16 1 1 1 1 22.48 22.7894
17 0 0 0 0 68.70 68.9033
18 0 0 2 0 22.52 23.6183
19 -1 1 1 -1 29.34 28.5385
20 0 0 0 0 69.99 68.9033
21 -1 1 1 1 40.94 39.6490
22 2 0 0 0 46.39 45.3325
23 1 1 -1 -1 71.72 73.0927
24 0 0 0 0 66.63 68.9033
25 1 1 1 -1 53.00 52.0365
26 -1 1 -1 -1 42.68 42.2873
27 0 0 -2 0 52.54 51.6684
28 -2 0 0 0 26.00 27.2841
29 0 2 0 0 52.89 54.5384
the variables viz., NaNO3, Tryptone, K2HPO4 and Malt extract were selected for
further optimization to attain a maximum response.
F A E G L H J B K M D C
6 5
4 3
2 1
0
T
e
rm
Standardized Effect 2.365
Pareto Chart of the Standardized Effects (response is C17, Alpha = .05)
Fig. 1: Pareto chart showing the effect of media components on protease activity (C-NaNO3, D-Tryptone, M-K2HPO4 and K-Malt extract)
The levels of factors (NaNO3, Tryptone, K2HPO4 and Malt extract) and the effect of their interactions on protease production were determined by central composite design of RSM. Thirty experiments were performed at different combinations of the factors shown in Table 3. The predicted and observed responses along with design
matrix are presented in Table 4 and the results were analyzed by ANOVA. The second-order regression equation provided the levels of protease activity as the function of NaNO3, Tryptone, K2HPO4 and Malt extract, which can be presented in terms of coded factors as in the following equation:
Y = 68.90+4.51 Z1+4.93 Z2-7.01 Z3-5.29 Z4-1.03 Z1 Z2-1.83 Z1 Z3-10.09 Z1 Z4-1.24 Z2 Z3+0.31 Z2 Z4+0.44 Z3 Z4-8.15 Z12-6.06 Z22 -7.82 Z32-7.80 Z42 (Eqn. 2)
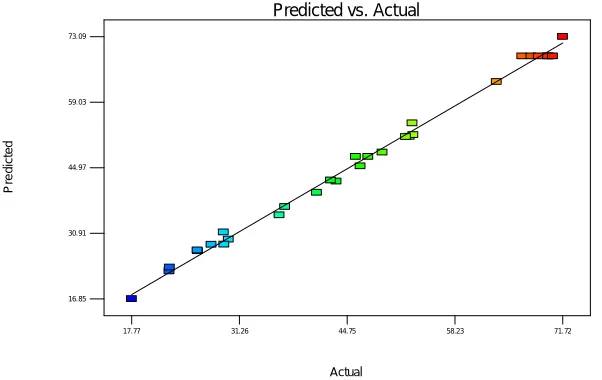
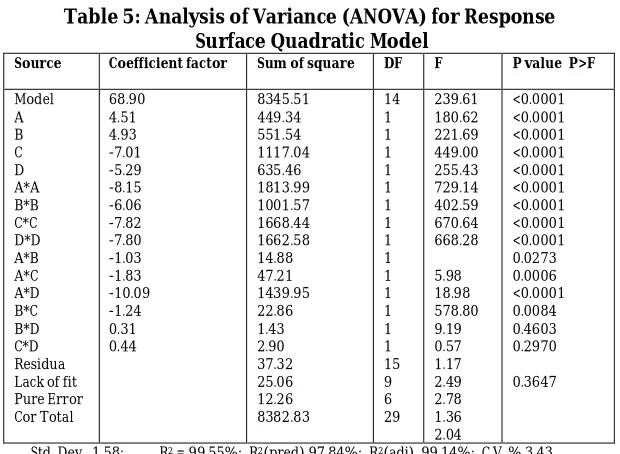
Where Y is the protease activity (U/gds), Z1, Z2, Z3 and Z4 are NaNO3, Tryptone, K2HPO4 and Malt extract respectively. ANOVA for the response surface is shown in Table 5. The Model F-value of 239.61implies the model is significant. There is only a 0.01% chance that a "Model F-Value" this large could occur due to noise. Values of "Prob > F" less than 0.05 indicate model terms are significant. Values greater than 0.1 indicate the model terms are not significant. In the present work, A, B, C, D, AD, A2, B2, C2, D2 were significant for Protease production. The coefficient of determination (R2) for protease activity was
calculated as 0.9955, which is very close to 1 and can explain up to 99.55% variability of the response. The predicted R2 value of
0.9784 was in reasonable agreement with the adjusted R2 value of 0.9914. An
adequate precision value greater than 4 is desirable. The adequate precision value of 50.425 indicates an adequate signal and suggests that the model can be used to navigate the design space.
.
Actual
P
re
d
ic
te
d
Predicted vs. Actual
16.85 30.91 44.97 59.03 73.09
17.77 31.26 44.75 58.23 71.72
Fig. 2: Predicted response versus actual value
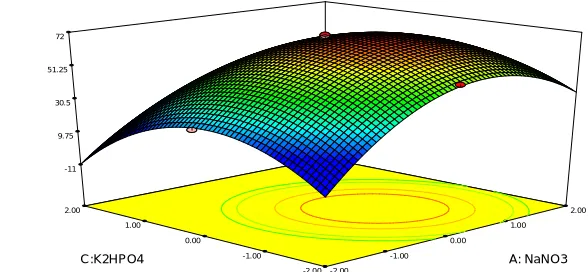
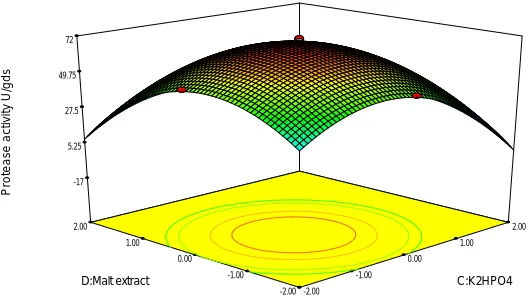
The interaction effects of variables on protease production were studied by plotting 3D surface curves against any two independent variables, while keeping another variable at its central (0) level. The 3D curves of the calculated response (protease production) and contour plots from the interactions between the variables are shown in Figs. 3-8. Figure 3 shows the dependency of protease on NaNO3 and Tryptone. The protease activity increased with increase in NaNO3 to about 0.0386 g/gds and thereafter protease activity decreased with further increase in NaNO3.
The same trend was observed in figs. 4&5. Increase in Tryptone resulted increase in protease activity up to 0.0338 g/gds. This is evident from Figs.6, 7. Figure 8 shows the dependency of protease activity on K2HPO4. The optimal operation conditions of NaNO3, Tryptone, K2HPO4 and Malt extract for maximum protease activity were determined by response surface analysis and also estimated by regression equation. The predicted results are shown in Table 5. The predicted values from the regression equation closely agreed with that obtained from experimental values.
-2.00 -1.00
0.00 1.00
2.00
-2.00 -1.00 0.00 1.00 2.00 -11 9.5 30 50.5 71
P
ro
te
a
s
e
a
c
ti
vi
ty
U
/g
d
s
A: NaNO3 B: Tryptone
-2.00 -1.00
0.00 1.00
2.00
-2.00 -1.00 0.00 1.00 2.00 -11 9.75 30.5 51.25 72
P
ro
te
a
se
a
ct
iv
it
y
U
/g
d
s
A: NaNO3 C:K2HPO4
Fig. 4: 3D Plot showing the effect of NaNO3
and K2HPO4 on protease activity
-2.00 -1.00
0.00 1.00
2.00
-2.00 -1.00 0.00 1.00 2.00 -40 -10 20 50 80
P
ro
te
a
s
e
a
c
ti
vi
ty
U
/g
d
s
A: NaNO3 D:Malt extract
Fig. 5: 3D Plot showing the effect of NaNO3 and Malt extract on protease activity
-2.00 -1.00
0.00 1.00
2.00
-2.00 -1.00 0.00 1.00 2.00
-6 13.5 33 52.5 72
P
ro
te
a
s
e
a
c
ti
v
it
y
U
/g
d
s
B: Tryptone C:K2HPO4
-2.00 -1.00
0.00 1.00
2.00
-2.00 -1.00 0.00 1.00 2.00
-9 11 31 51 71
P
ro
te
a
s
e
a
c
ti
v
it
y
U
/g
d
s
B: Tryptone D:Malt extract
Fig. 7: 3D Plot showing the effect of Tryptone and Malt extract on protease activity
-2.00 -1.00
0.00 1.00
2.00
-2.00 -1.00 0.00 1.00 2.00 -17 5.25 27.5 49.75 72
P
ro
te
a
s
e
a
c
ti
v
it
y
U
/g
d
s
C:K2HPO4 D:Malt extract
Fig. 8: 3D Plot showing the effect of K2HPO4
and Malt extract on protease activity
Validation of the experimental model
Validation of the experimental model was tested by carrying out the batch experiment under optimal operation conditions (NaNO3 0.0386g/gds, Tryptone 0.0338g/gds, K2HPO4 0.2373g/gds and Malt extract 0.2090g/gds.) established by the regression model. Three repeated experiments were performed and the results are compared. The protease activity (71.72U/gds) obtained from experiments was very close to the actual response (73.09 U/gds) predicted by the regression model, which proved the validity of the model.
CONCLUSION
Protease production by Bacillus sp.strain under solid-state fermentation was influenced by physiological and chemical nature of the groundnut shell husk and associated with growth of the microbial strain. In this work, Plackett-Burman design was used to test the relative importance of
medium components on protease
protease production were as follows:
NaNO3 0.0386g/gds, Tryptone
0.0338g/gds, K2HPO4 0.2373g/gds and Malt extract 0.2090g/gds. Overall, the highest protease activity (74.62 U/gds) achieved in this study was lower compared to the regular proteases used industrially, which are mainly in the purified form. One should also take into account that the present protease activity in this study is from a crude enzyme, obtained purely from a strain, which did not go through any strain improvement study in this regard.
Furthermore, a characterization after purification and possible application study of this enzyme would be a task to do in future.
ACKNOWLEDGMENT
The authors wish to express their gratitude for the support extended by the authorities of Annamalai University, Annamalainagar, India in carrying out the research work in Bioprocess laboratory, Department of Chemical Engineering.
Table 5: Analysis of Variance (ANOVA) for Response Surface Quadratic Model
Std. Dev. 1.58; R2 = 99.55%; R2(pred) 97.84%; R2(adj) 99.14%; C.V. % 3.43
REFERENCES
1. Gupta R, Beg QK and Lorenz P. Bacterial alkaline proteases:
molecular approaches and
industrial applications. Applied Microbiology and Biotechnology. 2002;59:15–32.
2. Leary D, Vierros M, Hamon G, Arico S and Monagle C. Marine genetic resources: a review of scientific and commercial interest. Marine Policy. 2009;33:183-94.
3. Moon SY, Oh TK and Rho HM. Purification and characterization of an extra cellular alkaline protease
from Bacillus subtilis RM 615. Korean Biochemical Journal. 1994; 27:323-329.
4. Germano S, Pandey A, Osaku CA, Rocha SN and Soccol CR. Characterization and stability of proteases from Penicillium sp.
produced by solid-state
fermentation. Enzyme Microbial Technology. 2003;32:246–251. 5. Pandey A, Soccol CR,
Rodriguez-Leon JA and Nigam P. Solid State Fermentation in Biotechnology: Fundamentals and Applications. (2001) Asiatech Publishers, New Delhi.
Source
Coefficient factor Sum of square DF F P value P>F
6. Haki GD and Rakshit SK. Developments in industrially important thermostable enzymes: a review. Bioresource Technology. 2003;89:17–34.
7. Sandhya C, Sumantha A, Szakacs G, and Pandey A. Comparative evaluation of neutral protease production by Aspergillus oryzae in submerged and solid-state fermentation. Process Biochemistry. 2005;40:2689–2694.
8. Pérez-Guerra N, Torrado-Agrasar A, López-Macias C and Pastrana I. Main characterstics and applications of solid substrate fermentation. Electronic Journal of Environmental Agricultural Food chemistry. 2003;2:33-350.
9. Pandey A. Recent process developments in solid-state
fermentation. Process
Biochemistry. 1992;27:109–117.
10.Pandey A. Solid-state fermentation. Biochemical engineering journal. 2003;13:81-84.
11.Pandey A, Soccol CR, Nigam P, Brand D, Mohan R and Roussos S. Biotechnological potential of coffee pulp and coffee husk for
bioprocesses. Biochemical
Engineering Journal. 2000;6:153-162.
12. Nagamine K, Murashima K, Kato T, Shimoi H and Ito K. Mode of alpha-amylase production by the Shochu Koji Mold Aspergillu skawachii. Bioscience Biotechnology & Biochemistry. 2003;67:2194-2202. 13.Hagihara B, Matsubara H, Nakai M