User Interactive Image Segmentation For
Efficient Image Database Indexing
Ms. Anjali Ananthan Mr. R Jayadevan
PG student (M..Tech) Research Scholar
Department of Applied Electronics and Communication Department of Electrical Engineering Thejus Engineering College Government Engineering College Thrissur
Mr. Mahesh K R Assistant Professor
Department of Computer Applications Thejus Engineering College
Abstract
This paper is mainly focussing on the area image database indexing. For this purpose a user interactive image segmentation algorithm is applied to the input image. After performing segmentation of the input image only the desired portion of the ima ge i.e., the foreground is extracted. Interactive segmentation stage is followed by a feature extraction process that is performed for the image database as well as the region database. The features extracted include some colour features and texture features. Then using Manhattan distance a similarity measurement is done for images under same concept as well as images under different concept for both images in database as well as well as for segmented regions. It is found that user interactive image segmentation proves to be a very efficient method of indexing of image database.
Keywords: Feature extraction, Indexing, Manhattan distance, Mean shift clustering, Merging, Neighbourhood Classification, Pruning, User interactive segmentation
________________________________________________________________________________________________________
I.
I
NTRODUCTIONIn this present digital world data is of great importance. All physical activities are recorded and stored in the form of digital data. The production of digital data is increasing in an exponential rate. This is very alarming. Image is one of the most important type of data which is in use nowadays. For efficient storing and managing of data, the data must be very efficiently indexed. Indexing of image may be efficiently performed by image segmentation process. Using an index structure helps dramatically in minimizing the retrieval time because the system does not have to go through the whole set of features when looking for images, but can simply retrieve the most similar images according to the index. In this paper we are developing an efficient image database indexing mechanism by using user interactive image segmentation technique. Here indexing is performed after segmentation of the image.
II.
R
ELATED WORKSIII.
P
ROPOSED APPROACHData in the form of image is of great importance in today’s digital world. Image storing and indexing plays a very key role in todays scenario. Indexing of image using appropriate algorithm reduces the time taken and improves the accuracy of image retrieval technique. This paper provides an efficient platform for efficient storing and indexing of image database so that it will greatly help in image retrieval process. Here user interactive image segmentation approach along with region based indexing is used.
Approach of Proposed System: A.
In this paper as far as indexing is considered, region based indexing is used. Keyword based indexing helps us to index the images based on the similarity in key words or high level semantics. Region based indexing is used to obtain visually similar images and represent low level feature. As far as the image segmentation technique used in this paper, both automated and manual image segmentation have drawbacks like undesired segmentation & time consuming. Hence in this project Semi automated/User Interactive segmentation is used.
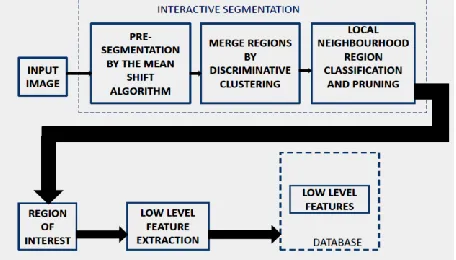
Fig. 1: Block Diagram Showing Proposed System
In this paper as can be seen from the block diagram the input image is obtained from the user. Then it is subjected to interactive image segmentation. It is composed of mainly 3 steps. On performing user interactive image segmentation we obtain various regions/ objects within the image that will define the ROI of the image. This process of segmentation begins by the following steps: 1) Given an input image. 2) Obtain the user input to define ROI in the form of a bounding box 3) Markers/Pixel selection are used to distinguish foreground and background within the bounding box. 4) The region within the bounding box is processed to yield the desired segmentation results. The region within the bounding box is processed by the interactive image segmentation. The process of interactive image segmentation consists of following 3 steps: 1) Pre-segmentation by the mean shift algorithm: The region inside the bounding box is over-segmented using mean-shift clustering algorithm. In this step the user picks the upper left and lower right of the bounding box for the object that is to be cut out and then strokes are added to specify the foreground region and possibly the background. Since the bounding box serves as background sampling, in most cases the user only needs to indicate the foreground. Background strokes may be addedonly if the background is complex. The image that is selected is first over-segmented using the mean-shift algorithm. 2) Merge regions by discriminative clustering: This step is important as it makes our method faster than the existing techniques. It is necessary to merge the unmarked regions in the image as either foreground or background. Consider that there are foreground regions selected by the user, and for background region, selected background regionsis . For every region denoted by ∈ and ∈ , mean colors μ and
μ is calculated in CIELab color-space. The minimum value of difference between the mean colors of the selected foreground and background regions is computed. It is denoted by the threshold for further clustering purpose. It means
= min(μ ). Suppose is smaller than threshold λ, then it is doubled. In this case, λ is set to 2. For
each type of selected regions two three dimensional kd-trees are constructed.Each node of the foreground kd-tree, stores the mean color of one selected foreground region, and in the background kd-tree, each node stores the mean color of one selected background region. For each unselected region Su, the algorithm takes its mean color as a query point in the 3D space and searches nearest neighbor search in those two kd-trees.This produces the selected regions and that have the most similar mean color to it, and the color differences and .Let = .If , Su is marked as
background. If , Su is marked as foreground. 3) Local neighborhood region classification and pruning:
then the process is repeated. If again there is a tie in terms of the most similarly labeled neighbouring region, the label of the region that has the most similar color variance is used. 2) After all the regions have been selected as either foreground or background; a connected component algorithm is applied to find isolated foreground or background regions that are surrounded by regions of the opposite labeling. A set of rules is specified to decide whether the isolated regions’ label should be changed. They will be changed to the opposite label only when the following conditions are satisfied.(a) The region was not selected by the user. (b) The region is not the biggest region with that label. (c) The region is smaller than its surrounding regions.
Feature Extraction: B.
Database consists of images from variety of concepts. After performing user interactive segmentation the segmented outputs are stored. Feature extraction of both database and segmented results is carried out. Feature extraction of both the database and segmented results is carried out. The main features as far as an image is considered includes colour, texture, shape and edges. After feature extraction the similarity between the images is measured both in case of database and in case of segmented output. More similarity between images in the same concept is found in case of segmented output. The features that are extracted for both image database and segmented output includes the following four features:
1) Energy and Standard Deviation of Contourlet Coefficients- For Texture Feature 2) ColourAutocorrelogram
3) R G B Colour Moments For colour feature 4) H S V Colour Histogram
Similarity Measurement: C.
After the calculation of all texture and colour features all the images in database is represented in terms of its feature vector. Same steps are carried out for the segmented regions too and all images in the segmented regions is also represented in terms of its feature vector.Any 2 images in database is considered and similarity is expressed in terms of Manhattan distance
Where and are feature vectors of the two images in the database.Same step is repeated for the segmented images also. Manhattan distance of segmented region is given by the equation:
Where and are feature vectors of the two images in the segmented region database. It is observed that the distance between any 2 images under same concept in the segmented region is less when compared to same case in database. It indicates that on segmenting the image database the similarity between images increases. Hence user interactive segmentation proves to be very efficient tool for efficient representation of image database.
IV.
E
XPERIMENTAL RESULTSThis section consists of the simulation results of the proposed technique .The performance evaluation is carried out on nearl y 100 general category natural images which are downloaded from Google search. The simulations were carried out using MATLAB version 7.6.0.324 (R 2008 a).
Interactive Image Segmentation Results: A.
The proposed algorithm provides a faster way to segment the image based on pre-segmented regions. The proposed algorithm only involves simple clustering, local neighbourhood analysis on much fewer ambiguous regions, and simple image processing.Here an image of building with a lake and sky as background and a bird with tree as background is considered as input. After segmentation the foreground region ie the building/bird alone will be obtained as the segmented region and it will be stored for further similarity measurements.
2 1
12 f f
DM
image
2 1
12
f
f
Fig. 2: Results of proposed algorithm: (a) Original image with bird/ building/ aeroplane (top-left) as foreground. (b) Over segmentation within bounding box (top-right). (c) Selected Foreground in white and background in black (middle-left). (d)Merge
regions by discriminative clustering (middle-right). (e) Result after local neighbourhood classification (bottom-left). (f) Final result after pruning (bottom-right).
Similarity Measurement Results: B.
On comparing any 2 images under same concept the distance in case of segmented regions is found to be less than in the case of image database which shows that similarity is more after segmenting the images. On the otherhand on comparing any 2 images under different concept the distance in case of segmented regions is found to be more than in the case of image database which shows that similarity is less after segmenting the images.
Fig. 3: Original Image and Segmented Image. Distance between original images = 14.8774. Distance between segmented regions = 5.6557
Fig. 4: Original Image and Segmented Image. Distance between original images =16.3434. Distance between segmented regions = 20.1709
Similarity Measurement Comparison: C.
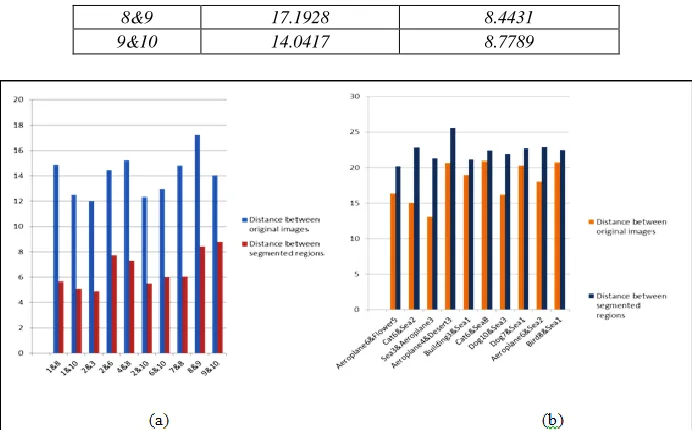
Inorder to measure the similarity we can for sample take a concept aeroplane. 10 different images of aeroplanes and its corresponding segmented regions are sown below. On comparing random images from the concept aeroplane in terms of manhattan distance measure and also their corresponding segmented images it is found that similarity is more in case of segmented regions than for whole image. Table I justifies this. Whereas on the other had if we take random images from our database from different concepts and compare them the similarity decreases in case of segmented region compared to the whole image. It is plotted in the form of graph in Fig. 7
Fig 5: (A) Images of Concept Aeroplane. (B) Segmented Results of Concept Aeroplane
Table 1:
Similarity Measure Comparison forConcept Aeroplane
Aeroplane Images
Distance between original images
Distance between segmented regions
1&8 14.8774 5.6557
1&10 12.4682 5.0781
2&3 12.0021 4.878
2&6 14.4018 7.7165
4&8 15.2101 7.3228
2&10 12.3259 5.525
6&10 12.9763 5.9874
8&9 17.1928 8.4431
9&10 14.0417 8.7789
Fig. 6: (A) Graph Showing Similarity Comparison Of Whole Image And Segmented Region For Concept Aeroplane (B) Graph Showing Similarity Comparison Of Whole Image And Segmented Region For Variety Of Concepts
V.
C
ONCLUSIONIn this paper an efficient indexing mechanism for image database is developed using user interactive image segmentation. User interactive image segmentation is performed that makes use of mean shift clustering algorithm . After that feature extraction of the database and segmented region is done. Mainly texture and colour features are extracted. Similarity measurement of both sets is then performed using Manhattan distance. It is observed that the similarity of image is higher in case of segmented images when compared to image database as the value of Manhattan distance is lower on taking the concept and viceversa on taking different. Hence this method is found to be a fast and efficient method for effective representation/indexing of the image database.
R
EFERENCES[1] Chad Carson, Serge Belongie, Hayit Greenspan, and Jitendra Malik: Blobworld: Image Segmentation Using Expectation-Maximization and Its Application to Image Querying
[2] Dingding Liu , Kari Pulli , Linda G. Shapiro :Fast Interactive Image Segmentation by Discriminative Clustering
[3] JifengNingab,c, LeiZhanga, DavidZhanga, ChengkeWub:Carsten Rother Vladimir Kolmogorov. Microsoft Research Cambridge, UK Andrew Blake:“GrabCut"- Interac tive Foreground Extraction using Iterated Graph Cuts
[4] RamyaHebbalaguppe, Kevin McGuinness, JogileKuklyte, Graham Healyv Noel O’Connor and Alan Smeaton 2013 IEEE: How Interaction Methods Affect Image Segmentation: User Experience in the Task
[5] Wenxian Yang, JianfeiCai, Senior Member, IEEE, JianminZheng, and JieboLuo, Fellow, IEEE : User-friendly Interactive Image Segmentation through Unified Combinatorial User Inputs
[6] Carolina Galleguillos Andrew Rabinovich Serge Belongie2008 IEEE: Object Categorization using Co-Occurrence, Location and Appearance [7] P. Arbel´aez and L. Cohen. Constrained image segmentation from hierarchical boundaries. In Proc. CVPR, pages 1–8, 2008.
[8] P. Arbel´aez, M. Maire, C. Fowlkes, and J. Malik. From contours to regions: An empirical evaluation. In Proc. CVPR, pages 2294–2301, 2009.
[9] A. Blake, C. Rother, M. Brown, P. Perez, and P. Torr. Interactive image segmentation using an adaptive GMMRF model. Lecture Notes in Computer Science, pages 428–441, 2004.
[10] Y. Boykov and M. Jolly. Interactive graph cuts for optimal boundary and region segmentation of objects in ND images. In Proc. ICCV, pages 105–112, 2001.
[11] Y. Li, J. Sun, C.-K. Tang, and H.-Y. Shum. Lazy snapping. ACM Trans. Graph., 23(3):303–308, 2004.
[12] H. Lombaert, Y. Sun, L. Grady, and C. Xu. A Multilevel Banded Graph Cuts . Lazy snapping. ACM Trans. Graph., 23(3):303–308, 2004.
[13] J. Wang. Discriminative Gaussian mixtures for interactive image segmentation. In IEEE International Conference on Acoustics, Speech and Signal Processing (ICASSP), pages 386–396, 2007.
[14] S. Vicente, V. Kolmogorov, and C. Rother. Joint optimization of segmentation and appearance models. In Proc. ICCV, 2009. [15] Ning-San Chang And King-Sun Fu, Fellow, IEEE; Query-by-Pictorial-Example
[16] N. S. Chang Hewlett-Packard Design Aids , K. S. Fu Purdue University: Picture Query Languages for Pictorial Data-Base Systems
[17] Goran J. Zajić, Nenad S. Kojić, and Branimir D. Reljin, Senior Member, IEEE Telfor Journal, Vol. 4, No. 2, 2012:Improving CBIR Systems Using Automated Ranking
[18] Christian Breiteneder, Horst Eidenberger University Of Vienna ,Institute For Computer Science And Business Informatics: Automatic Query Generation For Content based Image Retrieval
[19] John R. Smith and Shih:VisualSEEk: a fully automated content-based image query System [20] Wei-Ying Ma, B. S. Manjunath :NeTra: A toolbox for navigating large image databases