R E S E A R C H
Open Access
Maternal dietary intake of nitrates, nitrites and
nitrosamines and selected birth defects in
offspring: a case-control study
John C Huber Jr
1, Jean D Brender
1*, Qi Zheng
1, Joseph R Sharkey
2, Ann M Vuong
1, Mayura U Shinde
1,
John S Griesenbeck
3, Lucina Suarez
4, Peter H Langlois
4, Mark A Canfield
4, Paul A Romitti
5, Peter J Weyer
6and the
National Birth Defects Prevention Study
Abstract
Background:Dietary intake of nitrates, nitrites, and nitrosamines can increase the endogenous formation of N-nitroso compounds in the stomach. Results from animal studies suggest that these compounds might be teratogenic. We examined the relationship between maternal dietary intake of nitrates, nitrites (including plant and animal sources as separate groups), and nitrosamines and several types of birth defects in offspring.
Methods:For this population-based case–control study, data from a 58-question food frequency questionnaire, adapted from the short Willett Food Frequency Questionnaire and administered as part of the National Birth Defects Prevention Study (NBDPS), were used to estimate daily intake of dietary nitrates, nitrites, and nitrosamines in a sample of 6544 mothers of infants with neural tube defects (NTD)s, oral clefts (OC)s, or limb deficiencies (LD)s and 6807 mothers of unaffected control infants. Total daily intake of these compounds was divided into quartiles based on the control mother distributions. Odds ratios (OR)s and 95% confidence intervals (CI)s were estimated using logistic regression; estimates were adjusted for maternal daily caloric intake, maternal race-ethnicity, education, dietary folate intake, high fat diet (> 30% of calories from fat), and state of residence.
Results:While some unadjusted ORs for NTDS had 95% (CI)s that excluded the null value, none remained
significant after adjustment for covariates, and the effect sizes were small (adjusted odds ratios [aOR] <1.12). Similar results were found for OCs and LDs with the exception of animal nitrites and cleft lip with/without cleft palate (aORs and CIs for quartile 4 compared to quartile 1 =1.24; CI=1.05-1.48), animal nitrites and cleft lip (4th quartile aOR=1.32; CI=1.01-1.72), and total nitrite and intercalary LD (4th quartile aOR=4.70; CI=1.23-17.93).
Conclusions:Overall, odds of NTDs, OCs or LDs did not appear to be significantly associated with estimated dietary intake of nitrate, nitrite, and nitrosamines.
Keywords:Congenital malformation, Diet, Nitrate, Nitrite, Nitrosamine, Pregnancy
Background
Findings from a few epidemiologic studies have suggested that prenatal exposure to nitrates (from drinking water) [1] and nitrites, especially in conjunction with nitrosatable drugs [2,3], are associated with neural tube defects (NTD)s. About five percent of nitrate is converted to nitrite after
ingestion [4]. This nitrite along with dietary nitrite can react with amines and amides in an acidic environment such as that found in the stomach to form nitrosamines and nitrosamides [5]. Results from several animal studies have indicated that variousN-nitroso compounds may be terato-genic [6-11]. In hamsters, nitrosamines have been noted to cross the placental barrier [12], even at low doses [13].
In our previous studies of maternal nitrosatable drug exposure among study participants in the National Birth Defects Prevention Study (NBDPS), we found that 24% of the control women (mothers who gave birth to babies * Correspondence:[email protected]
1Department of Epidemiology and Biostatistics, The Texas A&M Health
Science Center School of Rural Public Health, MS 1266 TAMU, College Station, TX 77843-1266, USA
Full list of author information is available at the end of the article
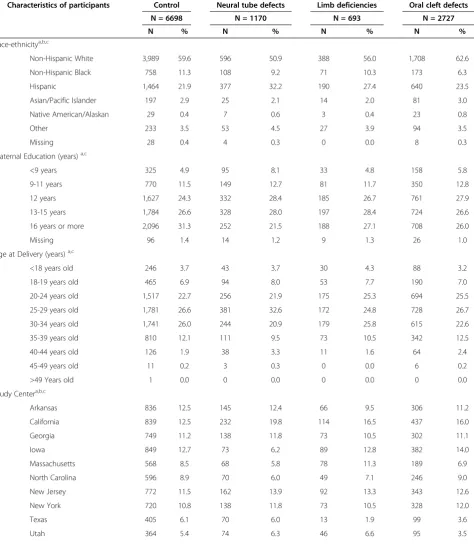
Table 1 Selected maternal characteristics of birth defect cases and controls in the National Birth Defects Prevention Study, 1997-2005
Characteristics of participants Control Neural tube defects Limb deficiencies Oral cleft defects
N = 6698 N = 1170 N = 693 N = 2727
N % N % N % N %
Race-ethnicitya,b,c
Non-Hispanic White 3,989 59.6 596 50.9 388 56.0 1,708 62.6
Non-Hispanic Black 758 11.3 108 9.2 71 10.3 173 6.3
Hispanic 1,464 21.9 377 32.2 190 27.4 640 23.5
Asian/Pacific Islander 197 2.9 25 2.1 14 2.0 81 3.0
Native American/Alaskan 29 0.4 7 0.6 3 0.4 23 0.8
Other 233 3.5 53 4.5 27 3.9 94 3.5
Missing 28 0.4 4 0.3 0 0.0 8 0.3
Maternal Education (years)a,c
<9 years 325 4.9 95 8.1 33 4.8 158 5.8
9-11 years 770 11.5 149 12.7 81 11.7 350 12.8
12 years 1,627 24.3 332 28.4 185 26.7 761 27.9
13-15 years 1,784 26.6 328 28.0 197 28.4 724 26.6
16 years or more 2,096 31.3 252 21.5 188 27.1 708 26.0
Missing 96 1.4 14 1.2 9 1.3 26 1.0
Age at Delivery (years)a,c
<18 years old 246 3.7 43 3.7 30 4.3 88 3.2
18-19 years old 465 6.9 94 8.0 53 7.7 190 7.0
20-24 years old 1,517 22.7 256 21.9 175 25.3 694 25.5
25-29 years old 1,781 26.6 381 32.6 172 24.8 728 26.7
30-34 years old 1,741 26.0 244 20.9 179 25.8 615 22.6
35-39 years old 810 12.1 111 9.5 73 10.5 342 12.5
40-44 years old 126 1.9 38 3.3 11 1.6 64 2.4
45-49 years old 11 0.2 3 0.3 0 0.0 6 0.2
>49 Years old 1 0.0 0 0.0 0 0.0 0 0.0
Study Centera,b,c
Arkansas 836 12.5 145 12.4 66 9.5 306 11.2
California 839 12.5 232 19.8 114 16.5 437 16.0
Georgia 749 11.2 138 11.8 73 10.5 302 11.1
Iowa 849 12.7 73 6.2 89 12.8 382 14.0
Massachusetts 568 8.5 68 5.8 78 11.3 189 6.9
North Carolina 596 8.9 70 6.0 49 7.1 246 9.0
New Jersey 772 11.5 162 13.9 92 13.3 343 12.6
New York 720 10.8 138 11.8 73 10.5 328 12.0
Texas 405 6.1 70 6.0 13 1.9 99 3.6
without major congenital malformations) took one or more nitrosatable drugs during the first trimester [14]. These drugs have secondary amines, tertiary amines, or amides as part of their molecular structures. In the NBDPS study population, maternal exposures to nitrosatable drugs were associated with neural tube defects [3], limb deficien-cies [15], and some types of heart defects [15]. We noted the strongest associations between maternal exposure to these drugs and neural tube defects, conotruncal heart
defects, atrioventricular septal defects, single ventricle, and cleft palate in offspring of women with the highest esti-mated total nitrite intake.
Studies investigating the relation between maternal dietary exposures to nitrates, nitrites and nitrosamines and birth defects have involved relatively small sample sizes and were restricted to NTDs [1,2]. Furthermore, these studies grouped plant and animal sources of nitrite together. However, some plant sources of nitrites, such
Table 1 Selected maternal characteristics of birth defect cases and controls in the National Birth Defects Prevention Study, 1997-2005(Continued)
Maternal Body Mass Indexa,c(kg/m2)
Underweight (BMI <18) 353 5.3 48 4.1 38 5.5 183 6.7
Normal weight (18.5 -25) 3,585 53.5 544 46.5 337 48.6 1,376 50.5
Overweight (25–30) 1,443 21.5 243 20.8 164 23.7 569 20.9
Obese (≥30) 1,037 15.5 259 22.1 121 17.5 479 17.6
Missing 280 4.2 76 6.5 33 4.8 120 4.4
Folic Acid Supplement Usec
No 3,053 45.6 552 47.2 305 44.0 1,330 48.8
Yes 3,480 52.0 577 49.3 366 52.8 1,340 49.1
Missing 165 2.5 41 3.5 22 3.2 57 2.1
a
Statistically significant difference in covariate distribution between control mothers and mothers of offspring with a NTD. b
Statistically significant difference in covariate distribution between control mothers and mothers of offspring with a limb malformation. c
Statistically significant difference in covariate distribution between control mothers and mothers of offspring with an orofacial cleft.
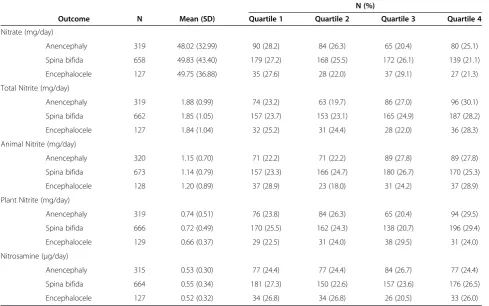
Table 2 Descriptive statistics of dietary nitrate, nitrite, and nitrosamine intake and neural tube defects in offspring
N (%)
Outcome N Mean (SD) Quartile 1 Quartile 2 Quartile 3 Quartile 4
Nitrate (mg/day)
Anencephaly 319 48.02 (32.99) 90 (28.2) 84 (26.3) 65 (20.4) 80 (25.1)
Spina bifida 658 49.83 (43.40) 179 (27.2) 168 (25.5) 172 (26.1) 139 (21.1)
Encephalocele 127 49.75 (36.88) 35 (27.6) 28 (22.0) 37 (29.1) 27 (21.3)
Total Nitrite (mg/day)
Anencephaly 319 1.88 (0.99) 74 (23.2) 63 (19.7) 86 (27.0) 96 (30.1)
Spina bifida 662 1.85 (1.05) 157 (23.7) 153 (23.1) 165 (24.9) 187 (28.2)
Encephalocele 127 1.84 (1.04) 32 (25.2) 31 (24.4) 28 (22.0) 36 (28.3)
Animal Nitrite (mg/day)
Anencephaly 320 1.15 (0.70) 71 (22.2) 71 (22.2) 89 (27.8) 89 (27.8)
Spina bifida 673 1.14 (0.79) 157 (23.3) 166 (24.7) 180 (26.7) 170 (25.3)
Encephalocele 128 1.20 (0.89) 37 (28.9) 23 (18.0) 31 (24.2) 37 (28.9)
Plant Nitrite (mg/day)
Anencephaly 319 0.74 (0.51) 76 (23.8) 84 (26.3) 65 (20.4) 94 (29.5)
Spina bifida 666 0.72 (0.49) 170 (25.5) 162 (24.3) 138 (20.7) 196 (29.4)
Encephalocele 129 0.66 (0.37) 29 (22.5) 31 (24.0) 38 (29.5) 31 (24.0)
Nitrosamine (μg/day)
Anencephaly 315 0.53 (0.30) 77 (24.4) 77 (24.4) 84 (26.7) 77 (24.4)
Spina bifida 664 0.55 (0.34) 181 (27.3) 150 (22.6) 157 (23.6) 176 (26.5)
as cereals, are fortified with vitamins including vitamin C, while animal sources of nitrites are less likely to con-tribute significantly to vitamin C intake. Vitamin C is a well-documented inhibitor of nitrosation and the forma-tion of N-nitroso compounds in the stomach [16]. This study examines the relationship between maternal ex-posure to dietary nitrates, nitrites (including plant and animal sources as separate groups), and nitrosamines and several types of birth defects including NTDs, orofacial clefts, and limb malformations in a large, population-based case–control study.
Methods
Study design and sample
We used data from the National Birth Defects Prevention Study (NBDPS) [17] to address the study objectives. Funded by the Centers for Disease Control and Preven-tion, the NBDPS is a population-based, case–control study that includes sites in Georgia, Arkansas, California, Iowa, Massachusetts, New Jersey, New York, North Carolina, Texas and Utah. Mothers who gave birth to babies with-out congenital malformations (controls, n=6807) were compared with case mothers (n=6544) whose pregnancies were affected by orofacial clefts, limb deficiencies or neural tube defects. Eligible participants had estimated
delivery dates from October 1, 1997 through December 31, 2005. Participants were excluded if their self-reported daily caloric intake was below 500 calories or greater than 5000 calories. The demographic characteristics of the mothers are described in Table 1.
Outcomes
This study focused on three major classes of birth de-fects: neural tube defects, orofacial clefts and limb malformations. Specific neural tube defects included an-encephaly, spina bifida and encephalocele. Orofacial clefts included cleft lip without cleft palate, cleft lip with cleft palate, cleft palate, and cleft lip with or without cleft palate. Limb malformations included longitudinal limb deficiency, longitudinal preaxial limb deficiency (a subcategory of longitudinal limb deficiency), transverse limb deficiency, and intercalary limb deficiency. Cases were identified through one of ten birth defect registries. Most of the registry sites include prenatal diagnosis and terminations (including Arkansas, California, Georgia, Iowa, North Carolina, Texas, and Utah) to avoid the po-tential for selection bias due to possible differences between mothers who choose to terminate their preg-nancies and those who do not. At each site, cases were checked for validity by a clinician who reviewed the Table 3 Maternal dietary intake of nitrate, nitrite, and nitrosamines and neural tube defects in offspring
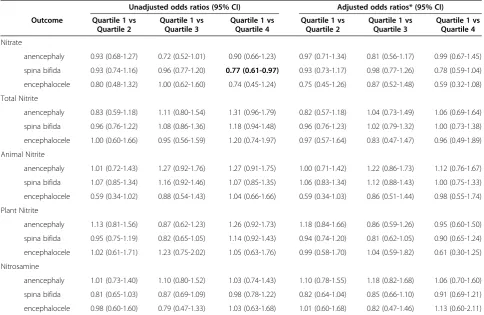
Unadjusted odds ratios (95% CI) Adjusted odds ratios* (95% CI)
Outcome Quartile 1 vs Quartile 2
Quartile 1 vs Quartile 3
Quartile 1 vs Quartile 4
Quartile 1 vs Quartile 2
Quartile 1 vs Quartile 3
Quartile 1 vs Quartile 4
Nitrate
anencephaly 0.93 (0.68-1.27) 0.72 (0.52-1.01) 0.90 (0.66-1.23) 0.97 (0.71-1.34) 0.81 (0.56-1.17) 0.99 (0.67-1.45)
spina bifida 0.93 (0.74-1.16) 0.96 (0.77-1.20) 0.77 (0.61-0.97) 0.93 (0.73-1.17) 0.98 (0.77-1.26) 0.78 (0.59-1.04)
encephalocele 0.80 (0.48-1.32) 1.00 (0.62-1.60) 0.74 (0.45-1.24) 0.75 (0.45-1.26) 0.87 (0.52-1.48) 0.59 (0.32-1.08)
Total Nitrite
anencephaly 0.83 (0.59-1.18) 1.11 (0.80-1.54) 1.31 (0.96-1.79) 0.82 (0.57-1.18) 1.04 (0.73-1.49) 1.06 (0.69-1.64)
spina bifida 0.96 (0.76-1.22) 1.08 (0.86-1.36) 1.18 (0.94-1.48) 0.96 (0.76-1.23) 1.02 (0.79-1.32) 1.00 (0.73-1.38)
encephalocele 1.00 (0.60-1.66) 0.95 (0.56-1.59) 1.20 (0.74-1.97) 0.97 (0.57-1.64) 0.83 (0.47-1.47) 0.96 (0.49-1.89)
Animal Nitrite
anencephaly 1.01 (0.72-1.43) 1.27 (0.92-1.76) 1.27 (0.91-1.75) 1.00 (0.71-1.42) 1.22 (0.86-1.73) 1.12 (0.76-1.67)
spina bifida 1.07 (0.85-1.34) 1.16 (0.92-1.46) 1.07 (0.85-1.35) 1.06 (0.83-1.34) 1.12 (0.88-1.43) 1.00 (0.75-1.33)
encephalocele 0.59 (0.34-1.02) 0.88 (0.54-1.43) 1.04 (0.66-1.66) 0.59 (0.34-1.03) 0.86 (0.51-1.44) 0.98 (0.55-1.74)
Plant Nitrite
anencephaly 1.13 (0.81-1.56) 0.87 (0.62-1.23) 1.26 (0.92-1.73) 1.18 (0.84-1.66) 0.86 (0.59-1.26) 0.95 (0.60-1.50)
spina bifida 0.95 (0.75-1.19) 0.82 (0.65-1.05) 1.14 (0.92-1.43) 0.94 (0.74-1.20) 0.81 (0.62-1.05) 0.90 (0.65-1.24)
encephalocele 1.02 (0.61-1.71) 1.23 (0.75-2.02) 1.05 (0.63-1.76) 0.99 (0.58-1.70) 1.04 (0.59-1.82) 0.61 (0.30-1.25)
Nitrosamine
anencephaly 1.01 (0.73-1.40) 1.10 (0.80-1.52) 1.03 (0.74-1.43) 1.10 (0.78-1.55) 1.18 (0.82-1.68) 1.06 (0.70-1.60)
spina bifida 0.81 (0.65-1.03) 0.87 (0.69-1.09) 0.98 (0.78-1.22) 0.82 (0.64-1.04) 0.85 (0.66-1.10) 0.91 (0.69-1.21)
encephalocele 0.98 (0.60-1.60) 0.79 (0.47-1.33) 1.03 (0.63-1.68) 1.01 (0.60-1.68) 0.82 (0.47-1.46) 1.13 (0.60-2.11)
abstracted records using a standardized protocol [18]. Cases from all sites were further classified by a clinical geneticist before study analyses began. The institutional review boards (for the protection of human subjects) at each site and the Centers for Disease Control and Preven-tion approved the NBDPS study protocol, and the institu-tional review boards of Texas A&M University and the Texas Department of State Health Services also approved this project on maternal dietary intake of nitrates, nitrites, and nitrosamines and birth defects.
Dietary intake of nitrate, nitrite, and nitrosamines
The exposures of interest included dietary nitrate (mg/day), nitrite (mg/day) and nitrosamines (μg/day). Daily consump-tion of nitrates, nitrites and nitrosamines was estimated using a 58-item food frequency questionnaire based on the Willett Food Frequency Questionnaire [19,20]. The NDBPS questionnaire included additional region-specific food
items such as avocados, raw chili peppers, salsa, tortillas, cantaloupe, and refried beans that are commonly con-sumed in this population.
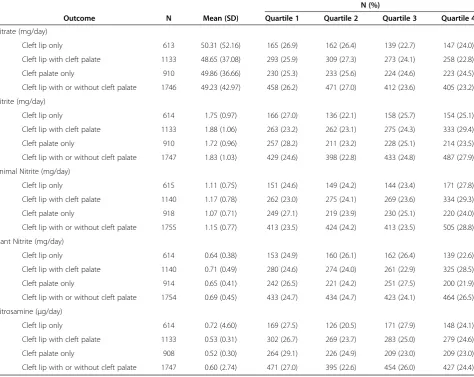
The nitrate, nitrite and nitrosamine content of each food item was estimated based on an extensive literature review reported by Griesenbeck et al. [21]. Total daily consumption of each compound was calculated by multiplying the number of servings of each food item eaten each day by the estimated content of nitrate, ni-trite, and nitrosamines in the standard serving size and summing over all food items. Due to the endogenous conversion of nitrate to nitrite in the saliva and stomach, 5% of total dietary nitrate consumption was added to es-timate total dietary nitrite consumption. Quartiles of ni-trate, nitrite from animal and plant sources separately, total nitrite, and nitrosamine intake were based on the distributions of control mothers’ daily consumption of these compounds, with the lowest quartile of each com-pound used as the referent category in all analyses. Table 4 Descriptive statistics of dietary nitrate, nitrite, and nitrosamine intake and oral cleft defects in offspring
N (%)
Outcome N Mean (SD) Quartile 1 Quartile 2 Quartile 3 Quartile 4
Nitrate (mg/day)
Cleft lip only 613 50.31 (52.16) 165 (26.9) 162 (26.4) 139 (22.7) 147 (24.0)
Cleft lip with cleft palate 1133 48.65 (37.08) 293 (25.9) 309 (27.3) 273 (24.1) 258 (22.8)
Cleft palate only 910 49.86 (36.66) 230 (25.3) 233 (25.6) 224 (24.6) 223 (24.5)
Cleft lip with or without cleft palate 1746 49.23 (42.97) 458 (26.2) 471 (27.0) 412 (23.6) 405 (23.2)
Nitrite (mg/day)
Cleft lip only 614 1.75 (0.97) 166 (27.0) 136 (22.1) 158 (25.7) 154 (25.1)
Cleft lip with cleft palate 1133 1.88 (1.06) 263 (23.2) 262 (23.1) 275 (24.3) 333 (29.4)
Cleft palate only 910 1.72 (0.96) 257 (28.2) 211 (23.2) 228 (25.1) 214 (23.5)
Cleft lip with or without cleft palate 1747 1.83 (1.03) 429 (24.6) 398 (22.8) 433 (24.8) 487 (27.9)
Animal Nitrite (mg/day)
Cleft lip only 615 1.11 (0.75) 151 (24.6) 149 (24.2) 144 (23.4) 171 (27.8)
Cleft lip with cleft palate 1140 1.17 (0.78) 262 (23.0) 275 (24.1) 269 (23.6) 334 (29.3)
Cleft palate only 918 1.07 (0.71) 249 (27.1) 219 (23.9) 230 (25.1) 220 (24.0)
Cleft lip with or without cleft palate 1755 1.15 (0.77) 413 (23.5) 424 (24.2) 413 (23.5) 505 (28.8)
Plant Nitrite (mg/day)
Cleft lip only 614 0.64 (0.38) 153 (24.9) 160 (26.1) 162 (26.4) 139 (22.6)
Cleft lip with cleft palate 1140 0.71 (0.49) 280 (24.6) 274 (24.0) 261 (22.9) 325 (28.5)
Cleft palate only 914 0.65 (0.41) 242 (26.5) 221 (24.2) 251 (27.5) 200 (21.9)
Cleft lip with or without cleft palate 1754 0.69 (0.45) 433 (24.7) 434 (24.7) 423 (24.1) 464 (26.5)
Nitrosamine (μg/day)
Cleft lip only 614 0.72 (4.60) 169 (27.5) 126 (20.5) 171 (27.9) 148 (24.1)
Cleft lip with cleft palate 1133 0.53 (0.31) 302 (26.7) 269 (23.7) 283 (25.0) 279 (24.6)
Cleft palate only 908 0.52 (0.30) 264 (29.1) 226 (24.9) 209 (23.0) 209 (23.0)
Statistical methods
Data from dietary recall questionnaires often includes some degree of measurement error. Since this study did not include a “gold standard” for comparison purposes, the effects of measurement error were evaluated using the Simulation Extrapolation (SIMEX) algorithm [22] and hypothetically varying the amount of measurement error included in the model from no error to a multi-plicative factor of 1.6 (60% additional variability) in increments of 0.10. No substantive differences were identified in terms of statistical significance or magni-tude of effect size; therefore, all subsequent statistical models were conducted using logistic regression with maximum likelihood estimation as implemented in Stata 11 [23] and SAS 9.2 [24] to estimate the odds ratios and respective 95% confidence limits for the specific defects. Each specific type of birth defect was compared with controls only, and pregnancies with other kinds of de-fects were not included as controls.
Covariates and model selection
Several demographic, dietary, and behavioral characteris-tics including race/ethnicity, state of residence, dietary folate (μg/day), maternal education (years in school), diet-ary fat (percent of calories from fat), maternal household income, pre-pregnancy body mass index (BMI) (kg/m2), use of folic acid-containing supplements, multivitamin use, and age at conception were found in a previous study to be associated with dietary intake of nitrates, nitrites and nitrosamines in the control group mothers [25]. These variables were examined for potential confounding effects using a backward selection procedure where covariates were retained if their removal changed any of the three ex-posure quartile parameters by more than 10%. In the interest of interpretability, covariates were retained within the broad classes of birth defects (i.e. NTD, orofacial de-fect and limb malformation) if evidence of potential confounding was identified in any of the constituent birth defect sub-categories.
Table 5 Maternal dietary intake of nitrate, nitrite, and nitrosamines and oral cleft defects in offspring
Unadjusted odds ratios (95% CI) Adjusted odds ratios* (95% CI)
Outcome Quartile 1 vs Quartile 2
Quartile 1 vs Quartile 3
Quartile 1 vs Quartile 4
Quartile 1 vs Quartile 2
Quartile 1 vs Quartile 3
Quartile 1 vs Quartile 4
Nitrate
Cleft lip only 1.00 (0.80-1.26) 0.85 (0.67-1.08) 0.90 (0.71-1.14) 1.01 (0.80-1.28) 0.89 (0.68-1.15) 1.01 (0.76-1.33)
Cleft lip with cleft plate 1.05 (0.88-1.25) 0.93 (0.77-1.11) 0.89 (0.74-1.07) 1.07 (0.89-1.28) 0.96 (0.79-1.16) 0.90 (0.73-1.13)
Cleft palate only 1.02 (0.83-1.24) 0.99 (0.81-1.20) 0.98 (0.81-1.20) 1.06 (0.86-1.29) 1.05 (0.85-1.30) 1.15 (0.91-1.46)
Cleft lip with or without cleft palate 1.04 (0.89-1.20) 0.90 (0.77-1.05) 0.89 (0.77-1.04) 1.04 (0.90-1.22) 0.93 (0.79-1.09) 0.93 (0.78-1.12)
Nitrite
Cleft lip only 0.82 (0.64-1.04) 0.94 (0.75-1.19) 0.92 (0.73-1.17) 0.85 (0.67-1.08) 1.03 (0.80-1.33) 1.11 (0.81-1.51)
Cleft lip with cleft plate 0.99 (0.82-1.19) 1.04 (0.86-1.25) 1.25 (1.04-1.49) 1.02 (0.85-1.24) 1.02 (0.84-1.25) 1.12 (0.88-1.42)
Cleft palate only 0.82 (0.67-0.99) 0.87 (0.72-1.06) 0.83 (0.69-1.01) 0.85 (0.70-1.04) 0.97 (0.79-1.20) 1.02 (0.78-1.32)
Cleft lip with or without cleft palate 0.92 (0.79-1.08) 1.00 (0.86-1.16) 1.12 (0.97-1.30) 0.95 (0.81-1.11) 1.02 (0.86-1.20) 1.10 (0.91-1.35)
Animal Nitrite
Cleft lip only 0.98 (0.77-1.24) 0.92 (0.72-1.17) 1.12 (0.89-1.42) 1.00 (0.78-1.27) 1.00 (0.78-1.29) 1.32 (1.01-1.72)
Cleft lip with cleft plate 1.03 (0.86-1.24) 1.01 (0.84-1.21) 1.24 (1.04-1.48) 1.06 (0.88-1.28) 1.03 (0.85-1.24) 1.22 (0.99-1.49)
Cleft palate only 0.86 (0.71-1.05) 0.90 (0.74-1.10) 0.87 (0.72-1.06) 0.89 (0.73-1.08) 0.97 (0.79-1.19) 1.01 (0.80-1.27)
Cleft lip with or without cleft palate 1.01 (0.87-1.18) 0.97 (0.84-1.14) 1.20 (1.04-1.39) 1.03 (0.88-1.21) 1.01 (0.86-1.19) 1.24 (1.05-1.48)
Plant Nitrite
Cleft lip only 1.02 (0.81-1.29) 1.05 (0.83-1.32) 0.91 (0.71-1.15) 1.09 (0.85-1.39) 1.15 (0.89-1.50) 1.04 (0.74-1.46)
Cleft lip with cleft plate 0.98 (0.82-1.17) 0.92 (0.77-1.11) 1.16 (0.98-1.39) 1.03 (0.85-1.24) 0.95 (0.77-1.16) 0.98 (0.76-1.27)
Cleft palate only 0.92 (0.75-1.12) 1.03 (0.85-1.24) 0.84 (0.69-1.03) 0.97 (0.79-1.19) 1.15 (0.93-1.43) 1.01 (0.76-1.33)
Cleft lip with or without cleft palate 1.00 (0.86-1.16) 0.97 (0.83-1.12) 1.07 (0.92-1.24) 1.05 (0.89-1.23) 1.02 (0.86-1.20) 1.00 (0.81-1.24)
Nitrosamine
Cleft lip only 0.74 (0.58-0.94) 0.72 (0.56-0.92) 1.02 (0.81-1.27) 0.87 (0.69-1.09) 0.99 (0.78-1.26) 0.85 (0.64-1.13)
Cleft lip with cleft plate 0.89 (0.74-1.06) 0.89 (0.74-1.06) 0.93 (0.78-1.11) 0.90 (0.75-1.08) 0.95 (0.78-1.15) 0.89 (0.71-1.10)
Cleft palate only 0.85 (0.70-1.03) 0.86 (0.71-1.05) 0.77 (0.64-0.94) 0.78 (0.64-0.95) 0.85 (0.69-1.05) 0.88 (0.69-1.11)
Cleft lip with or without cleft palate 0.83 (0.72-0.97) 0.83 (0.71-0.96) 0.96 (0.83-1.11) 0.89 (0.76-1.03) 0.96 (0.82-1.13) 0.87 (0.73-1.04)
Results
Table 1 displays the demographic characteristics of the control group as well as each of the broad classes of birth defects. A majority of the participants were of non-Hispanic white race/ethnicity with the second most common group being of Hispanic origin. The mothers were relatively well educated with the majority having a high school and/or college degree. Roughly half of all mothers delivered their children between the ages of 20 and 29 and nearly three quarters delivered between the ages of 20 and 34. Approximately half of all case and control mothers had a body mass index (BMI) in the normal range while nearly one third had a BMI in the overweight and obese range. Roughly half of all case and control mothers reported using folic acid supplements during the first month of pregnancy.
Statistical significance in Table 1 is based on the pair-wise comparison of each birth defect class case mothers with the control mothers. The distributions of race/ethni-city, maternal education, age at delivery, study center, and
maternal BMI for mothers of offspring with NTDs were significantly different than the distributions of the control mothers. The distributions of race/ethnicity and study center for mothers of offspring with limb malformations were significantly different than the distributions of the control mothers. The distributions of race/ethnicity, ma-ternal education, age at delivery, study center, mama-ternal BMI and folic acid use for mothers of offspring with oral clefts were significantly different than the distributions of the control mothers.
The descriptive statistics for daily consumption of nitrates, total nitrites, animal nitrites, plant nitrites and nitrosamines are shown in Table 2 for mothers of children with NTDs. The results of the unadjusted and adjusted logistic regression models for NTDs are shown in Table 3. Compared to the first quartile of nitrate consumption, a significant relationship was identified for the fourth quar-tile for spina bifida (uOR = 0.77, 95% confidence interval = 0.61-0.97), but this association was not statistically signifi-cant after adjustment for covariates.
Table 6 Descriptive statistics of dietary nitrate, nitrite, and nitrosamine intake and limb deficiency defects in offspring
N (%)
Limb deficiency defect N Mean (SD) Quartile 1 Quartile 2 Quartile 3 Quartile 4
Nitrate (mg/day)
Longitudinal 245 47.12 (31.52) 73 (29.8) 55 (22.4) 60 (24.5) 57 (23.3)
Transverse 379 46.97 (33.93) 101 (26.6) 105 (27.7) 95 (25.1) 78 (20.6)
Intercalary 34 45.84 (24.04) 10 (29.4) 7 (20.6) 7 (20.6) 10 (29.4)
Preaxial* 143 45.19 (30.13) 46 (32.2) 32 (22.4) 34 (23.8) 31 (21.7)
Nitrite (mg/day)
Longitudinal 245 1.76 (0.96) 73 (29.8) 50 (20.4) 54 (22.0) 68 (27.8)
Transverse 379 1.80 (1.00) 95 (25.1) 102 (26.9) 86 (22.7) 96 (25.3)
Intercalary 34 1.86 (0.88) 5 (14.7) 9 (26.5) 7 (20.6) 13 (38.2)
Preaxial* 143 1.78 (1.02) 42 (29.4) 33 (23.1) 31 (21.7) 37 (25.9)
Animal Nitrite (mg/day)
Longitudinal 247 1.12 (0.79) 66 (26.7) 59 (23.9) 64 (25.9) 58 (23.5)
Transverse 381 1.12 (0.77) 99 (26.0) 94 (24.7) 90 (23.6) 98 (25.7)
Intercalary 34 1.26 (0.82) 5 (14.7) 7 (20.6) 9 (26.5) 13 (38.2)
Preaxial* 145 1.15 (0.87) 38 (26.2) 37 (25.5) 36 (24.8) 34 (23.4)
Plant Nitrite (mg/day)
Longitudinal 247 0.64 (0.36) 64 (25.9) 63 (25.5) 56 (22.7) 64 (25.9)
Transverse 381 0.68 (0.42) 101 (26.5) 89 (23.4) 83 (21.8) 108 (28.3)
Intercalary 34 0.60 (0.29) 8 (23.5) 9 (26.5) 10 (29.4) 7 (20.6)
Preaxial* 145 0.63 (0.34) 37 (25.5) 39 (26.9) 33 (22.8) 36 (24.8)
Nitrosamine (μg/day)
Longitudinal 245 0.56 (0.46) 65 (26.5) 62 (25.3) 55 (22.4) 63 (25.7)
Transverse 380 0.82 (5.82) 100 (26.3) 99 (26.1) 91 (23.9) 90 (23.7)
Intercalary 34 0.63 (0.30) 4 (11.8) 9 (26.5) 11 (32.4) 10 (29.4)
Preaxial* 143 0.52 (0.31) 41 (28.7) 34 (23.8) 33 (23.1) 35 (24.5)
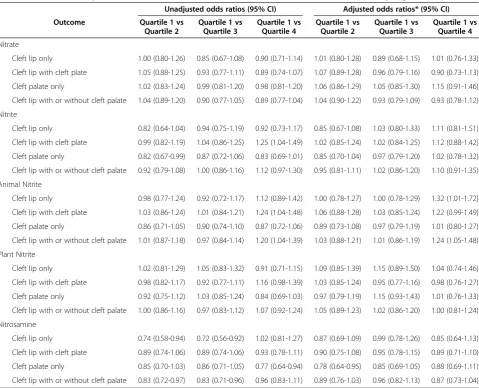
The descriptive statistics for diet of mothers of chil-dren with orofacial defects are reported in Table 4 and the results of the logistic regression models are reported in Table 5. In the unadjusted logistic regression models, statistically significant relationships were identified be-tween the second quartile of nitrite intake and cleft pal-ate (uOR = 0.82, 0.67-0.99), between the second quartile of nitrosamine intake and cleft lip without cleft palate (uOR = 0.74, 0.58-0.94), between the third quartile of ni-trosamine intake and cleft lip without cleft palate (uOR = 0.72, 0.56-0.92), between the second quartile of nitro-samine intake and cleft lip with or without cleft palate (uOR = 0.83, 0.72-0.97), between the third quartile of ni-trosamine intake and cleft lip with or without cleft palate (uOR = 0.82, 0.71-0.96) and between the fourth quartile of nitrosamine intake and cleft palate (uOR = 0.77,
0.64-0.94). However, none of these relationships was statisti-cally significant after adjustment for covariates. For the adjusted logistic regression models, a significant relation-ship was identified between the second quartile of nitrosa-mine intake and cleft palate (aOR = 0.78, 0.64-0.95).
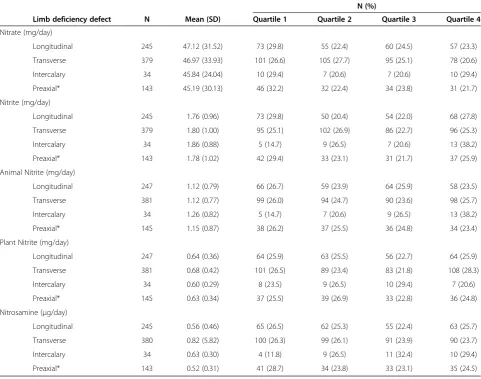
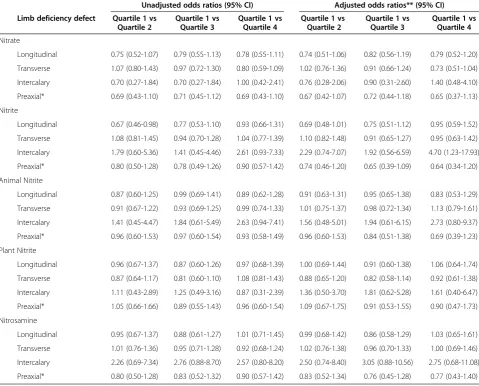
The descriptive statistics for diet for mothers of chil-dren with limb malformations are reported in Table 6 and the results of the logistic regression models are reported in Table 7. In the unadjusted logistic regression models with the lowest quartile of intake serving as the referent category, a significant relationship was noted for the second quartile of total nitrite consumption and longitudinal limb deficiency (uOR = 0.67, 0.46-0.98), but this result was not significant after adjustment for cova-riates. In the adjusted logistic regression models, there was a significant relationship between the fourth quartile Table 7 Maternal dietary intake of nitrate, nitrite, and nitrosamines and limb deficiency defects in offspring
Unadjusted odds ratios (95% CI) Adjusted odds ratios** (95% CI)
Limb deficiency defect Quartile 1 vs Quartile 2
Quartile 1 vs Quartile 3
Quartile 1 vs Quartile 4
Quartile 1 vs Quartile 2
Quartile 1 vs Quartile 3
Quartile 1 vs Quartile 4
Nitrate
Longitudinal 0.75 (0.52-1.07) 0.79 (0.55-1.13) 0.78 (0.55-1.11) 0.74 (0.51-1.06) 0.82 (0.56-1.19) 0.79 (0.52-1.20)
Transverse 1.07 (0.80-1.43) 0.97 (0.72-1.30) 0.80 (0.59-1.09) 1.02 (0.76-1.36) 0.91 (0.66-1.24) 0.73 (0.51-1.04)
Intercalary 0.70 (0.27-1.84) 0.70 (0.27-1.84) 1.00 (0.42-2.41) 0.76 (0.28-2.06) 0.90 (0.31-2.60) 1.40 (0.48-4.10)
Preaxial* 0.69 (0.43-1.10) 0.71 (0.45-1.12) 0.69 (0.43-1.10) 0.67 (0.42-1.07) 0.72 (0.44-1.18) 0.65 (0.37-1.13)
Nitrite
Longitudinal 0.67 (0.46-0.98) 0.77 (0.53-1.10) 0.93 (0.66-1.31) 0.69 (0.48-1.01) 0.75 (0.51-1.12) 0.95 (0.59-1.52)
Transverse 1.08 (0.81-1.45) 0.94 (0.70-1.28) 1.04 (0.77-1.39) 1.10 (0.82-1.48) 0.91 (0.65-1.27) 0.95 (0.63-1.42)
Intercalary 1.79 (0.60-5.36) 1.41 (0.45-4.46) 2.61 (0.93-7.33) 2.29 (0.74-7.07) 1.92 (0.56-6.59) 4.70 (1.23-17.93)
Preaxial* 0.80 (0.50-1.28) 0.78 (0.49-1.26) 0.90 (0.57-1.42) 0.74 (0.46-1.20) 0.65 (0.39-1.09) 0.64 (0.34-1.20)
Animal Nitrite
Longitudinal 0.87 (0.60-1.25) 0.99 (0.69-1.41) 0.89 (0.62-1.28) 0.91 (0.63-1.31) 0.95 (0.65-1.38) 0.83 (0.53-1.29)
Transverse 0.91 (0.67-1.22) 0.93 (0.69-1.25) 0.99 (0.74-1.33) 1.01 (0.75-1.37) 0.98 (0.72-1.34) 1.13 (0.79-1.61)
Intercalary 1.41 (0.45-4.47) 1.84 (0.61-5.49) 2.63 (0.94-7.41) 1.56 (0.48-5.01) 1.94 (0.61-6.15) 2.73 (0.80-9.37)
Preaxial* 0.96 (0.60-1.53) 0.97 (0.60-1.54) 0.93 (0.58-1.49) 0.96 (0.60-1.53) 0.84 (0.51-1.38) 0.69 (0.39-1.23)
Plant Nitrite
Longitudinal 0.96 (0.67-1.37) 0.87 (0.60-1.26) 0.97 (0.68-1.39) 1.00 (0.69-1.44) 0.91 (0.60-1.38) 1.06 (0.64-1.74)
Transverse 0.87 (0.64-1.17) 0.81 (0.60-1.10) 1.08 (0.81-1.43) 0.88 (0.65-1.20) 0.82 (0.58-1.14) 0.92 (0.61-1.38)
Intercalary 1.11 (0.43-2.89) 1.25 (0.49-3.16) 0.87 (0.31-2.39) 1.36 (0.50-3.70) 1.81 (0.62-5.28) 1.61 (0.40-6.47)
Preaxial* 1.05 (0.66-1.66) 0.89 (0.55-1.43) 0.96 (0.60-1.54) 1.09 (0.67-1.75) 0.91 (0.53-1.55) 0.90 (0.47-1.73)
Nitrosamine
Longitudinal 0.95 (0.67-1.37) 0.88 (0.61-1.27) 1.01 (0.71-1.45) 0.99 (0.68-1.42) 0.86 (0.58-1.29) 1.03 (0.65-1.61)
Transverse 1.01 (0.76-1.36) 0.95 (0.71-1.28) 0.92 (0.68-1.24) 1.02 (0.76-1.38) 0.96 (0.70-1.33) 1.00 (0.69-1.46)
Intercalary 2.26 (0.69-7.34) 2.76 (0.88-8.70) 2.57 (0.80-8.20) 2.50 (0.74-8.40) 3.05 (0.88-10.56) 2.75 (0.68-11.08)
Preaxial* 0.80 (0.50-1.28) 0.83 (0.52-1.32) 0.90 (0.57-1.42) 0.83 (0.52-1.34) 0.76 (0.45-1.28) 0.77 (0.43-1.40)
* Subcategory of longitudinal limb deficiency.
of total nitrite consumption and intercalary limb defi-ciency (aOR = 4.70, 1.23-17.93).
Discussion
This study explored the relationship between maternal consumption of dietary nitrates, total nitrites, nitrites (from both animal and plant sources) and nitrosamines and specific NTDs, orofacial clefts and limb malformations in their offspring. The primary strength of the study is its large and very well-characterized sample. It is the largest study to date to investigate the relation between estimated maternal intake of dietary nitrate, nitrite, and nitrosamines and neural tube defects and examines several other types of birth defects in relation to these exposures that have not been examined before. Overall, estimated dietary intake of these compounds did not appear to be significant risk fac-tors for neural tube, oral cleft, or limb deficiency defects.
Croen et al. [1] also found no compelling associations between maternal dietary intake of nitrates, nitrites, and nitrosamines and neural tube defects in a California study population, with most odds ratios for neural tube defects slightly below 1.00 in the second, third, and fourth quartiles compared with the first quartile of in-take. Using tertiles instead of quartiles of intake, Brender et al. [2] noted odds ratios of 0.8 and 0.9 for the upper two tertiles of dietary nitrite and for total nitrite, 0.9 and 0.8. Neither study reported findings of the relation be-tween dietary intake of these compounds and neural tube defects by specific phenotype.
Of interest to this study, three studies found dietary ni-trite and total nini-trite to modify the association between nitrosatable drug use and birth defects in offspring. In a study of Mexican American women who resided in Texas counties bordering Mexico, nitrosatable drug use was as-sociated with these defects in the upper two tertiles of nitrite and total nitrite intake, but not in the lowest tertile of intake [2]. These findings were corroborated in the National Birth Defects Prevention Study population [3] in which the strongest associations between secondary/ter-tiary amine drug exposure and anencephaly and spina bifida were noted in the upper two tertiles of dietary nitrite and total nitrite intake. Associations for cleft palate and several types of heart defects were also stronger in offspring of NBDPS participants who had the highest estimated total nitrite intake [15]. These findings are con-sistent with results of an experimental study with mice ex-posed to ethylenethiourea (a nitrosatable compound) and nitrite [26]. Malformations were observed when these compounds were administered together, but not separ-ately. With the dose of the nitrosatable compound held constant, the percentage of malformations increased as the dose of nitrite increased, indicating that the combined effects of these compounds might be due to the nitrosation products formed within the stomach.
One possible limitation of our study is the potential for measurement error in the self-reported food fre-quency questionnaire. Because data from food frefre-quency questionnaires are known to be measured with error [19,20], logistic regression models were estimated using
the SIMEX algorithm. Since there was no “gold
stand-ard” available to quantify the amount of measurement
error in the data, extra error was considered by adding 0% to 60% additional variance in increments of 10%. There was no evidence that even the highest levels of measurement error made any substantive different in the results so maximum likelihood estimation was used for all subsequent modeling. It is possible that the inabil-ity to explicitly quantify the degree of measurement error in the exposure variables could bias the results to-wards the null. However, any bias due to measurement error should be non-differential because the mothers were not aware of the nitrate, nitrite and nitrosamine content in the foods they consumed when they com-pleted the dietary recall questionnaire.
In this study, we focused on dietary contributions to daily intake of nitrate, nitrite, and nitrosamines, although drinking water is another potential source of nitrate in-take. On the other hand, the World Health Organization noted, in a recent review, that the contribution of drink-ing water to nitrate intake is usually less than 14% [27].
Conclusion
Over 165 unadjusted and 165 adjusted logistic regression models were fit in the course of this analysis, and only four adjusted odds ratios had confidence intervals that did not include the null value. Though no explicit adjustment for multiple comparisons was made, it is likely that the four significant results would not remain so if adjusted. Given the small number of significant results relative to the number of models considered and the modest effects for the non-significant results, it seems reasonable to con-clude that there is insufficient evidence to suggest any re-lationship between dietary intake of nitrates, nitrosamines, total nitrites or nitrates from animal or plant sources and any of the three groups of birth defects including NTDs, orofacial clefts and limb malformations. Because nitrite can react with nitrosatable compounds within the stom-ach to form N-nitroso compounds, further studies are recommended on the relation between the interaction of dietary nitrites with nitrosatable drugs and adverse preg-nancy outcomes.
Abbreviations
uOR:Unadjusted odds ratio; aOR: Adjusted odds ratio; B1P1: One month prior through one month post-conception; CI: Confidence interval; EDD: Estimated delivery date; NBDPS: National Birth Defects Prevention Study; NTD: Neural tube defect; OR: Odds ratio.
Competing interests
Authors’contributions
JCH analyzed the data and prepared the manuscript, JDB conceived of the study and serves as principal investigator of the project, assisted in the data analysis and preparation of the manuscript, QZ analyzed the data and assisted in preparing the manuscript. JRS provided guidance on the nutritional aspects of the project and assisted with the manuscript, AV and MS assisted with data analysis and manuscript development. JSG developed the estimates of nitrates, nitrites, and nitrosamines from the food frequency and provided the initial analyses on maternal characteristics related to estimated higher dietary consumption of these compounds. LS, PHL, MAC, PAR, and PJW provided input into the study design and final paper. All authors approved the final draft.
Authors’information
Supported by the National Institutes of Health, National institute for Environmental Health Sciences (5RO1ES015634 and 3R01ES015634-03S1).
Acknowledgements
This work was supported by the National Institute of Environmental Health Sciences at the National Institutes of Health (5R01ES015634 and 3R01ES015634-03S1), and the Centers for Disease Control and Prevention/ Texas Center for Birth Defects Research and Prevention (Cooperative Agreement U50/CCU613232). The content is solely the responsibility of the authors and does not necessarily represent the official views of the National Institute of Environmental Health Sciences or the National Institutes of Health. The authors thank Ms. Michelle Steck, Texas A&M Health Science Center School of Rural Public Health, for her assistance in developing estimates of dietary nitrates, nitrites, and nitrosamines from the food frequency questionnaire.
Author details
1
Department of Epidemiology and Biostatistics, The Texas A&M Health Science Center School of Rural Public Health, MS 1266 TAMU, College Station, TX 77843-1266, USA.2Department of Health Promotion & Community Health Sciences, The Texas A&M Health Science Center School of Rural Public Health, MS 1266 TAMU, College Station, TX 77843-1266, USA. 3111 Marine Expeditionary Force, Okinawa, Japan.4Texas Department of
State Health Services, PO Box 149347, Austin, Texas 78714-9347, USA. 5Department of Epidemiology, The University of Iowa College of Public
Health, C21-E GH, 200 Hawkins Drive, Iowa City, Iowa 52242, USA.6The University of Iowa Center for Health Effects of Environmental Contamination, N202 Oakdale Hall, Iowa City, Iowa 52242, USA.
Received: 30 May 2012 Accepted: 14 March 2013 Published: 21 March 2013
References
1. Croen LA, Todoroff K, Shaw GM:Maternal exposure to nitrate from drinking water and diet and risk for neural tube defects.Am J Epidemiol
2001,153(4):325–331.
2. Brender JD, Olive JM, Felkner M, Suarez L, Marckwardt W, Hendricks KA:
Dietary nitrites and nitrates, nitrosatable drugs, and neural tube defects. Epidemiology2004,15(3):330–336.
3. Brender JD, Werler MM, Kelley KE, Vuong AM, Shinde MU, Zheng Q,et al:
Nitrosatable drug exposure during early pregnancy and neural tube defects in offspring.Am J Epidemiol2011,174(11):1286–1295. 4. Choi BC:N-nitroso compounds and human cancer: a molecular
epidemiologic approach.Am J Epidemiol1985,121(5):737–743. 5. Preussmann R:Occurrence and exposure to N-nitroso compounds and
precursors.IARC Sci Publ1984,57:3–15.
6. Ivankovic S:Teratogenic and carcinogenic effects of some chemicals during prenatal life in rats, Syrian golden hamsters, and minipigs. Natl Canc Inst Monogr1979,51:103–115.
7. Inouye M, Murakami U:Teratogenic effect of N-methyl-N-nitro-N-nitrosoguanidine in mice.Teratology1978,18(2):263–267. 8. Koyama T, Handa H, Matsumoto S:Methylnitrosourea-induced
malformations of the brain in SD-JCL rat.Arch Neurol1970,22:342–347. 9. Platzek T, Bochert G, Rahm U:Embryotoxicity induced by alkylating
agents. Teratogenicity of acetoxymethyl-methyl nitrosamine: dose– response relationship, application route dependency and phase specificity.Arch Toxicol1983,52(1):45–69.
10. Nagao T, Morita Y, Ishizuka Y,et al:Induction of fetal malformations after treatment of mouse embryos with methylnitrosourea at the
preimplantation stages.Teratog Carcinog Mutagen1991,11(1):1–10. 11. Diwan BA:Strain-dependent teratogenic effects of 1-ethyl-1-nitrosourea
in inbred strains of mice.Cancer Res1974,34(1):151–157. 12. Alaoui-Jamali MA, Rossignol G, Schuller HM, Castonguay A:Transplacental
genotoxicity of a tobacco-specific N-nitrosoamine, 4-(methylnitrosamino)-1-(3-pyridyl)-1-butanone, in Syrian golden hamster.Mutat Res1989,223:65–72. 13. Jorquera R, Castonguay A, Schuller HM:Placental transfer of
4-(methylnitrosamino)-1-(3-pyridyl)-1-butanone instilled intratracheally in Syrian golden hamsters.Cancer Res1992,52:3273–80.
14. Brender JD, Kelley KE, Werler MM, Langlois PH, Suarez L, Canfield MA,et al:
Prevalence and patterns of nitrosatable drug use among U.S. women during early pregnancy.Birth Defects Res A Clin Mol Teratol2011,91(4):258–64. 15. Brender JD, Werler MM, Shinde MU, Vuong AM, Kelley KI, Huber JC Jr,et al:
Nitrosatable drug exposure during the first trimester of pregnancy and selected congenital malformations.Birth Defects Res A Clin Mol Teratol
2012,94(9):701–713.
16. Mirvish SS:Experimental evidence for inhibition ofN-nitroso compound formation as a factor in the negative correlation between vitamin C consumption and the incidence of certain cancers.Cancer Res1994,
54(7 Suppl):1948s–1951s.
17. Yoon PW, Rasmussen SA, Lynberg MC, Moore CA, Anderka M, Carmichael SL, Costa P, Druschel C, Hobbs CA, Romitti PA,et al:The National Birth Defects Prevention Study.Public Health Rep2001,166(Suppl 1):32–40. 18. Rasmussen SA, Olney RS, Holmes LB, Lin AE, Keppler-Noreuil KM, Moore CA,
National Birth Defects Prevention Study:Guidelines for case classification for the National Birth Defects Prevention Study.Birth Defects Res A Clin Mol Teratol2003,67(3):193–201.
19. Willett WC, Reynolds RD, Cottrell-Hoehner S, Sampson L, Brown ML:
Validation of a semi-quantitative food frequency questionnaire: comparison with a 1-year diet record.J Am Diet Assoc1987,87:43–47. 20. Willett WC, Sampson L, Stampfer MJ, Rosner B, Bain C, Witschi J, Hennekens
CH, Speizer FE:Reproducibility and validity of a semiquantitative food frequency questionnaire.Am J Epidemiol1985,122:51–65.
21. Griesenbeck JS, Steck MD, Huber JC Jr,et al:Development of estimates of dietary nitrates, nitrites, and nitrosamines for use with the Short Willett Food Frequency Questionnaire.Nutr J2009,8:16.
22. Carroll RJ, Rupert D, Stefanski LA, Crainiceanu CM:Measurement error in nonlinear models: A modern perspective.2nd edition. New York: Chapman-Hall/CRC; 2006. 23. StataCorp:Stata Statistical Software: Release 11.College Station, TX:
StataCorp LP; 2009.
24. SAS Institute Inc:SAS/STAT 9.2.Cary, NC: SAS Institute, Inc; 2008.
25. Griesenbeck JS, Brender JD, Sharkey JR,et al:Maternal characteristics associated with the dietary intake of nitrates, nitrites, and nitrosamines in women of child-bearing age: a cross-sectional study.Environ Health2010,9:10. 26. Teramoto S, Saito R, Shirasu Y:Teratogenic effects of combined
administration of ethylenethiourea and nitrite in mice.Teratology1980,
21(1):71–78.
27. World Health Organization:Nitrate and Nitrite in Drinking-water (WHO/SDE/ WSH/07.01/16/Rev/1.Geneva: World Health Organization; 2011.
doi:10.1186/1475-2891-12-34