~ 143 ~ WWJMRD 2017; 3(7): 143-148
www.wwjmrd.com Impact Factor MJIF: 4.25 e-ISSN: 2454-6615
Harjeet Kaur
M.Tech Research Scholar GKU Talwandi Sabo,Pinjab, India
Rachna Rjput
Assistant ProfessorGKU Talwandi Sabo, Punjab, India
Correspondence: Harjeet Kaur
M.Tech Research Scholar GKU Talwandi Sabo,Pinjab, India
Big Data Analysis on WSN for Risk Analysis on
Different Data
Harjeet Kaur,
Rachna Rjput
Abstract
Big data represent a new era in data exploration and utilization and covers various industrial applications, for example, professionalizing business intelligence operation in the automobile industry, solving routing and scheduling problems in transportation systems , improving the performance of supply chains by minimizing the negative effect of demand uncertainties , providing security for buildings and physical infrastructure in home surveillance and security systems [1], and analyzing supply chains with radio-frequency identification technology from both the risk and benefit perspectives . There is various numbers of protocols and algorithms were proposed to decrease the consumption of energy. Here, a real-time big data gathering algorithm (RTBDG) is used for gathering the data in real-time. In RTBDG algorithm, sensor nodes can screen collected data from the sensors . Here in this work we are performing big data with different database files and getting 80% results on WSN.
Keywords: RTBDG, big data, data, protocols etc.
Introduction
Big data refers to the dynamic, large and disparate volumes of data being created by people, tools and machines; it requires new, innovative and scalable technology to collect, host and analytically process the vast amount of data gathered in order to derive real-time business insights that relate to consumers, risk, profit, performance, productivity management and enhanced shareholder value[1-2].
Big data includes information garnered from social media, data from internet-enabled devices (including smartphones and tablets), machine data, video and voice recordings, and the continued preservation and logging of structured and unstructured data. It is typically characterized by the four ―V’s‖:
Volume: the amount of data being created is vast compared to traditional data sources
Variety: data comes from different sources and is being created by machines as well as people
Velocity: data is being generated extremely fast — a process that never stops, even while we sleep[2]
Veracity: big data is sourced from many different places, as a result you need to test the veracity/quality of the data Evolving technology has brought data analysis out of IT backrooms, and extended the potential of using data-driven results into every facet of an organization.
However, while advances in software and hardware have enabled the age of big data, technology is not the only consideration. Companies need to take a holistic view that recognizes that success is built upon the integration of people, process, technology and data; this means being able
to incorporate data into their business routines, their strategy and their daily operations [4]. Organizations must understand what insights they need in order to make good strategic and operational decisions. The first part of the challenge is sorting through all of the available data to identify trends and correlations that will drive beneficial changes in business behavior. The next step is enriching this organizational information with that from sources outside the enterprise; this will include familiar big data sources, such as those created and stored online. In a business environment that constantly and rapidly changes, future
prediction becomes more important than the simple visualization of historical or current perspectives[6]. For effective future prediction, data analysis using statistical and predictive modeling techniques may be applied to enhance and support the organization’s business strategy. The collection and aggregation of big data, and other information from outside the enterprise, enables the business to develop their own analytic capacity and capability, which for many years has only been available to a few larger organizations.
Big Data and Analytics
Big data poses both opportunities and challenges for businesses. In order to extract value from big data, it must be processed and analyzed in a timely manner, and the results need to be available in such a way as to be able to effect positive change or influence business decisions. The effectiveness also relies on an organization having the right combination of people, process and technology. By pure definition, analytics is the discovery and communication of meaningful patterns in data — but for business, analytics should be viewed as the extensive use of data, statistical and quantitative analysis, using explanatory and predictive models to drive fact-based business management decisions and actions. Analytics helps to optimize key processes, functions and roles[7]. It can be leveraged to aggregate both internal and external data. It enables organizations to meet stakeholder reporting demands, manage massive data volumes, create market advantages, manage risk, improve controls and, ultimately,
enhance organizational performance by turning
information into intelligence. Analytics can identify innovative opportunities in key processes, functions and roles. It creates a catalyst for innovation and change — and by challenging the status quo, it can help to create new possibilities for the business and its customers. Sophisticated techniques can allow companies to discover root causes, analyze micro segments of their markets, transform processes and make accurate predictions about future events or customers’ propensity to buy, churn or engage[1][3][7].
Fig. 1: Big data and analytics [3]
It is no longer enough for companies to simply understand current process or operations with a view on improving what already exists, when there is now the capacity to question if a process is relevant to the business, or whether there is a new way of solving a particular issue. The key driver for innovation within organizations is to constantly challenge existing practices rather than consistently accept
the same. Most organizations have complex and fragmented architecture landscapes that make the cohesive collation and dissemination of data difficult. New analytic solutions are playing an important role in enabling an effective Intelligent Enterprise (IE). An IE helps to create a single view across your organization by utilizing a combination of standard reporting and data visualization
[6]:
• Data from multiple source systems is cleansed, normalized and collated
• External feeds can be gathered from the latest research, best practice guidelines, benchmarks and other online repositories
• Use of enhanced visualization techniques,
benchmarking indexes and dashboards can inform management and consumers via smartphones, laptops, tablets, etc., in-house or remotely All companies need to start thinking about collecting and using relevant big data.
Data-driven decisions can reduce inefficiency between the business, legal and IT, optimize existing information assets and address disconnects between different functions of an organization. However, it is worth noting that the best data and the most advanced analytical tools and techniques mean nothing if they are not being leveraged by people who are asking the right questions. Big data, emerging storage technology platforms and the latest analytical algorithms are enablers to business success — not a guarantee of it [8].
Data Management on WSNs
The purpose of data management in sensor networks is to separate the logical view (name, access, operation) from the physical view of the data. Users and applications need not be concerned about the details of sensor networks, but about the logical structures of queries. From a data management point of view, the data management system of a sensor network can be seen as a distributed database system, but it is different from traditional ones. The data management system of a sensor network organizes and manages perceptible information from the inspected area and answers queries from users or applications. This chapter discusses the methods and techniques of data management in sensor networks, including the difference between data management systems in sensor networks and in traditional distributed database systems, the architecture of a data management system in a sensor network, the data model and the query language, the storing and indexing techniques of sensor data, the operating algorithms, the query processing techniques, and two examples of data management systems in sensor networks: TinyDB and Cougar.
Big Data Tools
like DBMS are incompetent to satisfy business needs. The term ―big data‖ was then introduced and corresponding ecosystems of big data are developed, contending as well as collaborating with each other to become the new standard.[17] Most big data systems can be viewed as workflows: an application is represented by a directed graph that chains one job after another. Each job consumes an input data set and output data set. Most of the time, bothinput and output data sets are immutable. For example,in the Hadoop distributed system, jobs are chained by directory names and data are stored to disk. Despite the fact that expensive I/O operations are expected in such design, the workflow notion is very popular because it has many advantages. (1) Many clients can consume one dataset without affecting each other. (2) Jobs are loosely coupled so that they can be developed in
different language and are set to different
schedules/priorities. (3) Failure recovery is
straightforward—each transition output acts as checking points. (4) Finally, the flow of data processing are easily traceable. some popular technologies that were developed for the age of big data. We shall start with the data storage, followed by batch data processing, streaming data processing, and end with a discussion on popular architecture design. [18]
Methodology
Sensor nodes are randomly distributed in the sensing field. In this network, the nodes are static and fixed. The sensor nodes sense the information and then send to the server. If the source node sends the packet, it will send through the intermediate node. The nodes are communicates only within the communication range. So, we have to find the node’s communication range. The configuration parameter used for configure the nodes are tabulated as follows:
The data from the sensor nodes are gathered by using Real-Time Big Data Gathering algorithm based on the received signal strength indicator (RSSI) and residual energy information.
Data Gathering Using RTBDG Algorithm
The data from the sensor nodes are gathered by using Real-Time Big Data Gathering algorithm based on the received signal strength indicator (RSSI) and residual energy information.
The sensor nodes are deployed in a field and sensor networks should have following properties:
a. After deployment of sensor nodes on a field, the nodes must be immobile.
b. Sensor nodes are homogeneous.
c. All nodes can receive the signal which was sent from the base station (BS) and use the HEED for maintaining the energy.
d. Sensor nodes send data with fixed transmission power from base station to the node with energy algorithm HEED.
e. The propagation channel is symmetrical.
In RTBDG algorithm sensor nodes should screen the gathered data according to requirement of Risk Analysis. The screening process is explained below:
a. Initially the data collected from the sensor nodes with the normal reference range is established.
b. The data should be collected within some regular interval time.
c. The data collected by sensor nodes are compared with the normal reference value. If these data are below the normal reference value then it is stored at a regular time interval. In other case, if any abnormalities both the abnormal data and the stored data will be transmitted to Base Station (BS).
d. If the stored data reaches the upper limit value of capacity then all the data are transmitted to the base station by means of established routes.
Thus the screening process is done by using above steps.
START
Deploy the number of nodes with different Zones.
Mark the BS and Gateway and Cluster head in different Zones
All nodes will receive the signal that was sent from one zone to another through Base station (BS)
Apply HEED for maintaining the energy and RTBDG for data transmission
Apply the Similar propagation between the Zones and Nodes on network
Calculating the data & energy to be transferred
Calculating the data to be gathered
Get Different Graphs with Proposed and Existing
Result & Discussion
The Chapter result and discussio displayes the big data gatherig on network with differet snap shorts . These Snap shorts are given below :
Fig. 2: Initial Step
The fig. 2 defines the initial window to process the number of nodes with the help of base stations.
Fig. 3: Processing of Nodes
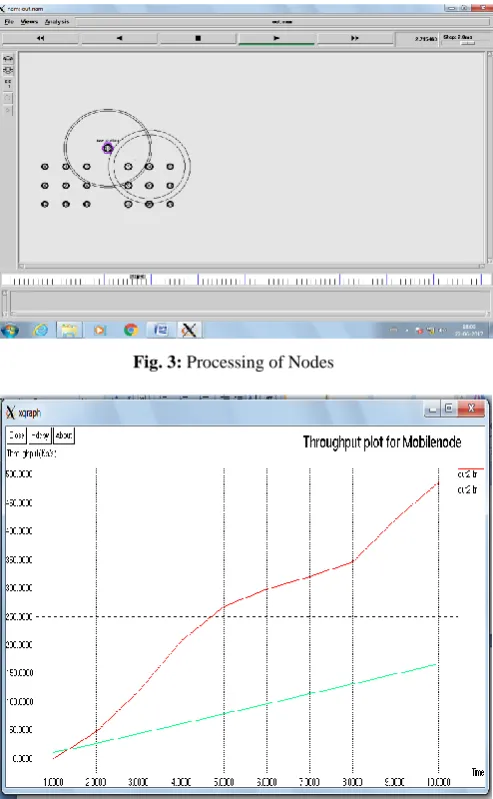
Fig. 4: Throughput of Mobile node
Fig. 5: Packet loss ratio
The fig 4 is explains the throughput of the mobile nodes and the figure 5 is the packet loss ratio of the existing and proposed work. The red line is the proposed work.
Fig. 6: Packet delivery ratio
Fig. 7: Residual energy of existing and proposed work
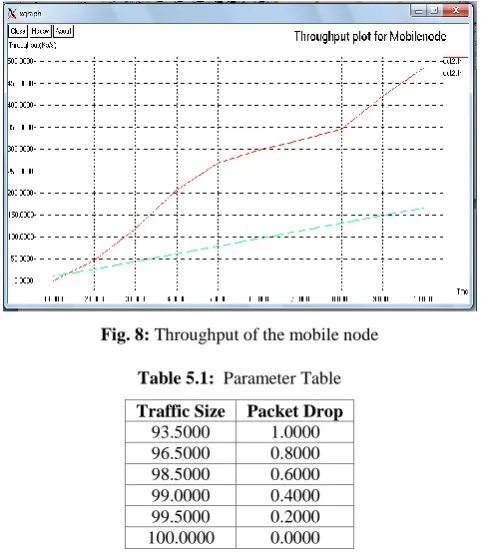
Fig. 8: Throughput of the mobile node
Table 5.1: Parameter Table
Traffic Size Packet Drop
93.5000 1.0000
96.5000 0.8000
98.5000 0.6000
99.0000 0.4000
99.5000 0.2000
100.0000 0.0000
Conclusion
The term big data sets so large or complex data sets where the traditional data processing applications are inadequate. According to IBM in the year 2012, 90% of data in the world was generated in last two years. Hence Big Data is used to analyze, gather and process the large data sets. The main source of big data is wireless sensor networks. The wireless sensor networks are nothing but the collection of many hundreds and thousands of sensor nodes. Because of sensor nodes small size, flexibility, low cost and many other characteristics the Wireless sensor networks are used for monitoring the environment, industries, military and some other technologies. Wireless Sensor Networks has some of the limitations and several types of challenges. They are Critical in time, Large geographical area can be covered, Fixed routing path is not possible and Lesser bandwidth. A large amount of data is gathered by using real-time big data gathering algorithm (RTBDG). Thus, RTBDG algorithm can achieve high performance in the consumption of energy and network lifetime in gathering big data in real time. We proposed a new energy efficient big data aggregation protocol in wireless sensor networks. The key idea behind this algorithm is to recursively divide the sensor network into different partitions symmetrical about a centroid node. Furthermore, a set of cluster heads in the middle of each partition are defined in order to aggregate data from cluster members and transmit these data to cluster heads in the next hierarchical level. The new algorithm adopts the concept of hierarchical clustering which prevents cluster heads from sending their data for long distances and thus the energy consumption of the sensor nodes is significantly improved. In this work the better efficiency is achieved rather then the existing work because the existing work is only depends on physical structure but our work is implemented with logical work and the overall output is 70%.
Future Work
In future this can be implemented in various applications like industries, manufacturing plants etc. As in future
work, when the network is designed then the intermediate nodes in each cluster can serve as cache points in WSN with mobile elements, in an attempt to reduce the contact time of mobile sink, and then reduce the latency of the network. Also, it would be useful if the residual energy is taken into account for cluster heads selection in each transmission round.
References
1. Arivoli, Subramanian, Rajasingh Raveen, and Samuel Tennyson. "Larvicidal activity of Citrullus colocynthis (L.) Schrad (Cucurbitaceae) isolated fractions against Aedes aegypti (L.), Anopheles stephensi Liston and
Culex quinquefasciatus Say (Diptera:
Culicidae)." Indian Journal of Applied Research 5, no. 8 (2016).
2. Sujithra, T., and R. Venkatesan. "Swift and Energy Efficient Big Data Gathering Approaches in Wireless Sensor Networks." International Journal of Computer Applications 138, no. 10 (2016): 14-19.
3. Ms.R.S.Mahathi et.al. ―A Real-time Big Data Gathering Algorithm in Wireless Sensor Networks‖ IJIEST ISSN (2455-8494) Special Issue Vol.01, No. 01, May 2016.
4. Panneer Selvam G. et.al. ―Energy Efficiency in Wireless Sensor Network for Risk Analysis using RMS Algorithm‖ I J C T A, 9(9), 2016
5. Jie Cheng et.al. ―STCDG: An Efficient Data Gathering Algorithm Based on Matrix Completion for Wireless Sensor Networks‖ IEEE TRANSACTION ON WIRELESS COMMUNICATIONS-2016. 6. Xuejun Ding et.al. ―A Real-Time Big Data Gathering
Algorithm Based on Indoor Wireless Sensor Networks for Risk Analysis of Industrial Operations‖ IEEE Transactions on Industrial Informatics-2016.
7. Abdullah I. Alhasanat et.al. ―Data Gathering in Wireless Sensor Networks Using Intermediate Nodes‖ International Journal of Computer Networks & Communications (IJCNC) Vol.7, No.1, January 2015.
8. A. Maskooki, C. Soh, E. Gunawan, K. Low,
―Adaptive routing for dynamic on-body wireless sensor networks,‖ IEEE Journal of Biomedical and Health Informatics, vol. 19, no. 2, pp. 549-558, 2015.
9. W. Shen, T. Zhang, F. Barac, M. Gidlund,
―PriorityMAC: a priorityenhanced MAC protocol for critical traffic in industrial wireless sensor and actuator networks,‖ IEEE Transactions on Industrial Informatics, vol.10, no. 1, pp. 824-835, 2014.
10. K. Yu, Z. Pang, M. Gidlund, J. Akerberg, M.
Björkman, ―REALFLOW: Reliable real-time
flooding-based routing protocol for industrial wireless sensor networks,‖ International Journal of Distributed Sensor Networks,vol. 2014, Article ID 936379, 17 pages, 2014.
11. A. A. Kumar S., K. Øvsthus, L. M. Kristensen, ―An industrial perspective on wireless sensor networks - a survey of requirements, protocols, and challenges,‖ IEEE Communications Surveys & Tutorials, vol. 16, no. 3,pp. 1391-1412, 2014
12. N. Marchenko, T. Andre, G. Brandner, W. Masood, C. Bettstetter, ―An experimental study of selective cooperative relaying in industrial wireless sensor
networks,‖ IEEE Transactions on Industrial
13. W. Shen, T. Zhang, F. Barac, M. Gidlund, ―PriorityMAC: a priority-enhanced MAC protocol for critical traffic in industrial wireless sensor and actuator networks,‖ IEEE Transactions on Industrial Informatics, vol. 10, no. 1, pp. 824-835, 2014. 14. Kan Yu et.al. ―REALFLOW: Reliable Real-Time
Flooding-Based Routing Protocol for Industrial Wireless Sensor Networks‖ Hindawi Publishing Corporation International Journal of Distributed Sensor Networks Volume 2014.
15. Z. Kremljak, C. Kafol, ―Types of risk in a system engineeringenvironment and software tools for risk analysis,‖ Procedia Engineering,vol. 69, pp. 177-183, 2014
16. A. A. Kumar S., K. Øvsthus, L. M. Kristensen, ―An industrial perspective on wireless sensor networks - a survey of requirements, protocols, and challenges,‖ IEEE Communications Surveys & Tutorials, vol. 16, no. 3,pp. 1391-1412, 2014.
17. R. Abrishambaf, S. N. Bayindir, M. Hashemipour, ―Energy analysis of routing protocols in wireless sensor networks for industrial applications,‖ Proceedings of the Institution of Mechanical Engineers, Part I: Journal of Systems and Control Engineering, vol. 226, no. 5, pp. 678-684, 2012. 18. B. C. Villaverde, S. Rea, D. Pesch, ―InRout–A QoS
aware route selection algorithm for industrial wireless sensor networks,‖ Ad Hoc Networks, vol. 10, no. 3, pp. 458-478, 2012.
19. A. Rajini, V. K. David, A hybrid metaheuristic algorithm for classification using microarray data, Int. J. Scientific & Engineering Research, 3(2), 1-9 (2012).
20. G. K. Jati and S. Suyanto, Evolutionary discrete firefly algorithm for travelling sales-man problem, ICAIS2011, Lecture Notes in Artificial Intelligence (LNAI 6943), pp.393-403 (2011).
21. J. Senthilnath, S. N. Omkar, V. Mani, Clustering using firefly algorithm: performance study, Swarm and Evolutionary Computation, 1(3), 164-171 (2011). 22. D. Boyd, K. Crawford, ―Six provocations for big
![Fig. 1: Big data and analytics [3]](https://thumb-us.123doks.com/thumbv2/123dok_us/8397850.1685330/2.595.54.263.530.688/fig-big-data-and-analytics.webp)