WWJMRD 2017; 3(8): 337-343 www.wwjmrd.com
International Journal Peer Reviewed Journal Refereed Journal Indexed Journal UGC Approved Journal Impact Factor MJIF: 4.25 e-ISSN: 2454-6615
Lovepreet Singh M.Tech Scholar GZSCET Bathinda, India
Dinesh Kumar Associate Professor GZSCET Bathinda, India
Correspondence: Lovepreet Singh M.Tech Scholar GZSCET Bathinda, India
A Big Data Analysis for Risk Identification on
Wireless Sensor Network
Lovepreet Singh, Dinesh Kumar
Abstract
The era of big data has begun and the huge amount of real-time data is to be utilized for various applications. Some of the challenging processes are data gathering, processing, and analysis of big data in real time. The sources of big data are widely spread across the whole world. The major source of big data is the Wireless Sensor Networks. Wireless sensor networks are design of many hundreds and thousands of nodes. Every node monitors the environment or some of the physical parameter and combines those data. The sensor nodes energy plays a key role in Wireless sensor networks. In the majority of the cases, the crash of a sensor node occurs due to lack of energy thus the lifetime of a node is limited. Hence, the energy utilization ought to be managed well to exploit the system lifetime. There are a various number of protocols and algorithms were planned to diminish the consumption of energy. Here, a real-time big data gathering algorithm (RTBDG) with HEED and SCH is used for gathering the data in real-time. In this Research work, different Zones are considered that are connect with BS. Each Zone has own gateway, CH, and Nodes who are communicating through BS. In this work maximum energy is saved and further, it is improved on real-time tool and systems.
Keywords: Nodes, WSN, BS, CH, RTBDG, Energy etc.
Introduction
Big knowledge represent a brand new era in knowledge exploration and utilization and covers numerous industrial applications, for example, professionalizing business information gathering within the industry, resolution routing and programming issues in transportation systems , up provides chains by minimizing the negative impact of demand uncertainties , providing security for buildings and physical infrastructure in home police work and security systems [1], and analyzing provide chains with radio-frequency identification technology from each the chance and profit views. Big data also analyze risks in industrial operations, significantly in product producing. Several producing enterprises have strict necessities on instrumentality in use circumstances and atmospheric conditions for a prime quality product, like chip fabrication plants, pharmaceutical factories, and food factories.
In the product producing method of the same enterprises, the operating condition parameters of producing instrumentality and atmosphere knowledge got to be gathered in real time. Abnormal data is extracted from these data for the threat study of product producing to make sure the normal operation of a production system [2]. Yet, a technical challenge exists in collecting real-time big data in various environments. This limitation on real-time data assortment will be overcome by wireless sensor networks (WSN). WSN has become an essential technological support for gathering big data, like temperature, humidity, instrumentality operating condition, health data, and electricity consumption, significantly for data assortment and transmission in indoor environments. Real-time data may be gathered by exploitation sensible sensors, including atmospheric sensors, thermometric sensors, humidity sensors, and accelerometers. The level of data gathered by these sensors could reach the order of petabytes in line with a report of ORACLE [3]. Within the industrial field, massive data denote the huge degree of an assorted period of time knows that area unit gathered, managed, processed, and analyzed for industrial operations.
However, a significant challenge for WSN is making certain that real-time data can be transmitted to the info center. Sensor nodes need enough energy to relay the info gathered by
several encompassing sensors [4]. Therefore, energy is one amongst the foremost necessary indicators in WSN and energy utilization ought to be managed well to maximize network period. To resolve the same issues, an energy-efficient routing algorithm for WSN needs to be designed to gather big data in real time.
Many routing algorithms for WSN are according to prolong network period. Some routing algorithms area unit planned for the universal environment. A centralized cluster algorithmic rule known as the low-energy adaptation cluster Hierarchy (LEACH). The disadvantage of centralized algorithms is that every node should transmit its location and residual energy data to a base station (BS)[5].
Heed Algorithm
HEED clustering algorithm is a distributive clustering method that considers energy and communication value at the similar time. HEED is iterative grouping algorithm formula that utilizes the residual energy of nodes and their communication value to settle on the most effective set of cluster head nodes. Throughout clustering procedure, a sensor node may well be tentative cluster head, final cluster head or coated. At the start of grouping part, a node with higher energy state is additionally probable to be selected as a tentative cluster head. It sends a message to all or any sensor nodes existing in its cluster vary and informs them concerning its new condition. For this purpose, AMRP (average power) is introduce cost criterion and is exploited for breaking constraints in the procedure of cluster head selection. This formula has four main goals [19]:
Increasing network lifetime by distributing energy utilization
Terminating clustering method by constant variety of iterations
Minimizing management overload
Providing acceptable distributed cluster heads and compressed clusters. HEED doesn't think about any assumptions concerning distribution, density or ability of nodes (such as nodes ability relative to their location). Since the formula aims to prolong network period, it decides supported the residual energy of every node. Thus, cluster vary is decided by transmitted power level utilized in inhume cluster communication and through clustering [21].
When many nodes are the candidate for being cluster head, the node that has all-time lowest inter-cluster value is going to be elite as the cluster head. This cost is a function of:
Cluster characteristics, like the size of a cluster. Variability or non-variability of energy levels utilized
in intra-cluster communications. If power levels for cluster nodes are an equivalent, communication value can be addicted to the following parameters: Node degree, if it's necessary for the load to be distributed on cluster heads. An inverse of node degree, if denser clusters are needed. Now consider a case where variable power levels could be utilized for intra-cluster communications. In this condition, MinPwri is the minimum power node i (1<i<M).
Sensor Node Design
Figure 1. Shows the sensor node design on a sensor board [16]. Here, we will see that every sensor has 4 main parts, particularly sensing unit, a processing unit, transmission
unit, and electromagnetic unit. Also, it's 2 various parts that are position finding system and mobilizer. Its price noting that every sensor has restricted resource in case of energy, bandwidth, process and memory that bring research challenges like routing, localization etc.
Sensing unit: The sensing unit sometimes consists of 2 subunits that area unit device and ADC (Analog-to-Digital Converter) units. Since discovered info is an analogous signal, it has to be remodeled into a digital signal for any process with ADC devices.
Processing unit: This unit additionally consists of 2 subunits that area unit processor and storage units. The choice of process unit relies on factors like power consumption, offered memory etc. The memory is of special importance since it's tightly connected with the dimensions of knowledge to be kept, processed and buffered for transmission [12].
Fig. 1: Sensor node design [8]
Problem Formulation
In this work big data processing on wireless sensor network different problems are faced that are given below:
1. There is routing and scheduling problems have occurred through the processing of big data on WSN. 2. The main problem in the design of the routing
algorithm of WSN is the maximization of the network lifetime and balancing the energy utilization of sensor nodes.
3. Communication failures or deadline misses may result in conflict to the process, degradation of the on the whole control performance, and even more serious economic losses or human safety problems.
4. Another Problem is the data Optimization problem.
Methodology
Nodes are randomly distributed in the sensing field. In this network, the nodes are static and fixed. The sensor nodes sense the information and then send to the server. If the source node sends the packet, it will send through the intermediate node. The nodes communicate only within the communication range. So, we have to find the node’s communication range. The configuration parameter used for configure the nodes are tabulated as follows:
Table 1: Simulation Parameter Values
Parameter Type Parameter Value
Simulation Time 60ms
Simulation Area 1500x1000m
Number of Nodes 10,20,30…….,50
Antenna Type Omni Antenna
Mobility Model Random Way Point
Energy Model Energy Model
MAC Protocol 802.11
Transmission Range 250m
Traffic Model CBR
The data from the sensor nodes are collected by using Real-Time Big Data Gathering algorithm based on the Source-Sink and residual energy information.
Existing Algorithm
Step 1: Nodes are deployed on the network. Step 2: Sensing the BS and the Cluster head.
Step 3: Applying the LEACH and Energy processing from BS to Node.
Step 4: Measuring the Distance during transmission of Energy and Data.
Step 5: Calculating the data & energy to be transferred. Step 6: Calculating the data to be gathered.
Step 7: Repeating the steps on multiple stations. Step 8: Stop
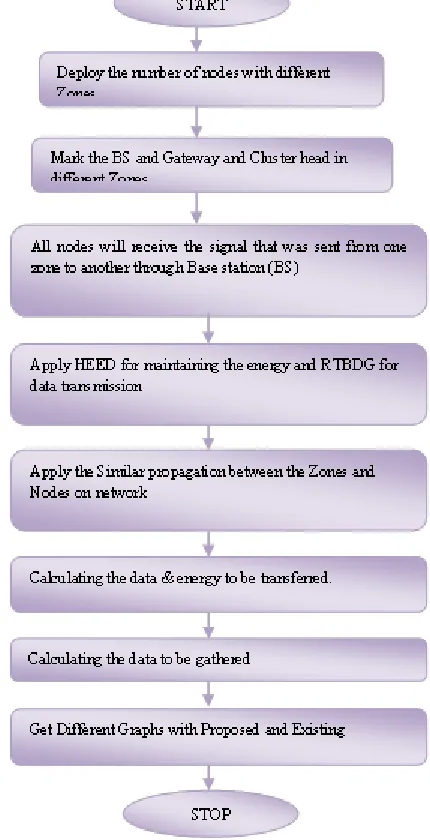
Proposed Algorithm
The data from the sensing nodes square measure collected by victimization real-time big data Gathering rule supported the source-sink and residual energy data. The sensing nodes square measure deployed during a field and sensing element networks ought to have following properties:
Step 1: Deploy the number of nodes with different Zones. Step2: Mark the BS and Gateway and Cluster head in different Zones.
Step 3: All nodes will receive the signal that was sent from one zone to another through Base station (BS)
Step 4: Apply HEED for maintaining the energy and RTBDG for data transmission.
Step 5: Apply the Similar propagation between the Zones and Nodes on the network.
Step 6: Calculating the data & energy to be transferred. Step 7: Calculating the data to be gathered.
Step 8: Repeating the steps on multiple stations. Step 9: Stop
In RTBDG rule sensing nodes ought to screen the gathered knowledge in step with a demand for Risk Analysis. The screening method is explained below:
a) At first, the info collected from the sensing nodes with the traditional reference vary is established.
b) The info ought to be collected among some regular interval time.
c) The info collected by sensing nodes square measure compared with the traditional reference worth. If these knowledge square measure below the traditional reference worth then it's kept at an everyday amount. In an alternative case, if any abnormalities each the abnormal knowledge and therefore the keep knowledge is transmitted to Base Station (BS). d) If the keep knowledge reaches the higher limit worth
of capability then all the info square measure transmitted to the bottom station by suggests that of established routes.
e) Thus the screening method is completed by victimization higher than steps.
Fig. 2: Flow Chart of the Work
Result & Discussion
This includes the big data gatherig on network with differet snap shorts . These Snap shorts are given below :
Fig. 3: Initial Step
Fig. 4: Processing of Base Station
The figure 4 is the formation of Base station. In this figure all the zones are unable to do communication. For the communication of each zones Base station is processed that is the fourth Circle.
Fig. 5: Processing of Nodes
The figure 5: is the processing of different nodes in different Zones on the network. In this figure the z one ID 0 and 1 gaining the different types of nodes with different ID.
Fig. 6: Nodes Position and BS ID
In the figure 6: is the processing of Nodes position and Base station with different ID. Here the Base stations have ID 34 and other nodes have different ID in different Zones.
Fig. 7: Initialising the User Position
The figure 7: is the in initialization of user position in the form of different nodes. Here the third zone also includes the different nodes with different ID.
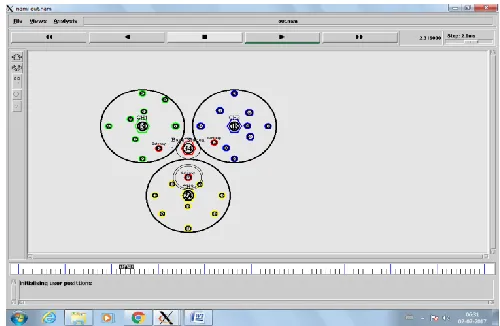
Fig. 8: Node Color Labeling
The figure 8: is the node coloring of the different Zones. Here each zone has different color. The Zone 0 includes the Green color and the zone 1 includes the blue color and the zone 2 includes the yellow color. The base station includes the Red color.
Fig. 10: Signal broadcasting between different Nodes
The figure 9 is the processing of source and sink identification of node on network. It displays the data transmission between nodes through gateway and Base station. The figure 10 is the communication between the zone 0 and 2 during the transmission of data.
Fig. 11: Packet dropping from zone 0
The figure 11 displays the drop of packet during the transmission of the data. In this figure all the nodes are communicating between each other and when the loss of energy is occurred then the packet is dropped.
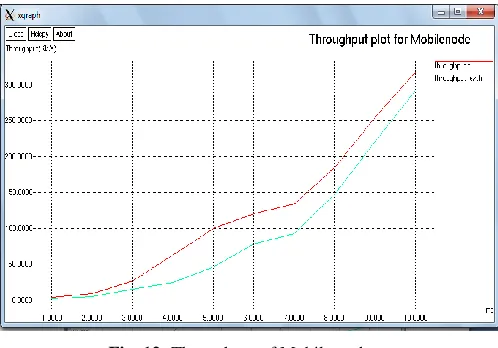
Fig. 12: Throughput of Mobile node
The figure 12 is the processing of throughput of mobile nodes during the transmission of data. In this the Red line is the proposed work and the Green line is the existing work of the big data.
Fig. 13: Packet loss ratio
The fig 13: is the packet loss ratio of the existing and proposed work. The red line is the proposed work and the green line is the existing work of the data.
Fig. 14: Packet delivery ratio
The figure 14 is the packet delivery ratio of the big data on different zones. In this figure values are varied during the processing of Time. The red line shows the better results that is the proposed work.
Fig. 15: Residual energy of existing and proposed work
The figure 15 is the Residual energy of existing and proposed work. Here the red line is proposed and the green is the existing work.
Conclusion
algorithm can achieve high performance in the consumption of energy and network lifetime in gathering big data in real time. We proposed a new energy efficient big data aggregation protocol in wireless sensor networks. The key idea behind this algorithm is to recursively split the sensor network into various parts symmetrically about a root node. Furthermore, a set of cluster heads in the middle of each partition is defined in order to aggregate data from cluster members and transmit these data to cluster heads in the next hierarchical level. The new algorithm adopts the concept of hierarchical clustering which prevents cluster heads from sending their data for long distances and thus the energy utilization of the sensor nodes is significantly improved. In this work, the better efficiency is achieved rather than the existing work because the existing work only depends on physical structure but our work is implemented with logical work and the overall output is 70%.
Future Work
As in future work, when the network is designed then the intermediate nodes in each cluster can serve as cache points in WSN with mobile elements, in an attempt to reduce the contact time of mobile sink, and then minimize the latency of the network. Also, it would be useful if the residual energy is taken into account for cluster heads selection in each transmission round.
References
1. A. A. Kumar S. et.al. “An industrial perspective on wireless sensor networks - a survey of requirements, protocols, and challenges,” IEEE Communications Surveys & Tutorials, vol. 16, no. 3,pp. 1391-1412, 2014
2. A. Maskooki et.al. “Adaptive routing for dynamic on-body wireless sensor networks,” IEEE Journal of Biomedical and Health Informatics, vol. 19, no. 2, pp. 549-558, 2015.
3. A. Rajini, et.al. “A hybrid metaheuristic algorithm for classification using microarray data”, Int. J. Scientific & Engineering Research, 3(2), 1-9 (2012).
4. Abdullah I. Alhasanat et.al. “Data Gathering in Wireless Sensor Networks Using Intermediate Nodes” International Journal of Computer Networks & Communications (IJCNC) Vol.7, No.1, January 2015. 5. Antu Raj S et.al. “A New Approach for Big Data
Gathering in Dynamic Wireless Sensor Networks” International Journal of Science and Research (IJSR) ISSN (Online): 2319-7064 Index Copernicus Value (2013).
6. Arivoli, Subramanian et.al. "Larvicidal activity of Citrullus colocynthis (L.) Schrad (Cucurbitaceae) isolated fractions against Aedes aegypti (L.), Anopheles stephensi Liston and Culex quinquefasciatus Say (Diptera: Culicidae)." Indian Journal of Applied Research 5, no. 8 (2016).
7. B. C. Villaverde et.al. “InRout–A QoS aware route selection algorithm for industrial wireless sensor networks,” Ad Hoc Networks, vol. 10, no. 3, pp. 458-478, 2012.
8. D. Boyd et.al. “Six provocations for big data,” A Decade inInternet Time: Symposium on the Dynamics of the Internet and Society, 2011.
9. Jie Cheng et.al. “STCDG: An Efficient Data Gathering
Algorithm Based on Matrix Completion for Wireless Sensor Networks” IEEE TRANSACTION ON WIRELESS COMMUNICATIONS-2016.
10. K. Yu et.al. “REALFLOW: Reliable real-time flooding-based routing protocol for industrial wireless sensor networks,” International Journal of Distributed Sensor Networks,vol. 2014, Article ID 936379, 17 pages, 2014.
11. Kan Yu et.al. “REALFLOW: Reliable Real-Time Flooding-Based Routing Protocol for Industrial Wireless Sensor Networks” Hindawi Publishing Corporation International Journal of Distributed Sensor Networks Volume 2014.
12. Ms.R.S.Mahathi et.al. “A Real-time Big Data Gathering Algorithm in Wireless Sensor Networks” IJIEST ISSN (2455-8494) Special Issue Vol.01, No. 01, May 2016.
13. N. Marchenko et.al. “An experimental study of selective cooperative relaying in industrial wireless sensor networks,” IEEE Transactions on Industrial Informatics, vol. 10, no. 3, pp. 1806-1816, 2014. 14. Neethu M. Nair et.al.“Survey on Data Collection
Methods in Wireless Sensor Networks” International Journal of Engineering Research & Technology (IJERT) Vol. 2 Issue 12, December – 2013.
15. Panneer Selvam G. et.al. “Energy Efficiency in Wireless Sensor Network for Risk Analysis using RMS Algorithm” I J C T A, 9(9), 2016
16. R. Abrishambaf et.al. “Energy analysis of routing protocols in wireless sensor networks for industrial applications,” Proceedings of the Institution of Mechanical Engineers, Part I: Journal of Systems and Control Engineering, vol. 226, no. 5, pp. 678-684, 2012.
17. R. Elankavi et.al. “Data Collection in Wireless Sensor Networks - A Literature Survey” International Journal of Innovative Research in Computer and Communication Engineering Vol. 1, Issue 5, July 2013.
18. S. Palit et.al. “A cryptanalytic attack on theknapsack cryptosystem using binary Firefly algorithm”, in: 2nd Int. Conference on Computer and Communication Technology (ICCCT), 15-17 Sept 2011, India, pp. 428- 432 (2011).
19. Sina K. Azad et.al. “Optimum Design of Structures Using an Improved Firefly Algorithm” International Journal of Optimisation in Civil Engineering, 1(2), 327-340(2011).
20. Sujithra, T et.al. "Swift and Energy Efficient Big Data Gathering Approaches in Wireless Sensor Networks." International Journal of Computer Applications 138, no. 10 (2016): 14-19.
21. T.M. Choi, et.al. “Coordination and risk analysis of VMI supply chains withRFID technology,” IEEE Transactions on Industrial Informatics, vol. 7, no.3, pp. 497-504, 2011.
22. V.Shrinithi et.al. “A Survey on Data Collection in Wireless Sensor Network with Mobile Elements” International Journal of Latest Trends in Engineering and Technology (IJLTET), Vol. 3 Issue2 November 2013.
Industrial Informatics, vol.10, no. 1, pp. 824-835, 2014.
24. Xuejun Ding et.al. “A Real-Time Big Data Gathering Algorithm Based on Indoor Wireless Sensor Networks for Risk Analysis of Industrial Operations” IEEE Transactions on Industrial Informatics-2016.
![Fig. 1: Sensor node design [8]](https://thumb-us.123doks.com/thumbv2/123dok_us/8397519.1685181/2.595.317.531.246.415/fig-sensor-node-design.webp)