299
Experimental Investigation and Optimization of
Welding Parameters for A TIG Welding With
SS410 Using ANOVA
Purusothaman M*, Captain Prabhakaran M, Brabu S, Venkatesan S P, Senthilkumar G
Abstract- Stainless steel is extensively used in high resistance and corrosion places such as storage tanks, pipelines, pressure cups, under water industries, aerospace etc. Martensitic grades are all heat treatable grades. Welding methods such as metal inert gas welding or Tungsten Inert Gas can be used to weld this material. TIG welding is the most conventional method of fusion welding used due to material saving, energy saving, cost and accuracy. An effort is prepared to get better the hardness and impact of SS410 by experimenting and changing the existing process of welding parameter. In this research proper assortment of input parameter is necessary. The work experimentation is conducted in TIG welding machine and SS410 stainless steel of 100 *100* 10 mm dimension plates and hardness ,impact test are also been done. The research experiment will be applied ANOVA Method on a Martensitic stainless-steel specimen to statically approach and to develop the numerical models all the way through experimental test runs to forecast the likely output on the base of the known input data or parameters such as input currant ,voltage and gas pressure. Image J software is used to discover the deepness of diffusion of welding.
Keywords: Stainless steel, Tungsten Inert Gas, ANOVA, Welding parameters, Optimization
————————————————————
1. INTRODUCTION
Welding is a long-lasting joining process worn to join dissimilar materials like metals, alloys or plastics, together at their surfaces by producing of heat and pressure. At some point in welding, two pieces are bound together by melting at the interface and solidification to achieve permanent joint. Sometimes a filler metal may or may not be used to form a weld of molten material which after solidification gives a strong link between the objects. The TIG and MIG process to discover out the individualities of the metal after it is welded .Keeping voltage is constant and studied the other variable characteristics such as strength, grain structure, ductility, tensile strength, hardness, HAZ are analyzed, experimented and finally determined [1]. Almazrouee et.al were conceded out Quality of the weld bead is always controlled by its geometry and structure which, in turn are regulated by several welding process input factors such as welding speeds, current, voltage and the kind of welding process. Flux cored arc welding process is proven to deliver good control over heat input through the deployment of the process variables that can ensure an advance determination of the best bead geometry. The objective of the current examination is to correlate the geometry aspects of the flux cored arc welding bead; height, depth of diffusion and bead width to the welding operating parameters; traverse speed, voltage and amperage. This is conducted out studying various types of shielding gases. For each segment of the above-mentioned bead geometry-operating parameters connection, investigational data are used to develop the applicable best mathematical model using linear and nonlinear regression
techniques. Developed models are examined against their sufficiency and prominence and, are further validated using additional verification experimental data [2]. Sudakaran et.al analyzed the effect of gas tungsten arc welding (GTAW) factors on fighting corrosion on AISI 202 chromium manganese stainless steel was studied. Composite response of surface methodology with 4 parameter and 5 readings was employed for performing the trials. The sufficiency of the developed model was checked applying ANOVA. The quality of the weld joint is greatly affected by the microstructure of the weldment. Study focused on the grain structure, carbides presence and development of austenite and martensite in the weldment. The results achieved from the present analysis helps in instantly selecting the necessary process parameters to attain the required PREN and weld quality [3].
Tabish et.al were analyzed AISI 410 stainless steel plates were butt-welded through manual tungsten inert gas welding (TIG) process. The process was useful to several samples by unstable heat inputs. Microhardness measurements indicated that hardness close to the upper surface of the weld is superior and that close the center of the weld is low because of the more rapidly cooling of the exterior than the interior of the weld. The microstructural research showed that the high heat input generated larger dendrites than those made with medium & low heat input [4]. Raveendra et al were analyzed welding parameters which play vital role in joining the work pieces of 5052 aluminum alloy by TIG welding. This document represents the effect or impact of welding parameters on the weld bead geometry of weld joint. Factors like Welding current, gas flow rate and speed are studied during the experiment work and found rise in heat energy on work piece surface by increasing the welding current which results in increasing the front width and back width of weld joint linearly. Front and back width of weld joint reduces linearly with the increment of welding speed. Front and back breadth of weld joint rises or declines otherwise with rising of gas flow rate [6].
__________________________
Purusothaman M*, Captain Prabhakaran M, Brabu S, Venkatesan S P, Senthilkumar G
School of Mechanical Engineering, Sathyabama Institute of Science and Technology, Chennai-600119, Tamilnadu, India.
300
2.
EXPERIMENTAL
PROCEDURE
AND
MATERIAL SELECTION
2.1 Stainless Steel Welding
The scope of applications of stainless steel involves containers, industrial piping and vessels, architectural and constructional structures. Due to their chemical components, a higher thermal elongation steels have, Martensitic Stainless is good compared to mild steels. The progress of nonreactive stainless steels with different characteristics that include variable amounts of corrosion resistance, strength, and workability has been a huge benefit to steel users. This advancement has made welding stainless steel more complex than welding conventional carbon steel. This advancement has made welding stainless steel more complex than welding conventional carbon steel. People often are amazed to study that there are more than one type of stainless steel. The technique required to weld stainless steel is not much different from the weld standard carbon steel, with two exemptions. The distinct properties that make up stainless steels hard to machine occur to a greater or lesser amount in all grades of stainless steels but are highly observed in the Martensitic grades.
2.2 Metallurgical Defects
Cracks are the linear breaks of the metal under stress. Occasionally they appear large and normally they are narrow separations.
Reason for Cracking
1. Base metal structure
2. Welding process characteristics 3. Substandard welding filling materials 4. Welding environment
5. Joint design
6. Cracking may occur in: i) Weld metal
ii) Heat affected zone
2.3 Material Selection
The stainless steel is classified in four categories like austenitic, ferritic, martensitic etc., we have chosen Martensitic stainless steel (410) due to its low cost, easy accessibility. Stainless steel is selected for taking out the experimental analysis because of its several advantages and easy availability in the industry.
1. The stainless steel is classified in several categories like austenitic, ferritic, martensitic etc from this we chosen martensitic stainless steel (410) because of its low cost, easy availability in the industry.
2. Semi-Automatic TIG welding method is used to carry out the experiment.
Procedure for carrying out the project
9 samples plates were taken (9 pieces of AISI 410) of Martensitic stainless steels, The material specifications are as
thickness of 3 mm and length of 100 mm. Typical composition scales for grade 410 stainless steels is as given Table 1 and their mechanical properties are presented in Table 2.
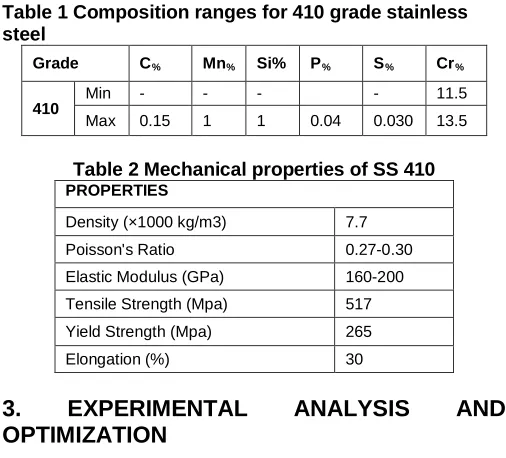
Table 1 Composition ranges for 410 grade stainless steel
Grade C% Mn% Si% P% S% Cr%
410 Min - - - - 11.5
Max 0.15 1 1 0.04 0.030 13.5
Table 2 Mechanical properties of SS 410
PROPERTIES
Density (×1000 kg/m3) 7.7
Poisson's Ratio 0.27-0.30
Elastic Modulus (GPa) 160-200
Tensile Strength (Mpa) 517
Yield Strength (Mpa) 265
Elongation (%) 30
3.
EXPERIMENTAL
ANALYSIS
AND
OPTIMIZATION
3.1 Taguchi Design
Experimental design methods were developed if you need to do experimentation on having different control parameters and factors, you will have various values or levels. DOE will support you with choosing the parameters and their values most efficiently and economically. Moreover, a great number of experiments have to be carried out when the number of the process parameters rises, to solve this problem, the Taguchi method uses a distinct design of orthogonal arrays helps to study the entire parameter with a less number of experiments. The experimental results are then changed into a signal – to – noise (S/N) ratio to measure the value characteristics move away from the desired values. There are three categories of quality analysis of the S/N ratio, the – lower – better, the – higher – better, and the – nominal – better. Irrespective of the category a greater S/N ratio communicates to better quality characteristics. With the S/N and ANOVA analyses, the optimal grouping of the process parameters can be predicted. They are
1. Smaller is better
The signal-to-noise (S/N) ratio is calculated for each factor level combination. The formula for the smaller-is-better S/N ratio using base 10 log is:
S/N = -10*log(S (Y2)/n)
Where Y = responses for the given factor level combination and n = number of responses in the factor level combination.
2. Larger is better
The signal-to-noise (S/N) ratio is calculated for each factor level combination. The formula for the larger-is-better S/N ratio using base 10 log is:
S/N = -10*log(S(1/Y2)/n) 3. Nominal is better
The signal-to-noise (S/N) ratio is calculated for each factor level combination. The formula for the nominal-is-best I S/N ratio using base 10 log is
S/N = -10*log (s2)
301
3.2 Design of Experiment
In this experiment three level process parameters namely welding current, voltage, and shielding gas pressure are considered as given Table 3.
Constant parameter:
1. Work Piece Thickness 2. Wire rod diameter 3. Welding speed
Input Parameter:
1. Factor A: Welding Current 2. Factor B: Welding Voltage 3. Factor C: Gas Pressure
Table 3 Process parameters and their levels responses
LEVE LS
PROCESS PARAMETERS PEAK
CURREN T (Amps)
BASE CURRENT(A mps)
GAS PRESSURE
1 160 20 4
2 180 30 5
3 200 40 6
3.3. Design of Orthogonal Array
In Taguchi method a specially designed technique called the practice of orthogonal array. Design will identify all possible combinations for a given set of factors as given Table 4 .Taguchi orthogonal array is done in minitab-17 software to determine S/N ratio and means. The L9 orthogonal array is intended for identifying the impact of 4 independent factors each having 3 factor level values. Then a window of Taguchi design is opened. To start Minitab a window is opened in computer.
Table 4 Process parameters and their levels responses
S.No PEAK
CURRENT
BASE CURRENT
GAS PRESSURE
1 160 20 4
2 160 30 5
3 160 40 6
4 180 20 5
5 180 30 6
6 180 40 4
7 200 20 6
8 200 30 4
9 200 40 5
3.4 Specimen Preparation
The specimen edges are prepared using a wire cutting machine. The preparations are done to make the weld joint a gap of (1 mm to 2 mm) between the sections to ensure proper penetration of the weld. Specimens of dimensions 100 mm × 100 mm× 10 mm are prepared, then closed butt joint are made by these specimens. Prior To welding, edges of the work pieces are properly prepared. The edges and the area connecting them is made dust free using wire brush. After that, the work pieces to be welded were positioned properly and parallel to each other and welding is performed under constant speed and wire diameter position. But the welding current, voltage and gas pressure varies for each test.
4.RESULTS AND DISCUSSION
4.1 Hardness Value
There are three types of tests used in industry namely Brinell hardness test, the Rockwell hardness test, and the Vickers hardness test as shown in Fig.1. The ultimate strength and hardness are rather simillar, it can normally be assumed that a strong metal is as well a hard metal. The tests reveal the depths a ball or cone in the machine will sink into the metal under given load within a certain period of time are presented in Table 5.
Fig.1 Rockwell Harness Test
Table 5 S/N ratios values for the Hardness Value
S. N o
PEAK CURR ENT
BASE CURRE NT
GAS PRESS URE
HARDN ESS
SN-RATIO
1 160 20 4 88 -38.88
2 160 30 5 86 -38.69
3 160 40 6 92 -39.27
4 180 20 5 98 -39.82
5 180 30 6 93 -39.36
6 180 40 4 94 -39.46
7 200 20 6 85 -38.58
8 200 30 4 95 -39.55
9 200 40 5 87 -38.79
For example in order to find out the main effect of level 1 setting of the independent variable 2 (refer Table 5), sum the performance parameter values of the experiments 1, 4 and 7 and in the same way for level 2, sum the experimental results of 2, 5 and 7 and so on. Once the mean value of each level of a independent variable is calculated, the sum of square of deviation of each of the mean value from the grand mean value is calculated.
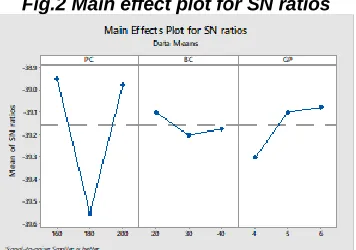
Fig.2 Main effect plot for SN ratios
302 runs with 180,200. Base currant had a small effect or no
effect on the signal-to-noise ratio.
Fig.3 Main effect plot for Means
4.2 Response Table for S-N Ratio
Table 6 Response Table for Signal to Noise Ratios-Larger is better
Level PEAK BASE GP
Delta 0.60 0.10 0.22
Rank 1 3 2
Table 7 Response Table for Means
Level PEAK BASE GP
Delta 6.33 1.00 2.33
Rank 1 3 2
The tables include ranks based on Delta statistics, which compare the relative magnitude of effects. The Delta statistic is the highest minus the lowest average for each factor. Minitab assigns ranks based on Delta values; rank 1 to the highest Delta value, rank 2 to the second highest, and so on
4.3 Significant Contribution Value by Anova Method
Table 8 Analysis of Variance for IS, using Adjusted SS for Tests
SOURC E
D F
Seq SS
Adj
SS F P
% OF
CONTRI BUTION
PEAK 2 76.222 38.1111 0.98 0.504 46
BASE 2 1.556 0.7778 0.02 0.98
0 1
GP 2 9.556 4.7778 0.12 0.89
0 6
Error 2 77.556 38.777 47
Total 8 164.88 100
Key Results: P-Value, Coefficients
In this example, for the signal-to-noise ratio, Peak currant has a p-value that is less than 0.6, thus, Peak currant is statistically significant at a significance level of 0.6.
4.4 IMPACT TEST
Normally a notched sample is used to verify impact strength. Impact is a very significant phenomenon in managing the life of a structure. An arm held at a specific height (constant potential energy) is released and it hits the sample and breaks it. The impact strength is determined by the energy absorbed by the sample.
Table 9 Impact Strength
S.N o
PEAK CURR ENT
BASE CURRE NT
GAS PRESSU RE
IMPAC
T SN-RATIO
1 160 20 4 38 31.59
2 160 30 5 44 32.86
3 160 40 6 32 30.10
4 180 20 5 36 31.12
5 180 30 6 38 31.59
6 180 40 4 40 32.04
7 200 20 6 38 31.59
8 200 30 4 42 32.46
9 200 40 5 26 28.29
Fig.4 Main effect plot for SN ratio Noise Ratios-Larger is better
In these results, the main effects plot for S/N ratio indicates that Base current has the largest effect on the signal-to-noise ratio. On average, experimental runs with 30 amps had much higher signal-to-noise ratios than experimental runs with 20,40. Peak currant had a small effect or no effect on the signal-to-noise ratio.
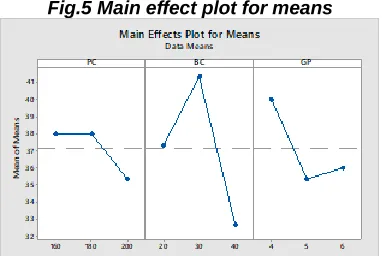
Fig.5 Main effect plot for means
4.5 IMPACT RESPONSE FOR EACH LEVEL OF THE PROCESS PARAMETER
Table 10 Response Table for Signal to Noise Ratios-Larger is better
Level PEAK BASE GP
Delta 0.80 2.16 1.27
Rank 3 1 2
Table 11 Response Table for Means
Level PEAK BASE GP
Delta 2.67 8.67 4.67
303
4.6 Significant Contribution Value by Anova Method
Table 12 Analysis of Variance for IS, using Adjusted SS for Tests
SOU
RCE DF
Seq SS
Adj
SS F P
% OF
CONTRIBU TION
PEAK 2 14.2 2
7.11 1
0.21 0.82
6 6
BASE 2 112. 89
56.4 44
1.67 0.37 4 49
GP 2 38.22 19.111 0.57 0.639 16
Error 2 67.5 6
33.7
78 29
Total 8 232.
89 100
Key Results: P-Value, Coefficients
In this example, for the signal-to-noise ratio, Peak currant has a p-value that is less than 0.5, thus, Peak currant is statistically significant at a significance level of 0.5.
4.7 Depth of Penetration
Since penetration determines the stress carrying capacity of a welded joint insufficient weld bead dimensions such as shallow depth of penetration may contribute to failure of a welded structure. To avoid the occurrences the input welding process variables must therefore be correctly selected and optimized to obtain an agreeable weld bead penetration and hence a high quality joint. ImageJ is software used for image processing program designed for scientific multidimensional images analysis.
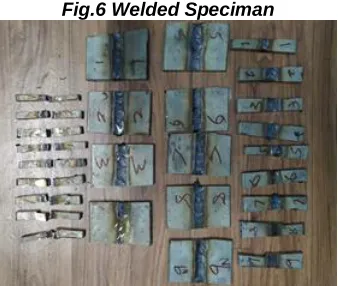
4.8 View of Test Plates
Fig.6 Welded Speciman
4.9 Various Sizes of Bead Width, Depth of Penetration and Heat Affected Zone-Ss410-Gtaw
Table 13 Analysis of feed geometry
SAM PLE S
Area Mean Min Max Angle Length
S1 0.39 123.95 81.33 147 0 11.34
0.213 91.048 43.33 107 90 6.186
S2 0.35 104.20 76.66 134.33 0 10.594
0.216 88.305 40 108.33 90 6.535
S3 0.31 124.95 57 143.66 0 11.077
0.132 84.109 61.66 102.33 90 5.154
S4
0.237 142.33 67.33 160.33 0 8.88 0.124 88.412 49.66 121 90 4.64
S5
0.273 130.11 64 217.66 0 9.833 0.162 79.667 64.66 97.333 90 5.833
S6
0.29 101.55 72.66 127.66 0 10.171 0.151 70.197 47 109.33 90 5.299
S7
0.271 102.51 59.66 123 0 9.576 0.122 71.939 43.33 95.333 90 4.322
S8
0.35 108.36 44 129.33 0 11.545
0.179 79.356 45 96.333 90 5.909
S9
0.26 121.45 33 150 0 9.677 0.15 64.728 39 99 90 5.565
5. Conclusion
TIG welding can be used successfully to join SS410. The processed weld joints displayed improved mechanical and metallurgical characteristics. The joints have shown 90%-95% of parent material’s Hardness value. The specimen failures were depending upon the improper changes of heat value. It creates so many metallurgical defects. In our experiment practically we have found out the input parameter value 160 PEAK CURRENT -30 BASE CURRENT GAS PRESSURE -5 Kg/cm2) is the best value and it does not create any major variations and depth of penetration also high compared than other test plates. According to the Taguchi design,
optimized parameter is hardness value for the 10 mm plate of SS410 steel is 160 amps -peak current, amps -base current -40, gas pressure-5 kg/cm2 and mainly influenced with peak current 46%
Impact strength was the 10 mm plate of ss410 steel is 160 amps-peak current, amps-base current -30 amps gas pressure-5 kg/cm2 and mainly influenced with base current 49%.
References
[1] L.Suresh Kumar , T.Siva Shankar Experimental Investigation for Welding Aspects of AISI 410 & 316 by Taguchi Technique for the Process of TIG & MIG Welding International Journal of Engineering Trends and Technology- Volume2Issue2- 2011
[2] A. Almazrouee, T. Shehata and S. Ora by Effect of Welding Parameters on the Weld Bead Geometry of Low Alloy Steel using FCAW –Empirical Modeling Approach International Journal of Mining, Metallurgy & Mechanical Engineering (IJMMME) Volume 3, Issue 3 (2015) ISSN 2320–4060 (Online)
[3] Sudhakaran. Ra, Sivasakthivel. P.Sb, Nagaraja.Sc and Eazhil. K.M 12th Global Congress on Manufacturing and Management, Gcmm 2014 [4] T.A.Tabish, T.Abbas, M.Farhan, S.Atiq, T.Z.Butt
304 [5] S. L. Jeng, H. T. Lee, T. E. Weirich and W. P.
Rebach Microstructual Study of the Dissimilar Joints of Alloy 690and SUS 410L Stainless Steel Materials Transactions, Vol. 48, No. 3 (2007) pp. 481 to 489 -2007 The Japan Institute of Metals. [6] Purusothamam M, Tariq Mohammad Choudhury,