Examining Gender Inequality
In A High School Engineering Course
Catherine Riegle-Crumb, Ph.D., University of Texas at Austin, USAChelsea Moore, MA, University of Texas at Austin, USA
ABSTRACT
This paper examines gender inequality within the context of an upper-level high school engineering course recently offered in Texas. Data was collected from six high schools that serve students from a variety of backgrounds. Among the almost two hundred students who enrolled in this challenge-based engineering course, females constituted a clear minority, comprising only a total of 14% of students. Quantitative analyses of surveys administered at the beginning of the school year (Fall 2011) revealed statistically significant gender gaps in personal attitudes towards engineering and perceptions of engineering climate. Specifically, we found that compared to males, females reported lower interest in and intrinsic value for engineering, and expressed less confidence in their engineering skills. Additionally, female students felt that the classroom was less inclusive and viewed engineering occupations as less progressive. Gender disparities on all of these measures did not significantly decrease by the end of the school year (Spring 2012). Findings suggest that efforts to increase the representation of women in the engineering pipeline via increasing exposure in secondary education must contend not only with obstacles to recruiting high school girls into engineering courses, but must also work to remedy gender differences in engineering attitudes within the classroom.
Keywords: Gender; Inequality; High School; Attitudes
INTRODUCTION
ver the past several decades, women have made substantial strides towards more equitable representation in science, technology, engineering, and math (STEM) fields. For example, in 1971, women comprised 14% of those who earned a bachelor’s degree in physical science and 30% of those with a degree in biology. By 2009, those percentages increased to 41% and 60% respectively (U.S. Department of Education, 2012). Regarding engineering, less than 1% of bachelor degree earners in 1971 were female, compared to a corresponding percentage of 18% in 2009. While this clearly indicates a substantial increase, engineering nevertheless stands out as the STEM postsecondary field most in need of improvement in terms of gender equality in representation.
Concerns about females’ relative absence from engineering have been typically focused on the postsecondary level (as well as on the labor force). However, there has been recent growth in the availability of engineering courses at the high school level; specifically, the percentage of students taking engineering courses in high school increased from approximately 1% in 1982 to about 8% in 2009 (Snyder & Dillow, 2012). High school engineering courses offer a new location in the educational pipeline that is in need of further study, particularly regarding gendered patterns. Optimistically, it is possible that such courses could serve a transformative function, bringing large numbers of young females into contact with engineering, dispelling stereotypes about the field, and increasing their interest in the field while bolstering their confidence. Yet given the vast literature on obstacles to gender equity in STEM (which we review in the next section), there is reason to expect that such courses may simply mirror disparities observed at the postsecondary level.
This study examines a new high school engineering course offered in several school districts in Texas. We collected survey data to address three specific questions. First, to what extent are females under-represented?
Second, upon enrollment in this course, are there gender differences in personal attitudes towards engineering as well as perceptions of engineering climate? Third, to what extent do any gender disparities in attitudes observed at the beginning of the year change after a year-long first-hand experience with engineering? In addressing these questions we contribute new information to the literature on gender inequality in engineering and other STEM fields.
BACKGROUND
The Importance of Attitudes
While historically there was evidence that females were less qualified to pursue advanced levels of education and occupations in STEM fields because of lower achievement, this is no longer the case (Riegle-Crumb et al., 2012; Xie & Shauman, 2003). Although gaps on some standardized tests remain, these are typically small in magnitude (Hyde & Linn, 2006). Females outperform males on grades earned in math and science classes in high school, take similar levels of advanced courses in high school, and generally have similar or higher grades within related college courses (Corbett et al., 2008; Xie & Shauman, 2003). While evidence of the closing of the gender gap in STEM achievement at the national level is certainly positive, there is corresponding evidence that gender gaps in STEM-related attitudes remain strong and constitute a primary reason why women are under-represented in many STEM fields. In this study, we distinguish between two types of attitudes: personal attitudes or assessments (such as confidence in STEM skills, interest, and intrinsic value) and perceptions of climate (such as the perceived inclusionary context of a classroom and occupational field). As we discuss below, these are related but distinct social-psychological factors that are among the key mechanisms behind women’s under-representation in STEM fields.
Additionally, it is important to point out that disparities in attitudes are widely considered to be resultant of socialization, stereotypes, and discriminatory interactions (either intentionally or not) that occur consistently throughout females’ lives (Blickenstaff, 2005; Corbett et al., 2008). Research also tends to find that these attitudes matter throughout the pipeline, such that girls’ less favorable attitudes appear first in middle school and high school and subsequently help explain why they are less likely to enter STEM majors in college; yet even among those females who do enter STEM majors, attitudes may continue to be an obstacle and deter persistence to degree, as well as entry into a related occupation (Cech et al., 2011; Xie & Shauman, 2003). Finally, we note that research that focuses specifically on engineering generally finds that attitudinal deterrents are similar (if more pronounced) to those in other STEM fields such as physics and computer science (Cech et al, 2011).
Personal Attitudes
Seminal research by Eccles and her colleagues (Eccles,1994; Eccles, Wigfield, & Schiefele, 1998; Wigfield & Eccles, 2000) seeks to explain women’s under-representation in many STEM fields via an expectancy-value model. This theory posits that expectancies of success, defined as individuals’ beliefs about how well they perform on current and future tasks, as well as their subjective task value, which includes interest or enjoyment and the value that individuals assign to a domain or subject matter, are primary predictors of future choices. The many applications of this model found in the literature offer strong evidence that females exhibit lower self-concept and self-efficacy in their STEM-related abilities and express less enjoyment and value of these fields compared to their male peers (AAUW, 2008; Blickenstaff, 2005; Correll, 2001; Creamer, 2012; Eccles, 1994; Eccles & Wigfield, 2002; Eccles, Wigfield, & Schiefele, 1998; Nagy et al., 2006; Riegle-Crumb et al., 2011).
2001). With regard to engineering in particular, Goodman et al. (2002) found that almost half of females who left the field had A and B averages in their engineering classes. This result is echoed by Borrego et al. (2005), who found that among non-persisters, female engineering majors had higher GPAs than males. Indeed Concannon and Barrow (2010) suggest that female engineering majors’ relatively lower confidence is a result of the fact that they have higher academic standards than male engineering students.
Still other research informed by the Eccles et al. model focuses more intensively on gender disparities in dimensions of subjective task values, such as the low value or utility typically assigned to STEM fields by females compared to males, as well as lower interest in STEM fields (Brainard & Carlin, 1998; Lubinski & Benbow, 2006; Seymour & Hewitt, 1997). For example, Frome et al. (2006) followed a group of approximately 100 high school females who initially expressed aspirations to enter STEM occupations and found that lower intrinsic value placed on math and science was a key factor distinguishing those who did not persist from those who did. Similarly, Lubinski and Benbow (1992; 2006) found that even among the most mathematically-talented youth, females had a lower preference for math than males.
Perceptions of Climate
Beyond personal viewpoints of skills and interest, gender differences in the perceptions individuals hold of STEM fields is another important disparity that may predict subsequent inequality. We distinguish between two such perceptions; the first centers on perceptions of the immediate classroom climate and the other focuses on anticipation of the characteristics of the field as an occupation. For the former, theories of ‘chilly climate’ argue that STEM classrooms are not gender-neutral environments; rather, females often feel uncomfortable and out of place due to experiences related both to their numerical under-representation and the perception that their presence violates traditional gender norms (Constantinople, Cornelius, & Gray, 1988; Hall & Sandler, 1982; Morris & Daniel, 2008; Seymour & Hewitt, 1997). The climate could be characterized by overtly and intentionally alienating acts, such as negative remarks regarding females’ cognitive abilities, or characterized by perhaps less explicit deterrents, such as lack of eye contact made by instructors and male peers, patronizing tones used in interactions, or minimal effort made to include female students in discussions or study groups outside of class (Morris & Daniel, 2008). With regard to engineering in particular, the strongly competitive climate of college courses may be particularly discouraging to women (Goodmen et al., 2002). We note here that while a good deal of the prior literature on chilly climate focuses on postsecondary classrooms, there is also evidence that females perceive advanced math and science high school classes in a similar manner (Gilmartin et al., 2006; Riegle-Crumb et al., 2006).
Beyond actual or expected experiences in the classroom, gender differences in the perceptions of STEM occupations are also important to consider. Prior research suggests that girls often have a very narrow, traditional notion of STEM-related occupations that involves individuals working primarily alone in laboratories, who are intensely dedicated to their profession at the expense of social and other endeavors, and whose work is brilliant and highly esteemed, yet inaccessible to most people and removed from real-world applications (Osborne, Simon, & Collins, 2003). While such a description does not specifically involve gender, it nevertheless has gendered implications, as these values and traits are more consistent with a traditional masculine identity. Research finds that because of a lack of accurate information, females often view STEM occupations in this traditional and quite stereotypic perspective and, consequently, are less likely to aspire or persist to subsequent occupations (Barton, Tan, & Rivet, 2008; Brickhouse & Potter, 2001; Buck, Clark, Leslie-Pelecky, Lu, & Cerda-Lizarraga, 2008; Farland-Smith, 2012; Winn et al., 2011). Regarding engineering in particular, Reyer (2007) found that among high school students involved in an university outreach program, girls had inaccurate perceptions of engineering occupations, for example, as requiring genius levels of expertise.
Current Study
Our study focuses on the first year of implementation of an engineering course in several Texas school districts (following an initial pilot version the previous school year). This two-semester course was designed in a collaborative effort involving university engineering faculty, clinical engineering faculty, and education faculty (Berland, in press). It is an advanced-level science course available to juniors and seniors. The curriculum of the course is challenge-based and utilizes cooperative learning throughout a series of multi-week design challenges. Particular course activities included applying engineering concepts and design to everyday useful products, including a camera and a hair dryer. Additionally, course objectives included highlighting the impact and contributions of engineering innovations to improvement in society and meeting human needs.
In addressing our research questions, we seek to ascertain whether the gendered patterns of enrollment and attitudes in this new high school engineering course mirror those discussed above in the broader literature on STEM inequality. If the patterns are consistent with prior research on engineering and other STEM majors in college, as well as advanced math and science courses in high school, then we would indeed expect to see both lower enrollment and a gender gap in attitudes among those that do choose to enroll. And given the robustness of the patterns described in the literature, it seems unlikely that any disparities in positive attitudes to engineering would be substantially reduced over the course of the year, as they likely represent many years of exposure to negative stereotypes and experiences.
On the other hand, it is also possible that given the newness of this course in the districts in which it rolled out, those who are among the first cohorts of female enrollees may be far from the ‘typical’ female (deCohen & Deterding, 2009). To the extent that they comprise a unique group of females who choose to enter this gender atypical course, their attitudes and perceptions may closely parallel those of their male peers in the course. Additionally, the course emphasizes several factors sometimes shown to be particularly appealing to female students, including group activities and cooperative learning and a focus on the social relevance of engineering, as well as a curriculum designed to be inclusive to diverse rather than traditional interests (Trytten et al., 2004). Consequently, any gender disparities in attitudes observed at the beginning of the year might diminish over time due to these course experiences. Such an argument is consistent with a recent study by Dell et al. (2011) who found that an engineering outreach program for middle school girls, that incorporated similar design aspects, led to an increase in positive attitudes to engineering. To consider these different possibilities, we now turn to discuss our survey design, data collection, and subsequent statistical analyses.
DATA AND RESULTS
We collected student surveys from six schools in three school districts in urban and suburban settings surrounding a large city in Texas that were offering a new high school engineering course in the Fall of 2011. The average student enrollment across these schools was about 2000 students with a standard deviation of approximately 800. The average percentage of students who qualified for free and reduced lunch was 32% with a standard deviation of 30.25. On average, 91% of students in these schools passed the 10th grade state accountability exam in math (standard deviation=7.47). Finally, enrollment in the engineering course ranged from 5 to 83 with a mean of 29.
The project team asked the teachers of the engineering courses at these schools to administer surveys asking students multiple-choice questions about their backgrounds and attitudes. Teachers were given pre-surveys (paper with accompanying scantron forms) and asked to administer them within the first weeks of the Fall 2011 school year in order to capture attitudes before taking the course. Post-surveys were given in the last weeks of Spring 2012 to measure attitudes near completion of the course. All students received consent forms and only those who chose to consent were included in the study, which was approximately 86% of all students enrolled in the courses.1
1
Are female students less likely than male students to enroll in the course?
In response to our first question, we found that female students were indeed under-represented. While females comprised 50% of the student body at each school, the percent female in the course ranged from a low of 6% to a high of 30%. On average, females made up only 14% of engineering students across schools. To examine whether the females that did enroll in the course differed from male students regarding social and academic background characteristics (reported by students on the surveys), we calculated separate descriptive statistics for each gender and performed a t-test to determine statistical significance. As can be seen in Table 1, there were no significant differences between male and female engineering students regarding race or parent education level. Additionally, males and females were equally likely to have taken courses in Pre-calculus and Physics. They also reported comparable grades in math and English. The only notable gender disparity in student background was that females were more likely than males to have a parent who was a scientist or engineer (p value=.05). Overall, the social and academic background of both male and female students was remarkably similar.
Table 1: Background Characteristics of Engineering Students by Gender
Males Females
Mean or Proportion Mean or Proportion
p-value of gender difference
Hispanic 0.20 0.25 0.71
Black 0.10 0.00 0.13
Parent education level 2.80 3.15 0.22
Parent is scientist or engineer 0.30 0.50 0.05
Pre-Calculus 0.85 0.85 0.87
Physics 0.98 1.00 0.37
Math GPA 3.50 3.35 0.29
English GPA 3.34 3.50 0.31
N 153 20
Note: parent education is coded as an ordinal variable measuring the highest degree of both parents with the following categories: high school degree, vocational degree, college degree, or advanced degree. Math and English GPA are ordinal variables ranging from 1 (mostly D’s or below) to 4 (mostly A’s).
Are there gender gaps in attitudes at the beginning of the course?
To assess gender differences in personal attitudes towards engineering, we first constructed three scales to capture critical dimensions of the expectancy-value model discussed above as developed by Eccles and her colleagues (Eccles et al., 1983; Wigfield & Eccles, 1992; Wigfield,, 1994). They include: 1) interest in engineering, 2) intrinsicvalue of engineering, and 3) confidence in engineering skills. Additionally, we constructed two scales to capture positive perceptions of engineering climate: 4) perception of classroom as inclusive and 5) perception of engineering as a progressive field. The former is designed to measure a classroom where students feel supported and comfortable, in contrast to a “chilly climate” discussed earlier. The latter scale is designed to capture an image of engineering occupations that runs counter to stereotypes of the field as abstract and disconnected from real life with inhabitants who are isolated and anti-social.
Interest in engineering is a scale of students’ average level of agreement to the following statements (Cronbach’s alpha=.81): “I wanted to take [Engineering] because I am interested in engineering,” “I am interested in an engineering career,” and “From what I know, engineering is boring”. Categories of response ranged from 1 (strongly disagree) to 5 (strongly agree), and the last item was reverse coded so that a high value would indicate a positive sentiment.2
Intrinsic value of engineering is a scale of students’ average responses to the statement, “For me, being good in engineering is…,” and the question, “Compared to your other activities, how important is it for you to be good at
2
engineering?” (Cronbach’s alpha=0.81). Responses range from 1 (not at all important) to 5 (very important).3
Confidence in engineering is a 5-point scale (Cronbach’s alpha=0.68) of students’ average responses to two questions: “Compared to other students, how well do you expect to do in engineering this year?,” and “I’m certain I can master the skills being taught in my engineering class”.4
Original response categories for the first question ranged from 1 (much worse) to 5 (much better), and for the second question ranged from 1 (strongly disagree) to 5 (strongly agree).
Perception of inclusive classroom is a scale of students’ average level agreement to the statements, “I can relate to the people around me in this class,” “My teacher thinks I could be a good engineer,” “I have a lot in common with the other students in this class,” and “My teacher has high expectations of me” (Cronbach’s alpha=0.81). Response categories ranged from 1 (strongly disagree) to 5 (strongly agree).
Perception of engineeringas a progressive field is a scale of students’ level of agreement to the statements: “Most of the skills learned in engineering would be useful to me outside of this class,” “If I became an engineer, I would expect the same opportunities, pay raises and promotions as my fellow workers,” “Engineering plays an important role in solving society’s problems,” “I would like to be an engineer because it provides more money than most careers,” “I would have no problem finding a job if I had an engineering degree,” and “A career in engineering would leave me time for family and leisure activities” (Cronbach’s alpha=0.63). Response categories ranged from 1(strongly disagree) to 5 (strongly agree).5
To determine the statistical significance of the gender difference in means on each of these five scales, we utilized multi-level mixed regression models where each scale was the dependent variable and gender (coded dichotomously as 1 for female and 0 for male) was the independent variable. The multi-level models estimate standard errors that account for the clustering of students within schools (Rabe-Hesketh & Skrondal, 2008). We note that this more statistically rigorous approach nevertheless yielded comparable results to more traditional independent sample t-tests.6 Additionally, in exploratory models, we added the measures of social and academic background displayed in Table 1 as additional control variables. Doing so did not substantially alter any of the gender differences in outcomes, which is not surprising as males and females had comparable values on all background measures (with exception of more females having a parent that was scientist or engineer). Therefore, we chose to go with more parsimonious models that did not include these other control variables.
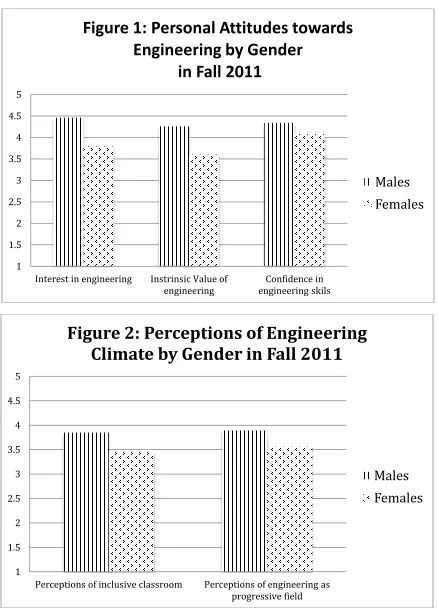
Figure 1 displays means by gender for personal attitudes towards engineering. For interest in engineering, we observe a significant gender difference of .67 (male mean=4.46, female mean=3.79, p<.001). We observe a gap of similar magnitude (difference=.66) for the value students place on engineering, as males in the course place a significantly higher value on this field than females (male mean=4.26, female mean=3.60, p<.001). Interestingly, we see a smaller gender gap (difference=.27) favoring males for confidence in engineering (male mean=4.34, female mean=4.07, p<.05). Clearly students enrolled in the course appear to have quite positive personal attitudes towards engineering (with means close to or above a value of 4 on a 5 point scale), yet there is nevertheless a substantial gender gap.
3
These questions drawn from the Michigan Study of Adolescent and Adult Life Transitions (MSALT) and Wigfield (1994).
4
These questions were adapted from Wigfield (1994) to focus on engineering instead of math or science.
5
The statements used in the social inclusion and progressive perception of engineering scales were taken from the Longitudinal Assessment of Engineering Self-Efficacy (LAESE) (Marra et al. 2009) and the Is Science Me (ISME) survey from the National Science Foundation (Gilmartin et al., 2006)
6
1 1.5 2 2.5 3 3.5 4 4.5 5
Interest in engineering Instrinsic Value of
engineering engineering skils Confidence in
Figure 1: Personal Attitudes towards
Engineering by Gender
in Fall 2011
Males
Females
1 1.5 2 2.5 3 3.5 4 4.5 5
Perceptions of inclusive classroom Perceptions of engineering as progressive field
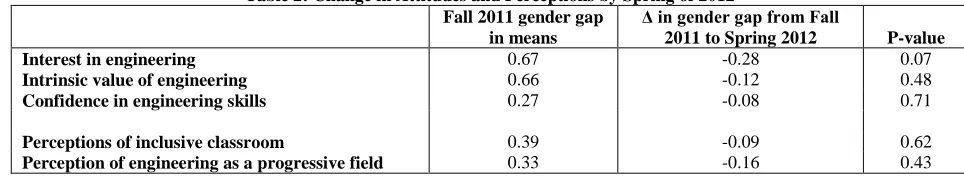
Figure 2: Perceptions of Engineering
Climate by Gender in Fall 2011
Figure 2 displays means separately for each gender for perceptions of engineering climate. We note that males perceive the classroom climate at the beginning of the year as more inclusive than females (male mean=3.84, female mean=3.46, p <.01). Likewise, males have a significantly higher score on the scale measuring perceptions of engineering as a progressive field (male mean=3.89, female mean=3.56, p<.05). Therefore, at the beginning of the school year, we see gender gaps across five different attitude scales.
Do gender gaps in attitudes decrease over the course of the year?
To determine whether gender gaps in attitudes changed from the beginning of the fall semester to the end of the spring semester, we used multi-level models where observations of attitudes are nested within students, which are, in turn, nested within schools; we also allowed the unexplained variance to vary between males and females (Rabe-Hesketh & Skrondal, 2008). Analyses performed with repeated measures ANOVA yielded comparable results to those presented here. As seen in Table 2, the first column indicates the size of the gap at time 1 (displayed in chart form in Figures 1 and 2) and the second column displays the interaction between gender and time, followed by the accompanying p-value. A negative coefficient indicates a decrease in the gender gap (or male advantage) in attitudes from Fall to Spring. While all are negative in direction, none are statistically significant. The only possible exception is found for interest in engineering, where the decline in the male advantage is marginally significant (p=.07). This result is driven by the fact that males’ interest actually moderately declines over the period (fall mean= 4.46, spring mean=3.98), rather than the result of any increase in interest among females (fall mean= 3.79, spring mean=3.61). Additionally, we note that females’ mean scores did not increase on any of the five attitude scales. Overall, the results for our analyses indicate a general stability in the gender disparity in attitudes observed at the beginning of the school year.
Table 2: Change in Attitudes and Perceptions by Spring of 2012
Fall 2011 gender gap in means
Δ in gender gap from Fall
2011 to Spring 2012 P-value
Interest in engineering 0.67 -0.28 0.07
Intrinsic value of engineering 0.66 -0.12 0.48
Confidence in engineering skills 0.27 -0.08 0.71
Perceptions of inclusive classroom 0.39 -0.09 0.62
Perception of engineering as a progressive field 0.33 -0.16 0.43 DISCUSSION AND CONCLUSION
In this paper, we examined gendered patterns within a new high school engineering course offered in several schools in Texas. We found that female students were substantially under-represented in this course, as only 14% of enrollees were female. While these female students were comparable to their male peers on social and academic background characteristics, they nevertheless reported significantly less favorable attitudes towards engineering at the beginning of the school year. Specifically, female students had lower averages than male students on personal attitude scales measuring their interest in engineering, the intrinsic value they placed on engineering, and their confidence in their engineering skills. Additionally, female students perceived the classroom environment as less inclusive in terms of feeling supported by teachers and peers and perceived engineering occupations as less socially progressive (or more stereotypical) than male students. By the end of the school year, none of these gender gaps in attitudes had significantly decreased.
Yet we suggest that our study does have some direct implications for potential remedies to inequality. At the beginning of the year, female students already reported that they felt the classroom was less inclusionary, despite having been present for only a few days. Their responses likely, at least partially, reflect their fears as well as their expectations based on their experiences in previous advanced math and science classes. Armed with the knowledge that their female students feel less included, teachers can proceed proactively to better integrate girls into the classroom. They can also be sure to give positive feedback to help combat the lower confidence that girls feel regarding their engineering skills.
Additionally, we point out that our data was collected during the first year this course was offered (following the pilot year in 2010-2011). Teachers and administrators can actively work to recruit more females into the course in the ensuing years. Furthermore, the state of Texas’s recommended graduation plan now includes four years of science, and engineering is one of the few advanced science courses available after students complete physics. Just as increasing math graduation requirements were at least part of the reason behind the emergence of gender equality in calculus course-taking nationwide (Xie and Shauman, 2003), these increased science requirements may eventually lead to greater female enrollment in engineering. While an initial influx of female students into the course may be driven more by practicality rather than interest, it could nevertheless result in changing the gender composition of the classroom to a more equitable one, and, therefore, one that may feel more comfortable for female students.
ACKNOWLEDGEMENTS
This research was supported by a grant from the National Science Foundation (DUE-0831811, AMD 010), as well as by a grant (5 R24 HD042849, Population Research Center) awarded to the Population Research Center at The University of Texas at Austin by the Eunice Kennedy Shriver National Institute of Health and Child Development. This research has also received support from the grant, 5 T32 HD007081, Training Program in Population Studies, awarded to the Population Research Center at The University of Texas at Austin by the Eunice Kennedy Shriver National Institute of Child Health and Human Development. Opinions reflect those of the authors and do not necessarily reflect those of the granting agencies.
AUTHOR INFORMATION
Catherine Riegle-Crumb, PhD, University of Texas at Austin. Dr. Riegle-Crumb is Assistant Professor of STEM Education, Department of Curriculum and Instruction, and Faculty Research Associate at the Population Research Center at the University of Texas at Austin. Her research interests focus on gender and racial/ethnic inequality in educational experiences and attainment. As a sociologist of education, she is particularly interested in the role of social contexts, including friendships, schools, and communities, in increasing or ameliorating educational disparities. Her research also focuses on the complex intersection between gender and race/ethnicity with regard to educational inequality. E-mail: [email protected] (Corresponding author)
Chelsea Moore, MA, University of Texas at Austin. Ms. Moore is a Ph.D. candidate in Sociology at the University of Texas at Austin. She received her B.S. in Sociology at Texas A&M University and her M.A. in Sociology at the University of Texas at Austin. Her research interests include gender, race-ethnic, and socioeconomic stratification in science, technology, engineering, and mathematics education and career formation. E-mail: [email protected]
REFERENCES
1. American Association of University Women Educational Foundation. (2008). Where the girls are: The facts about gender equity in education. Washington, DC: AAUW Educational Foundation.
2. Barton, A. C., Tan, E., & Rivet, A. (2008). Creating hybrid spaces for engaging school science among urban middle school girls. American Educational Research Journal, 45(1), 68-103.
4. Blickenstaff, J. C. (2005). Women and science careers: leaky pipeline or gender filter?. Gender and Education, 17(4), 369-386.
5. Borrego, M. J., Padilla, M. A., Zhang, G., Ohland, M. W., & Anderson, T. J. (2005, October). Graduation rates, grade-point average, and changes of major of female and minority students entering engineering. In Frontiers in Education, 2005. FIE'05. Proceedings 35th Annual Conference (pp. T3D-1). IEEE.
6. Brainard, S. G., & Carlin, L. (1998). A six-year longitudinal study of undergraduate women in engineering and science. Journal Of Engineering Education-Washington, 87, 369-376.
7. Brickhouse, N. W., & Potter, J. T. (2001). Young women's scientific identity formation in an urban context. Journal of research in science teaching, 38(8), 965-980.
8. Buck, G. A., Clark, V. L. P., Leslie‐Pelecky, D., Lu, Y., & Cerda‐Lizarraga, P. (2007). Examining the cognitive processes used by adolescent girls and women scientists in identifying science role models: A feminist approach. Science Education,92(4), 688-707.
9. Cech, E., Rubineau, B., Silbey, S., & Seron, C. (2011). Professional role confidence and gendered persistence in engineering. American Sociological Review, 76(5), 641-666.
10. Concannon, J. P., & Barrow, L. H. (2010). Men’s and women’s intentions to persist in undergraduate engineering degree programs. Journal of Science Education and Technology, 19(2), 133-145.
11. Constantinople, A., Cornelius, R., & Gray, J. (1988). The chilly climate: Fact or artifact?. The Journal of Higher Education, 527-550.
12. Corbett, Christianne, Catherine Hill, and Andresse St. Rose. (2008). Where the Girls Are: The Facts about Gender Equity in Education. AAUW Educational Foundation, Washington, D.C.
13. Correll, S. J. (2001). Gender and the Career Choice Process: The Role of Biased Self‐Assessments1. American Journal of Sociology, 106(6), 1691-1730.
14. Creamer, E. G. (2012). Effects Of Numeric Representation Of Women On Interest In Engineering As A Career. American Journal of Engineering Education (AJEE), 3(1), 1-12.
15. de Cohen, C. C., & Deterding, N. (2009). Widening the net: National estimates of gender disparities in engineering. Journal of Engineering Education, 98, 211–226.
16. Dell, Christman, and Garrick (2011). Assessment of an engineering technology outreach program for 4th-7th grade girls. American Journal of Engineering Education (2) 1: 19-34.
17. Eccles, J. S. (1983). Expectancies, values, and academic behaviors. In J.T. Spence (Ed.), The development of achievement motivation (pp. 283-331). Greenwich, CT: JAI.
18. Eccles, J.S. (1994). Understanding Women's Educational and Occupational Choices: Applying the Eccles et al. Model of Achievement-Related Choices. Psychology of Women Quarterly,18(4),585-609.
19. Eccles, J. S., & Wigfield, A. (2002). Motivational beliefs, values, and goals. Annual review of psychology, 53(1), 109-132.
20. Eccles, J. S., Wigfield, A., & Schiefele, U. (1998). Motivation. In N. Eisen- berg (Ed.), Handbook of child psychology, Vol. 3 (5th ed., pp. 1017–1095). New York: Wiley.
21. Farland-Smith, D. (2012). Personal and Social Interactions Between Young Girls and Scientists: Examining Critical Aspects for Identity Construction. Journal of Science Teacher Education, 1-18.
22. Frome, P. M., Alfeld, C. J., Eccles, J. S., & Barber, B. L. (2006). Why don't they want a male-dominated job? An investigation of young women who changed their occupational aspirations. Educational Research and Evaluation, 12(4), 359-372.
23. Gilmartin, S. K., Li, E., & Aschbacher, P. (2006). The Relationship Between Interest in Physical Science/engineering, Science Class Experiences, and Family Contexts: Variations by Gender and
Race/ethnicity among Secondary Students. Journal of Women and Minorities in Science and Engineering, 12, 179-207.
24. Goodman, I. F., Cunningham, C. M., & Lachapelle, C. (2002). Final report of the Women’ s Experiences in College Engineering (WECE) Project: Executive summary. Retrieved December 22, 2005, from
http://www.grginc.com
25. Hall, R. M., & Sandler, B. R. (1982). The Classroom Climate: A Chilly One for Women?.
26. Hirsch, L. S., Gibbons, S. J., Kimmel, H., Rockland, R., & Bloom, J. (2003, November). High school students attitudes to and knowledge about engineering. In Frontiers in Education Conference (Vol. 2, pp. 2-7). STIPES.
28. Lubinski, D., & Benbow, C. P. (1992). Gender differences in abilities and preferences among the gifted: Implications for the math-science pipeline. Current Directions in Psychological Science, 1(2), 61-66. 29. Lubinski, D., & Benbow, C. P. (2006). Study of mathematically precocious youth after 35 years:
Uncovering antecedents for the development of math-science expertise. Perspectives on Psychological Science, 1(4), 316-345.
30. Marra, R. M., Rodgers, K. A., Shen, D., & Bogue, B. (2009). Women engineering students and self-efficacy: A multi-year, multi-institution study of women engineering student self-efficacy. Journal of Engineering Education, 98(1), 27-38.
31. Morris, L. K., & Daniel, L. G. (2008). Perceptions of a chilly climate: Differences in traditional and non-traditional majors for women. Research in Higher Education, 49(3), 256-273.
32. Nagy, G., Trautwein, U., Baumert, J., Koller, O., & Garrett, J. (2006). Gender and course-selection in upper secondary education: Effects of academic self-concept and intrinsic value. Educational Research and Evaluation, 12(4), 323-345.
33. Osborne, J., Simon, S., & Collins, S. (2003). Attitudes towards science: a review of the literature and its implications. International journal of science education, 25(9), 1049-1079.
34. Rabe-Hesketh, S., & Skrondal, A. (2008). Multilevel and longitudinal modeling using Stata. STATA press. 35. Reyer, J. (2007). Influence of high school students’ perceptions on their preparation for engineering.
Proceedings of the 37th ASEE/IEEE Frontiers in Education Conference, Milwaukee, Wisconsin. 36. Riegle-Crumb, C. (2006). The Path through Math: Course Sequences and Academic Performance at the
Intersection of Race-Ethnicity and Gender." AmericanJournal of Education,113(1), 101-122.
37. Riegle‐Crumb, C., Moore, C., & Ramos‐Wada, A. (2011). Who wants to have a career in science or math? Exploring adolescents' future aspirations by gender and race/ethnicity. Science Education, 95(3), 458-476. 38. Riegle-Crumb, C., King, B., Grodsky, E., & Muller, C. (2012). The More Things Change, the More They
Stay the Same? Prior Achievement Fails to Explain Gender Inequality in Entry Into STEM College Majors Over Time. American Educational Research Journal,49(6),1048-1073
39. Seymour, E. and Hewitt, N. M. (1997). Talking About Leaving: Why Undergraduates Leave the Sciences. Boulder, CO: Westview Press.
40. Snyder, T.D., and Dillow, S.A. (2012). Digest of Education Statistics 2011 (NCES 2012-001). National Center for Education Statistics, Institute of Education Sciences, U.S. Department of Education.
Washington, DC.
41. Trytten, D.A., R.L. Shehab, T.R. Rhoads, M.J. Fleener, B.J. Harris, A. Reynolds, S.E. Walden, S.K. Moore-Furneaux, E. Kvach, and K.R. Warram. (2004). 'Inviteful' engineering: Student perceptions of industrial engineering. Pp. 8409-8419.
42. U.S. Department of Education, National Center for Education Statistics (NCES). (2012). Digest of Education Statistics. 2012-001.
43. Wigfield, A. (1994). Expectancy-Value Theory of Achievement Motivation: A Developmental Perspective. Educational Psychology Review,6(1), 49-78.
44. Wigfield, A., & Eccles, J. S. (1992). The development of achievement task values: A theoretical analysis. Developmental review, 12(3), 265-310.
45. Wigfield, A., & Eccles, J. S. (2000). Expectancy–value theory of achievement motivation. Contemporary educational psychology, 25(1), 68-81.
46. Winn, G., Hensel, R., Curtis, R., Taylor, L. M., & Cilento, G. (2011). An Integrated Approach To
Recruiting And Retaining Appalachian Engineering Students. American Journal of Engineering Education (AJEE), 2(2), 1-16.