Simulation Model for Stochastic Analysis
and Performance Evaluation of Steam
Generator System of a Thermal Power
Plant
Yogesh Vora
Associate Professor Mechanical Engineering , Government Engineering College Surat– 395001, Gujarat, India
E–mail: [email protected]
M B Patel
Hasmukh Goswami College of Engineering, Vehlal, Dahegam, Gujarat, India
P C Tewari
Dept of Mechanical Engineering ,National Institute of Technology Kurukshetra – 136119, Haryana, India
.
Abstract:
This paper presents the stochastic analysis and performance evaluation of turbo generator system of a thermal plant by making the use of performance evaluation using probabilistic approach. The steam generator system of thermal power plant under the research study consists mainly sub-systems boiler, super heater and reheater arranged in series with two feasible states: working and failed. Failure and repair rates for all the sub-systems are assumed to be constant. Initially transition diagram representing the operational behavior is drawn and then problem formulation is done using Markov approach. Based on the data collection and its analysis for thermal Power Plant, Performance matrix for each subsystem is also developed. Then from these results, availability matrices and graphs of failure and repair rates for maximum availability of each system is analysed and then condition based maintenance decisions are decided.
Key words: Transition diagram, Markov approach, availability, Performance matrix, thermal power plant and
Maintenance decisions.
1. Introduction
After the globalization and new economic era, power industries are exposed to both – local and global competitions. To maintain the quality of power and continuous uninterrupted power supply, such industries requires high level of automation and use of sophisticated machineries/machines and which needs huge investments. Also the cost of new power plants are very high .In thermal power plant, sudden stoppage of the machines/ equipments results into the stoppage of entire plant and finally results in low productivity and loss in profit.
Some of the facts related to existing thermal power plants: The facts related to existing thermal power plantsare as below:
1. Presently, most of the power plants are operating with low efficiency.
2. Moreover, the electricity generated is less than the installed capacity due to non-availability of plant machines and equipments full time.
4 The main reason for poor capacity utilization is excessive equipment downtime due to maintenance, which is about 25-30 % in power plants and the downtime costs are about Rs.30 Lakhs per day for a power plant of 210 MW Unit.
5 Non-availability of trained manpower in maintenance area.
6 Moreover, the cost of installation of new power plant is very high.
7 It is required to run the plant with the highest possible availability by improving reliability of each elements of thermal Power Plant.
The highly reliable system has recently been recognized with increasing automation and use of highly complex systems. According to Lieberman (1973) , the probabilistic analysis of the system under given operative conditions is helpful in the design modification, for minimum failure of the system and thus to optimise the system working. Goel and Shrivastava (1991) has ignored the dependent structure for failure and repair times for repairable systems and the above-mentioned authors considered a correlated structure for the problem and obtained some reliability measures. Other papers in this area are Goel et al. (1994) and Goel et al. (1995). In this paper, three-unit systems with a repair facility as considered. Since for a large-scale and complex network generally requires exponential time for the exact calculation of the reliability, a variety of alternative methods to estimate the network reliability using Markov death-birth process have been proposed.
Based on different assumptions, availability measures for a two-unit system with repair facility were obtained by several researchers. Rajamanickam et al. (1997) have assumed that the failure times and repair times for the components are independently distributed. Corder (1976) states that the raw material is processed through various equipment to get the final product in a process plant . The production suffers due to sudden failure of any unit even for a small time period. The poor design, poor maintenance, lack of communication and coordination, defective planning, lack of skills and scarcity of inventories are main causes of failure. Thus, highly skilled maintenance personnel are required to run a process plant. A thermal power plant is a complex engineering system comprising of various systems: Coal handling, Steam generators, Flue gas and air, Cooling Water, Ash handling, Power Generation, Feed water and Condensate system connected either in series or in parallel or in combination of both (Arora and Kumar (1993) and Arora et al. (1995)). it is required to run the various subsystem of plant failure free for, a long period for maximum availability power generation. These subsystems are subjected to random failure and after repairs/replacement can be taken back into use. The operating conditions and repair policies used are the key factors for sub-systems and their components. The Performance analysis can be used as tool to ensure the maximise level of system availability.
Several mathematical models are developed by Dhillon (1983) and Balaguruswamy (1984) to predict the availability. Most of these models, Krishnamurthi et al. (1996) and Sahner (1996), are based on the Markovian approach with the failure and the repair rates are constant assumption. Now a days, reliability analysis techniques have been accepted as standard tools for the planning and operation of complex thermal power plants. Due to increasing complexity and its components behaviors, it is becoming more and more difficult to model and analyze using existing conventional tools. Markov Chains (MCs) have proven as effective tool for modeling complex dynamic component behavior.
The traditional Markov and Markov cut set approaches used by Stanley and Malhoit (2001) gives exact solutions for exponential failure and repair rates of system components . This is true for systems performing critical applications. The usage of such tools becomes therefore crucial.
1.1 Organization of the paper
The paper is organized systematically as below:
The section 2 describes the steam generation system of thermal plant, system description, assumptions and notations for drawing the transition diagram. Section 3 discusses the development of simulation model, its analysis with Markov approach. Section 4 describes the performance evaluation of the system. Section 5 and 6 consists of results and conclusion of developed simulation model.
2. System Description
Steam Generator Unit and Its Components
of thermal power plant is the steam and power generation (TG) unit. The optimization of each unit in relation to one another is required to make the power plant more profitable and viable for operation. The effectiveness of a power plant is given by the following equation and mainly affected by reliability, availability and maintainability of the plant and its capability to perform as needed/required.
Effectiveness of a power plant = Reliability X Availability X Maintainability
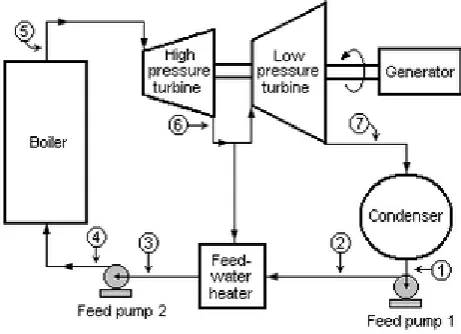
The paper describes a probabilistic model to analyse system performance and to achieve the maximum availability. The steam from boiler is supplied to steam turbine through super heater and generator is coupled to turbine for power generation and then back boiler through re-heater and condenser unit. Thus the steam and power generation unit is the main and most important part of a thermal plant.
2.1. Unit Description
A typical the steam and power generation unit consists of a number of components or subsystems arranged Logically either in series or in parallel in most cases. The performance of the system depends on the performance of its subsystems and on the configuration of the system. The steam and power generation unit consists of following subsystems:
(i) Subsystem A consists of boiler. It is single unit arranged in series. Failure of this unit causes the complete failure of the TG system.
(ii) Subsystem B consists of super heater arranged in series. Failure of this unit causes the complete failure of the TG system.
(iii) Subsystem C consists of re-heater arranged in series. Failure of this unit causes the complete failure of the TG system.
Figure 1 Various systems of thermal power plant
2.1 Assumptions for Model Development and System State Transition Diagram
For the development of the probabilistic model, the following assumptions are used:
1. Failure/repair rates are constant over time and statistically independent. (Kumar et al. (2007). 2. A repaired unit is as good as new (performance point of view) for a specified duration.
3. Service includes repair and/or replacement, as given by Khanduja et al. (2008) and Sufficient repair facilities are available, as given by Srinath (1994).
4. System failure/repair follows the exponential distribution, as stated by Gupta et al. (2009B).and at any given time, the system is either in operating state or in the failed state, as assumed by Gupta et al. (2009A)
The transition diagram of steam generation unit is shown below in figure 2.
λ2 λ3
φ 3
φ 2
φ 1 λ1
φ 1 λ1
Figure 2 Transition diagram of steam generation unit
2.2. Symbols and Nomenclature
The symbols and notations associated with the transition diagram are as follows; : Indicates the system is in full working state.
: Indicates the system is in failed state.
A,B,C : Represent full working states of subsystems.
F 1 : Denote that the subsystem F is working on standby unit. a,b,c : Represent failed states of subsystems.
P 0 (t) :Probability of the system working with full capacity at time 't'
P 1 (t) : Probability of the system in cold standby state.
P 2 (t) to P 4 (t) : Probability of the system in failed state.
φi , i=1-3 : Mean failure rates of A,B,C,D elements respectively.
λ I , i=1-3 : Mean repair rates of A,B,C,D elements respectively.
d/dt : Represents the derivative with respect to time (t). A v. : Steady state availability of the system.
3.System simulation modeling
The prediction/calculation of reliability of a system with each element exhibiting failures and involving repair/standby operations is complicated. In such cases, the use of Markov model technique which has much appeal and works well when failure rates and repair rates are constant.
The simulation model for steam generation system has been developed for making the stochastic analysis and performance evaluation using Markov concept. Formulation is carried out using the joint probability functions based on the transition diagram. These probabilities are mutually exclusive and provide the scope to implement Markovian approach. The failure and repair rates of the different subsystems are used as standard input information to the model. The present performance evaluation is concerned with a discrete-state continuous-time model, is called a Markov process. Let the probability of n occurrences in time t be denoted by Pn (t), i.e.
Probability (X = n, t) = Pn ( t ) (n = 0, 1, 2 . . .).
According to Markov if P0(t) represent the probability of zero occurrences in time t. The probability of
zero occurrences in time (t + ∆ t) is given by Equation (Eq.). 1, i.e.
P0(t + Δt) = ( 1 - λ.Δt) P0 t (1)
Similarly P1(t + Δt) = (φ. Δt) P0 t + ( 1 - λ. Δt) P1 t (2)
The Eq. (2) shows the probability of one occurrence in time (t + ∆ t) and is composed of two parts, mainly, (a) probability of zero occurrences in time t multiplied by the probability of one occurrence in the interval ∆t and (b) the probability of one occurrence in time t multiplied by the probability of no occurrences in the time interval ∆t, as stated by Srinath (2005).Then simplifying and putting ∆ t → 0, one gets ,
ABc AbC
ABC
( Ф) P0 (t) = λ. P0 (t ) (3)
Using the concept used in Eq. (3) and various probability considerations, the following differential equations associated with the transition diagram of steam and turbo-generator system are formed, as described by Kumar et al. (2007).
Pi (t) + Σ(φi P0 )(t ) = Σλj .P k (t ) (4)
For m=1 i=2 and j=0 respectively; m=2 i=3 and j=0 respectively; m=3 i=4 and j=0 respectively;
With the initial condition P0 (0) = 1 and zero otherwise.
Since any thermal plant is a process industry where raw material is processed through various subsystems continuously till the final product is obtained. Then, according to Arora et al. (1997), to get the long run availability of the system i.e. steady state, put derivative of all probability equal to zero, in to differential Eq. (5-7)
i.e. P0
P1 =( φ1 / λ1 ) P0 P2 =( φ2 / λ2 ) P0 P3 =( φ3 / λ3 ) P0
Steady State Availability
The steady state availability of Steam and power generation system may be obtained as summation of all working state's probabilities and failed states equals to 1:
i = 3 i.e. Σ Pi = 1
i = 1
Therefore putting the values of P 0 –P3 and solving, one gets
P0 + P1 + P2 + P3 = 1 (5)
Av = P0 = 1 / ((1 + (φ1 / λ1) + (φ2 / λ2) + (φ3 / λ3) ) (6)
Equation 6 represents the steady state availability simulation model of the of steam and power generation system.
4. Performance Evaluation
The performance of steam and power generation system of thermal power plant is mainly affected by the failure and repair rates of each subsystem. The developed model includes all possible states of nature, that is, failure events ( φi ) and the identification of all the courses of action, i.e. repair priorities ( λ i). From maintenance
history sheet of steam and power generation system , appropriate failure and repair rates of all subsystems are taken and performance matrices (availability values) are prepared using system availability simulation model (Av.).Performance evaluation forms the foundation for all other performance improvement activities (e.g. Solution design and development, implementation and analysis). The simulation model is used to predict the availability/performance of steam and power generation system for known input values of failure and repair rates of its subsystems. A table 1-3 represents the availability matrices for various subsystems of the steam and power generation system. These matrices simply reveal the various availability levels for different combinations of failure and repair rates/priorities, which further helps in maintenance decisions. These availability matrices are then plotted and shown in Figure 2-7. On the basis of analysis made, the best possible combinations (φ, λ) may be selected.
5. Results and Discussion
The performance of each subsystem is analyzed using the developed model. On the basis of availability values as given in Tables 1-3, the following observations are made, which reveals the effect of failure and repair rates of various subsystems on the availability of steam and power generation system.
Subsystem A: boiler
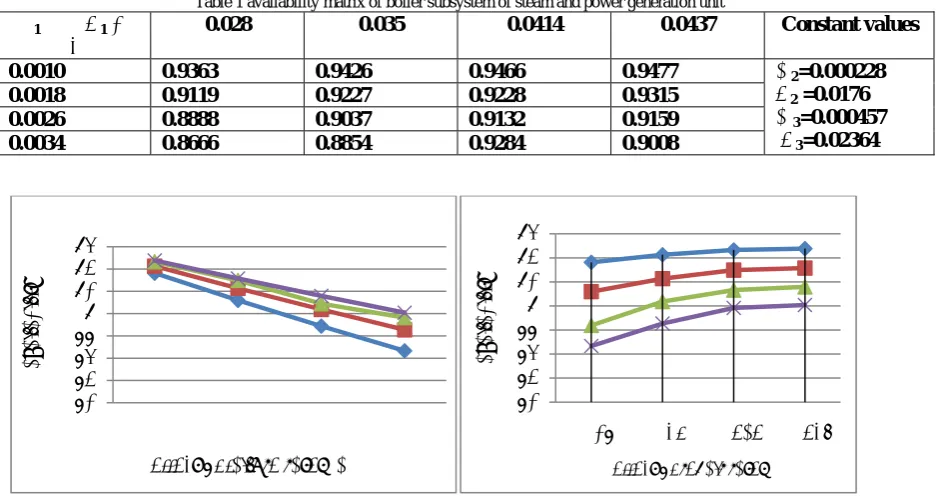
(TG) unit of the thermal power plant. It is observed that for some known values of failure / repair rates of super heater and re-heater as failure rate of boiler increases from 0.0010 (once in 1000 hrs) to 0.0034 (34 in 10000 hrs), the unit availability decreases by only 6.97%. Similarly as repair rate of boiler increases from 0.028 (28 in 1000 hrs) to 0.0437 (437 in 10000 hrs), the unit availability increases by about 1.14%.
Table 1 availability matrix of boiler subsystem of steam and power generation unit Φ1 λ 1 →
↓
0.028 0.035 0.0414 0.0437 Constant values
0.0010 0.9363 0.9426 0.9466 0.9477 φ 2=0.000228
λ 2 =0.0176
φ 3=0.000457
λ 3=0.02364 0.0018 0.9119 0.9227 0.9228 0.9315
0.0026 0.8888 0.9037 0.9132 0.9159 0.0034 0.8666 0.8854 0.9284 0.9008
Figure 2 Effect of failure rate on availability Figure 3 Effect of repair rate on availability
Subsystem B: super heater
Table 2 and fig 4-5 reveal the effect of failure and repair rates of super heater subsystem on the availability of steam generation system on TG generation system of the power plant. Super heater tube puncture and leakage are the most common reasons of failure that causes sudden stoppage of the complete power generation (TG) unit of the thermal power plant. It is observed that for some known values of failure / repair rates of boiler and re-heater as failure rate of increases from 0.00010 (1 failures in 10000 hrs) to 0.000228 (228 failures in 1000000 hrs), the unit availability decreases by only 0.83 %. Similarly as repair rate of super-heater increases from 0.014 (14 in 1000 hrs) to 0.023 (23 in 1000 hrs), the unit availability increases by about 0.26 % only.
Table 2 availability matrix of super heater subsystem of steam and power generation unit
Φ2 λ 2 →
↓ 0.014 0.017 0.020 0.023 Constant values
0.00010 0.9573 0.9585 0.9593 0.9599 φ 1=0.000685
λ 1 =0.03795
φ 3=0.000457
λ 3=0.02364
0.00015 0.9541 0.9558 0.9570 0.9583
0.00020 0.9509 0.9531 0.9547 0.9559
0.000228 0.9490 0.9516 0.9535 0.9548
0.82 0.84 0.86 0.88 0.9 0.92 0.94 0.96
availability
effect of failure rates (φ)
0.82 0.84 0.86 0.88 0.9 0.92 0.94 0.96
0.028 0.035 0.0414 0.0437
availability
Figure 4 Effect of failure rate on availability Figure 5 Effect of repair rate on availability
Subsystem C: Re-heater
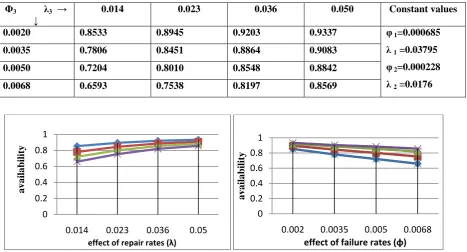
Table 3 and fig 6-7 reveal the effect of failure and repair rates of re-heater subsystem on the availability of steam generation system on TG generation system of the power plant. Re-heater tube puncture and leakage are the most common reasons of failure that causes sudden stoppage of the complete power generation (TG) unit of the thermal power plant. It is observed that for some known values of failure / repair rates of boiler and super-heater as failure rate of re-heater increases from 0.0020 (20 failures in 10000 hrs) to 0.0068 (68 in 10000 hrs), the unit availability decreases by 19.4 %. Similarly as repair rate of turbine increases from 0.014 (14 in 1000 hrs) to 0.050 (5 in 100 hrs), the unit availability increases by about 8.04 %.
Table 3 availability matrix of re-heater subsystem of steam and power generation unit
Φ3 λ3 →
↓ 0.014 0.023 0.036 0.050 Constant values
0.0020 0.8533 0.8945 0.9203 0.9337 φ 1=0.000685
λ 1 =0.03795 φ 2=0.000228 λ 2 =0.0176 0.0035 0.7806 0.8451 0.8864 0.9083
0.0050 0.7204 0.8010 0.8548 0.8842
0.0068 0.6593 0.7538 0.8197 0.8569
Figure 6 Effect of failure rate on availability Figure 7 Effect of repair rate on availability
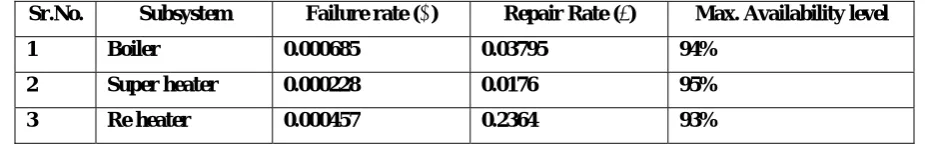
Table 4 shows the optimum values of failure / repair rates of boiler, super heater and re-heater subsystem of steam and power generation unit. The values of maximum availability and related failure / repair rates of subsystemsare given in Table 4.
0.942 0.944 0.946 0.9480.95 0.952 0.954 0.956 0.9580.96 0.962
0.0001 0.00015 0.0002 0.000228
availability
effect of failure rates (φ)
0 0.2 0.4 0.6 0.8 1
0.014 0.023 0.036 0.05
a
v
a
ila
bility
effect of repair rates (λ)
0 0.2 0.4 0.6 0.8 1
0.002 0.0035 0.005 0.0068
a
v
a
ila
bility
effect of failure rates (φ)
0.94 0.945 0.95 0.955 0.96 0.965
0.014 0.017 0.02 0.023
availability
Table 4 optimum values of failure / repair rates of subsystem of steam and power generation unit
Sr.No. Subsystem Failure rate (φ) Repair Rate (λ) Max. Availability level
1 Boiler 0.000685 0.03795 94%
2 Super heater 0.000228 0.0176 95%
3 Re heater 0.000457 0.2364 93%
6. Conclusion
The model is effectively used for evaluation of performance of various sub-systems of steam and power generation system, which further helps in maintenance decisions. The system availability has been excellent, mainly due to the low failure rates and supported by the extra ordinary state of the art repair facilities and well trained highly experienced skilled manpower/maintenance personnel. It can be concluded from Tables 1-3, that as failure rate increases, the availability decreases and as repair rate increases, the availability of the system increases. The expression 6 depicts the availability simulation model, which further helps in analysis and evaluating the performance of various subsystems of steam generation system of thermal power plant. Performance matrices as given in Table 1- 4 and Figures 2-7 clearly shows that re-heater subsystem is most critical subsystem as far as maintenance is concerned and required immediate attention, as the effect of its failure rates on the system availability is much higher (19.4 %) than that of super heater and boiler subsystems. Further, super heater subsystem is the least critical, as the effect of its failure rates on the system availability is very less (0.83 % only).These results are definitely very much useful to the plant management for the availability analysis of steam generation system of a thermal power plant.
Moreover large no. of failures takes due to improper design and overstressing of components .This can be avoided by improving the existing components design and selecting high strength high temperature resistance materials for higher performance. It can be said that these will reduces failure rates for various sub-systems performance and increases on the availability of steam generation system of the power plant to accomplish the goal of sufficiently high performance. The unit performance can be also being improved using redundancy technique.
References
[1] Arora, N., & Kumar, D. (1997). Availability analysis of steam and power generation system in thermal power plant. Micro electron Reliability, 37(5), 95-99.
[2] Balaguruswamy, E. (1984). Reliability engineering. New Delhi: Tata McGraw Hill.
[3] Barabady, J., & Kumar, U. (2007). Availability allocation through importance measures. International Journal of Quality and Reliability Management, 24(6), 643-657.
[4] Beounes, C. et al. (1993). SURF-2: A program for dependability evaluation of complex hardware and software systems. Paper presented at 23rd int. symp. on fault-tolerant computing. Toulouse, France.
[5] Blischke, W. R., & Murthy, D. N. P. (2003). Case Studies in Reliability and Maintenance. USA: Wiley.
[6] Butler, R. (1986). The SURE reliability analysis program. Paper presented at the AIAA guidance, navigation and control conference, Williamsburg, VA.
[7] Ciardo, G., Muppala, J., & Trivedi, K. (1989). SPNP: Stochastic Petri Net Package. Paper presented at the 3rd Int. Workshop on petri nets and performance models, Kyoto, Japan.
[8] Dhillon, B. S. (1983). Reliability engineering in systems design and operation. New York: Van Nostrand-Reinhold.
[9] Gupta, S., Tewari, P. C., & Sharma, A. K. (2008a). Performance modeling and decision support system of feed water unit of a thermal power plant. South African Journal of Industrial Engineering, 19(2), 125-134.
[10] Gupta, S., Tewari, P. C., & Sharma, A. K. (2009a). Availability simulation model and performance analysis of coal handling unit a typical thermal power plant. South African Journal of Industrial Engineering, 20(1), 159-171.
[11] Gupta, S., Tewari, P. C., & Sharma, A. K. (2009b). Reliability and availability analysis of ash handling unit of a steam thermal power plant. South African Journal of Industrial Engineering, 20(1), 147-158.
[12] Khanduja, R., Tewari, P. C., & Kumar, D. (2008). Availability analysis of bleaching system of paper plant. Journal of Industrial Engineering, Udyog Pragati, N.I.T.I.E. Mumbai (India), 32(1), 24-29.
[13] Koren, J. M., & Gaertner, J. (1987). CAFTA: a fault tree analysis tool designed for PSA. Paper presented at the Probabilistic safety assessment and risk management: PSA, Zurich, Switzerland.
[14] Krishnamurthi, G., Gupta, A., & Somani, A.K. (1996). The HIMAP modeling environment. Paper presented at the 9th International conference on parallel and distributed computing systems: Dijon, France.
[15] Kumar, D., & Pandey, P. C. (1993). Maintenance planning and resource allocation in urea fertilizer plant. Quality and reliability Engineering International Journal, 9, 411-423.
[16] Kumar, S., Kumar, D., & Mehta, N. P. (1996). Behavioral analysis of shell gasification and carbon recovery process in urea fertilizer plant. Microelectron Reliability, 36 (5), 671-673.
[17] Kumar, S., Kumar, D., & Mehta, N. P. (1999). Maintenance management for ammonia synthesis system in a urea fertilizer plant. International Journal of Management and System (IJOMAS), 15(3), 211-214
[19] Kumar, S., Tewari, P. C., & Kumar, S. (2007). Performance modeling and simulated availability of shell gasification and carbon recovery system of urea plant. Paper presented at the 16 th IASTED International Conference held, Spain.
[20] Kumar, S., Tewari, P. C., & Sharma, R. (2007). Simulated availability of Co 2 cooling system in a fertilizer plant. Industrial Engineering Journal (Indian Institution of Industrial Engineering, Mumbai), 36(10), 19-23.
[21] Lim, T. J., & Chang, H. K. (2000). Analysis of system reliability with dependent repair models. IEEE Trans Reliab, 49(2), 153–62.
[22] Malhotra, M., & Trivedi, K. S. (1994). Power-hierarchy of dependability-model types. IEEE Transactions on Reliabilit, 43(3), 493–502.
[23] Mishra, R C & Pathak K, “Maintenance Engineering and Management”, Prentice Hall & India Pvt Ltd. New Delhi, 2002 [24] Raje, D. V., Olaniya, R. S., Wakhare, P. D., & Deshpande, A. W. (2000). Availability assessment of a two-unit stand-by
pumping system. Reliability Engineering and System Safety, 68, 269–274.
[25] Sahner, R. A., & Trivedi, K. S. (1987). Reliability modeling using SHARPE. IEEE Trans Reliability, 36 (2), 186–193. [26] Somani, A. K., Sharma, T., & Nguyen, P. H. (1994). Reliability computation of systems with latent-failures and
monitoring. Paper presented at the 1994 annual reliability and maintainability symposium.
[27] Srinath, L. S. (1994). Reliability Engineering. 3 rd edition, New Delhi, India. East-West Press Pvt. Ltd. [28] Wolstenholme, L. C. (1999). Reliability modeling–a statistical approach. Chapman & Hall; CRC.