R E S E A R C H A R T I C L E
Open Access
Design and validation of a food frequency
questionnaire (FFQ) for the nutritional
evaluation of food intake in the Peruvian
Amazon
María García Rodríguez
*, Manuel Romero Saldaña, José Manuel Alcaide Leyva, Rafael Moreno Rojas and
Guillermo Molina Recio
Abstract
Background:Food frequency questionnaires (FFQs) are dietary surveys widely used in studies of nutritional epidemiology because they are inexpensive, easy to complete and provide significant information on dietary intake over a long period of time. FFQs should be written specifically for each study group since diet may be influenced by ethnicity, culture, economic status and environmental factors. The aim of the authors on this work was to design and validate a food frequency questionnaire for the Peruvian Amazon population.
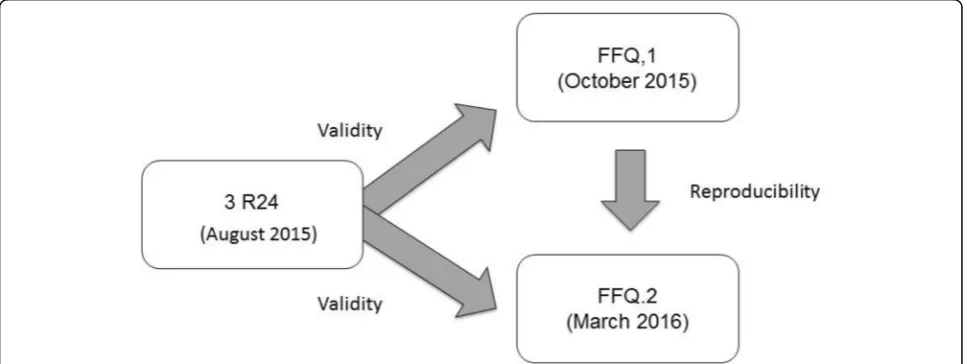
Methods:Three hundred three individuals were selected and completed three 24-h recalls (R24). Two FFQs were conducted on two different occasions (FFQ.1 and FFQ.2). The validity of the FFQ was evaluated by comparing the relationship between the average daily nutrient intake estimated by the FFQs and that obtained by the three R24. The reproducibility was measured by comparing the mean nutrient intake of the two FFQs carried out. The correlations were assessed using the Pearson correlation coefficient, the intraclass correlation coefficient (ICC), the Lin correlation coefficient (CCC) and the Bland–Altman plot.
Results:The results obtained to establish the validity showed a high correlation, with an average Pearson’s correlation coefficient of 0.70, a CCI of 0.65 and a CCC of 0.60. Approximately 60% of the nutrients had a CCC above 0.60. In terms of reproducibility, better results were obtained, with an average Pearson’s correlation coefficient of 0.67, 0.64 for CCI and 0.58 for CCC.
Conclusions:The correlation coefficients show good validity and reproducibility, and therefore, the FFQ we have developed may be considered a useful and valid tool to estimate the dietary intake of the Peruvian Amazon population.
Keywords:Food frequency questionnaire, Dietary intake, Peruvian Amazon, Nutritional epidemiology
Background
Dietary intake is one of the determining factors in the development of chronic diseases. Unlike other habits, it is a complex value to measure because people are rarely able to discriminate exactly what and how much they eat [1, 2]. In addition, an inaccurate dietary assessment can often be a major obstacle to understand the impact on the risk of developing diet-related diseases [2].
A range of different tools, from 24-h recalls (R24) or dietary diaries to food frequency questionnaires (FFQ), are used nowadays to measure dietary intakes. FFQs are the most commonly employed tools in studies of nutri-tional epidemiology because they are inexpensive, easy to develop and provide useful information on dietary in-take over a long period of time [3–5]. Furthermore, this tool can be used to conduct personal interviews. This is extremely important when studying population groups with high illiteracy rates.
© The Author(s). 2019Open AccessThis article is distributed under the terms of the Creative Commons Attribution 4.0 International License (http://creativecommons.org/licenses/by/4.0/), which permits unrestricted use, distribution, and reproduction in any medium, provided you give appropriate credit to the original author(s) and the source, provide a link to the Creative Commons license, and indicate if changes were made. The Creative Commons Public Domain Dedication waiver (http://creativecommons.org/publicdomain/zero/1.0/) applies to the data made available in this article, unless otherwise stated. * Correspondence:[email protected];[email protected]
The FFQ should be developed specifically for the target population of the study since diet may be influ-enced by ethnicity, culture, economic status and en-vironmental factors [6]. Besides, the questionnaire must be validated to ensure that the measurements are correct and therefore provide relevant information [7]. To assess the validity of the measurements tained, it is necessary to check that the results ob-tained are similar to the ones observed when employing other methods [8–10].
The Department of Loreto is the largest territory in the Peruvian Amazon. Its capital city is Iquitos, lo-cated in the Great Plains of the Amazon Basin on the banks of the Amazon River at the confluence of the Nanay and Itaya Rivers. According to the data from the Peruvian National Institute of Statistics and In-formatics (INEI) in 2015 [11], “this province has been placed in the third group in the range of extreme poverty incidence, with a high rate of chronic malnu-trition in children and of overweight and persistent diseases in adults”. According to diverse studies, the population of Loreto has not been eating properly for a considerable period of time [12–15]. Given the amount of food resources available in this area [14], this situation can be put down to a poor food culture along with a low purchasing power [15]. For this rea-son, conducting dietary intake studies represent a fundamental step to know the vulnerability of the population of Loreto and the severity of the problems associated with their nutrition. At the same time, not many researches have focused on assessing intake and eating patterns in this region. It is important to high-light that its geographical location, the climate, the large number of existing indigenous people and its border situation with three other countries (Ecuador, Colombia and Brazil) provide significant differences in the eating habits of its inhabitants with respect to other regions of Peru [14, 15].
However, in Peru, the FFQ currently in use is not suit-able for this area since it is made up of foods commonly consumed in urban areas regardless of food availability, consumption and eating habits of the people who live in the jungle.
The objective of this work is, therefore, to design and validate a new FFQ specifically aimed to study food in-take habits of the Peruvian Amazon population analysing their food consumption patterns in greater depth and identifying possible deficiencies and their relationship with chronic diseases.
Methods
Study design, population and sample
We carried out an observational survey study di-vided in three phases. The target population was
made up of the inhabitants of Pueblo Libre, a popu-lated centre of Belén located in the periphery of Iquitos, an area affected by floods between February and June. This location lends it a transitional char-acter between the communities who live close to the rivers in the jungle and the city itself. It was se-lected for this study because it clearly represents this transition and because it allows us to obtain more information about the local foods consumed in the area.
The statistical-epidemiological package EPIDAT (ver-sion 4.1) and the Pueblo Libre population census (Belén District, Iquitos, 2009) were used to determine the sam-ple size [16]. For an expected prevalence of chronic mal-nutrition of 24.9% [17], an accuracy level of 5% and a safety level of 95%, a minimum sample size of 218 per-sons was obtained.
Stratified random sampling without replacement was performed by age and gender based on the random se-lection of 40 homes corresponding to Sector 12 of Pue-blo Libre. It was assumed that the family unit of each home was made up of an average of 6 people. In the end, a total of 303 individuals were selected aged be-tween 3 and 83 years old.
Reference method
To design the FFQ and its subsequent validation, the R24 was taken as the reference method. This type of dietary survey provides information not only about an individual’s food consumption on a given day but also about the amounts of food ingested, the ingredients and the cooking method used on each recipe. Besides, since it is carried out as an interview, it is an ideal method for population groups with a low literacy level, like in this case [18].
For each studied individual in the sample, three R24 were collected over three consecutive days: two on busi-ness days and one on a non-working day. The R24 were conducted through a personal interview by a qualified and trained nutritionist at each participant’s home. In the case of children, their mothers were interviewed. The interviewees explained the amounts of food they had consumed using domestic measurement units (a tablespoon, a cup, etc.). These were shown to the inter-viewer, who then estimated the weight in grams of every portion. The R24 were given to the same person on all occasions to avoid variability in food intake.
Food frequency questionnaire
To design and validate our FFQ, we developed a food composition database specifically for the Peruvian Amazon population. We used it together with the FFQ that was being used in other areas of Peru [15]. We omitted non-typical Amazon foods and added other commonly consumed ones in the studied area. It was composed of 132 food types classified in 10 categories ((1) dairy products; (2) eggs, meat, fish and seafood; (3) vegetables; (4) fruits; (5) cereals, legumes and dry fruits; (6) fats and oils; (7) creams; (8) sweets and snacks; (9) drinks; and (10) condiments). The amount of food consumed was calculated according to the amounts consumed on a daily, weekly, or monthly basis. The weight in grams of the average servings was estimated using the mean of consump-tion obtained in the R24 (Addiconsump-tional file 1).
One hundred six of the 303 individuals who completed the R24 went through the FFQ personal interview twice: firstly, 2 months after the R24 completion and a second time, 5 months later (Fig.1).
The average food, energy and nutrient consumption estimate was also performed using the updated Nutri-plato 4.7 [19] software.
The FFQs were given to the same person on all occa-sions to avoid variability in food intake.
Validation and analysis of the data
The quantitative variables were analysed according to their mean, median and standard deviation (SD) for the R24 and FFQ. The importance of the differ-ences in nutrient intake between the FFQ assess-ments and the mean value of the three R24 was carried out using the Wilcoxon test or t test for re-lated samples, according to the distribution of the data. Gross classification errors were calculated using
contingency tables for the average intake value of the three R24 and the FFQ.1 since this one was the closest in time.
To evaluate the validity of the FFQ, we compared the correlation between the average daily nutrient intake values obtained for the two FFQs and that obtained for the three R24 [4, 20–22]. Histograms with normality curves and the Kolmogorov-Smirnov test were used, considering p> 0.05 to verify the normality of the distribution of each nutrient. The data (log10) of the variables which did not comply were transformed. Pearson’s correlation coefficient was used to obtain an initial approximation of the correlation between the variables. Next, the intra-class correlation coefficient (ICC) was calculated [23, 24] in order to correct and eliminate inter- and intra-individual variations. To do this, the data were adjusted for energy according to the residual method proposed by Willet [24, 25] to control the confounding effect of the calories. Finally, Lin’s con-cordance correlation coefficient (CCC) was used to compute both the accuracy of the FFQ and the ac-curacy of the relation. This enabled us to observe the deviation of the data obtained by the two methods employed on a line from the origin and at 45°, corresponding to the perfect line of concord-ance or perfect reproducibility.
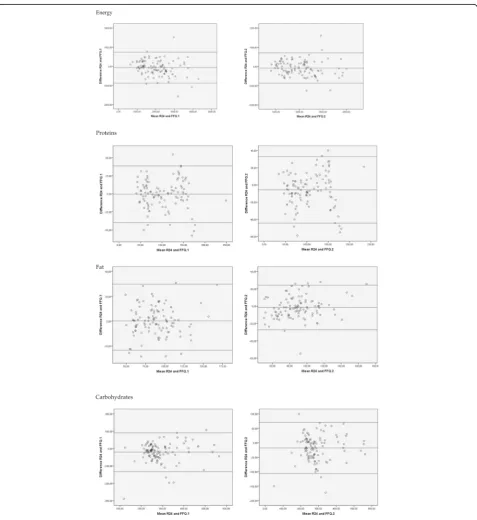
The Bland–Altman plot was used for energy and ad-justed macronutrients [26, 27] to check graphically the limits of agreement between the measurements carried out by the R24 and FFQ.
The reproducibility assessment of the FFQ was per-formed by measuring the correlation between the two FFQs performed, with a 5-week difference, as well as using the Pearson correlation coefficient, the CCI and the CCC [8,23,25].
The calculations were made using the SPSS programme, version 15.0 (SPSS Inc., Chicago, USA). In all statistical tests, the significance level used wasp< 0.05.
Results
Characterisation of the sample
Three hundred three individuals were selected between 3 and 83 years old, thus exceeding the limit of the previ-ously calculated sample size which was 218.
Regarding gender distribution, the balance was almost exact: 156 men (51.3%) and 147 women. These data co-incide with the gender structure used in 2009 [16] (Table1).
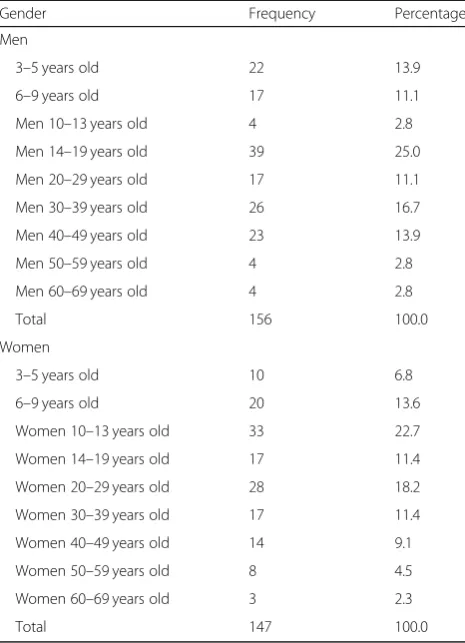
As for the age and gender distribution, the population structure has also been respected. If we group this vari-able in the same age strata, we find that it follows a dis-tribution similar to the one published in the census (Table2).
The mean, median and SD of nutrient intakes are shown in Table 3. The values estimated by the FFQs were significantly higher than those of the R24 for cal-cium, phosphorus, potassium, iron, folic acid and vita-mins B12, C and D. No significant differences were found for macronutrients and energy. Regarding the comparison of intake between both FFQs, no significant differences were found, except for calcium, phosphorus and riboflavin.
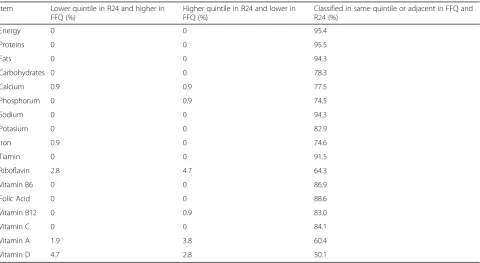
The percentages of classification errors are shown in Table 4. In both FFQs and the R24, between 60% and 96% of the individuals were classified in the same quin-tile or the adjacent one.
Validity
The validity results for energy and nutrient intake between R24 and FFQ.1 are shown in Table 5. After analysing Pearson’s correlation coefficient, ranges were found from 0.65 to 0.87 for macronutrients, 0.55–0.89 for minerals and 0.12–0.83 for vitamins. The highest correlations were obtained for energy, sodium, thiamine, vitamin B6 and folic acid and the lowest correlations were found for vitamins A and D. The ICC ranged from −0.25 to 0.88 with values above 0.60 for all nutrients except for calcium, iron and vitamins A and D, with unadjusted data. When adjusted for energy, the ICC values were lower for many nutrients, although nearly all showed a
correlation greater than 0.6. The values for Lin’s concordance correlation coefficient were higher for macronutrients and energy, with values between 0.76 and 0.89, 0.44 and 0.81 for minerals and 0.09 and 0.76 for vitamins. In all cases, the values ob-tained for vitamins A and D showed the lowest correlation.
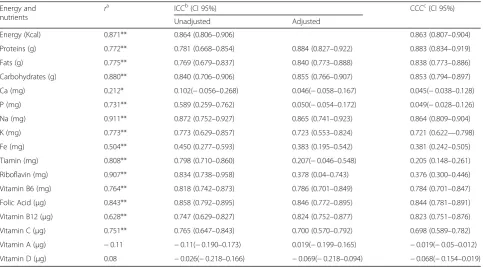
Table 6 shows the validity results between R24 and FFQ.2. The Pearson correlation coefficient produced a value of 0.87 for energy. For macronutrients, a range from 0.77 to 0.88 was observed, with minerals be-tween 0.21 and 0.91 and vitamins bebe-tween −0.11 and 0.84. The ICC for unadjusted data was 0.86 for en-ergy, between 0.77 and 0.84 for macronutrients, from 0.10 to 0.87 for minerals (with calcium showing the lowest correlation) and between −0.026 and 0.85 for vitamins. Except for calcium, phosphorus, iron and vi-tamins A and D, all the nutrients obtained an ICC above 0.6. After adjusting the data, minimal variations were observed and the results were the same as for the unadjusted data, being calcium, iron and vitamins A and D the micronutrients that obtained the lowest values. The values for CCC were higher for macronu-trients and energy: between 0.84 and 0.88. For Table 1Gender distribution of the sample
Frequency Percentage
Men 156 51.3
Women 147 48.7
Total 303 100.0
Table 2Distribution of the sample by age and gender groups
Gender Frequency Percentage
Men
3–5 years old 22 13.9
6–9 years old 17 11.1
Men 10–13 years old 4 2.8
Men 14–19 years old 39 25.0
Men 20–29 years old 17 11.1
Men 30–39 years old 26 16.7
Men 40–49 years old 23 13.9
Men 50–59 years old 4 2.8
Men 60–69 years old 4 2.8
Total 156 100.0
Women
3–5 years old 10 6.8
6–9 years old 20 13.6
Women 10–13 years old 33 22.7
Women 14–19 years old 17 11.4
Women 20–29 years old 28 18.2
Women 30–39 years old 17 11.4
Women 40–49 years old 14 9.1
Women 50–59 years old 8 4.5
Women 60–69 years old 3 2.3
Table 3Daily intake of nutrients estimated by the average 3 R24, FFQ.1 and FFQ.2
Energy and nutrients
R24 FFQ.1 FFQ.2
Mean Median SD Mean Median SD Mean Median SD
Energy (Kcal) 1988.2 1924.5 751.4 2058.1 1990.5 846.8 2069.8 2006.5 809.8
Proteins (g) 96.6b 82.2 45.9 105.2 89.8 45.7 107.8 100.3 50.7
Fats (g) 88.1a 91.2 28.7 88.8 92.1 30.6 90.2 91.9 32.3
Carbohydrates (g) 273.3b 244.5 122.6 302.4 287.2 130.1 308.1 286.5 146.0
Ca (mg) 535.4 518.7ªb 221.4 634.9 551.9b 345.3 924.4 886.3 367.8
P (mg) 1028.3 879ªb 506.8 1274.8 1140.5b 651.2 1362.8 1143 697.2
Na (mg) 3909.0 3133.5 2067 4513.3 3809.5 2346 4414.4 3672.5 2206
K (mg) 2482.3 2720ªb 1284.6 2779.6 2376.5 1343.7 2840.9 2720 1284.6
Fe (mg) 7.8 7.5ªb 2.7 9.0 8.5 4.1 9.0 8.9 3.9
Tiamin (mg) 1.7 1.7a 0.9 1.9 1.8 0.9 1.9 1.8 0.8
Riboflavin (mg) 2.1 1.7ab 1.5 2.3 2.0b 2.5 1.2 0.7 1.4
Vitamin B6 (mg) 1.9 1.7a 1.1 2.0 2.0 1.1 2.0 1.7 1.2
Folic Acid (μg) 198.4 155.1ab 134.5 227.9 216.1 126.8 217.0 165.9 134.1
Vitamin B12 (μg) 4.4 2.5ab 4.0 6.9 6.0b 3.7 5.4 4.0 4.4
Vitamin C (mg) 116.7 92.8ab 72.4 146.7 129.0 84.0 134.1 123.2 73.5
Vitamin A (μg of RE) 320.4 314.0a 124.1 594.6 346.0 878.3 572.3 305.2 1056.5
Vitamin D (μg) 1.0 0.5ab 1.8 1.0 0.7 0.7 1.0 0.8 0.7
a
Significant differences (p< 0.05) for FFQ.1
b
Significant differences (p< 0.05) for FFQ.2
ab
Significant differences (p < 0.05) for both FFQ
Table 4Percentages of energy and nutrient classification errors
Item Lower quintile in R24 and higher in FFQ (%)
Higher quintile in R24 and lower in FFQ (%)
Classified in same quintile or adjacent in FFQ and R24 (%)
Energy 0 0 95.4
Proteins 0 0 95.5
Fats 0 0 94.3
Carbohydrates 0 0 78.3
Calcium 0.9 0.9 77.5
Phosphorum 0 0.9 74.5
Sodium 0 0 94.3
Potasium 0 0 82.9
Iron 0.9 0 74.6
Tiamin 0 0 91.5
Riboflavin 2.8 4.7 64.3
Vitamin B6 0 0 86.9
Folic Acid 0 0 88.6
Vitamin B12 0 0.9 83.0
Vitamin C 0 0 84.1
Vitamin A 1.9 3.8 60.4
Table 5Nutrient intake validity between R24 and FFQ.1
Energy and
nutrients r
a
ICCb(CI 95%) CCCc(CI 95%)
Unadjusted Adjusted
Energy (Kcal) 0.874** 0.866 (0.809–0.907) 0.865 (0.810–0.905)
Proteins (g) 0.649** 0.619 (0.478–0.854) 0.892 (0.846–0.926) 0.892 (0.845–0.925)
Fats (g) 0.772** 0.771 (0.681–0.839) 0.875 (0.822–0.913) 0.874 (0.821–0.913)
Carbohydrates (g) 0.815** 0.794 (0.682–0.864) 0.763 (0.643–0.841) 0.761 (0.671–0.967)
Ca (mg) 0.654** 0.564 (0.392–0.692) 0.510 (0.333–0.648) 0.508 (0.384–0.613)
P (mg) 0.713** 0.654 (0.415–0.788) 0.499 (0.156–0.698) 0.496 (0.370–0.604)
Na (mg) 0.889** 0.825 (0.680–0.897) 0.810 (0.660–0.887) 0.809 (0.736–0.863)
K (mg) 0.804** 0.855 (0.747–0.912) 0.804 (0.678–0.876) 0.802 (0.725–0.859)
Fe (mg) 0.548** 0.478 (0.307–0.618) 0.443 (0.277–0.584) 0.441 (0.307–0.558)
Tiamin (mg) 0.879** 0.861 (0.675–0.914) 0.233(−0.034–0.593) 0.231 (0.174–0.288)
Riboflavin (mg) 0.796** 0.880 (0.807–0.923) 0.408 (0.203–0.572) 0.406 (0.260–0.534)
Vitamin B6 (mg) 0.820** 0.807 (0.718–0.868) 0.764 (0.664–0.835) 0.762 (0.671–0.831)
Folic Acid (μg) 0.829** 0.806 (0.698–0.873) 0.760 (0.639–0.840) 0.758 (0.668–0.827)
Vitamin B12 (μg) 0.578** 0.528 (0.164–0.727) 0.774 (0.681–0.842) 0.772 (0.682–0.839)
Vitamin C (μg) 0.769** 0.745 (0.504–0.857) 0.708 (0.452–0.832) 0.706 (0.608–0.783)
Vitamin A (μg) 0.120 0.025(−0.148–0.201) 0.08(−0.163–0.185) 0.09(−0.028–0.045)
Vitamin D (μg) 0.141 −0.025(−0.217–0.167) 0.08(−0.163–0.144) 0.096(−0.082–0.267)
a
r, Pearson’s correlation coefficient, level of statistical significance: *P< 0.05, **P< 0.01
b
ICC intraclass correlation coefficient
c
CCCLin’s concordance correlation coefficient
Table 6Nutrient intake validity between R24 and FFQ.2
Energy and
nutrients r
a
ICCb(CI 95%) CCCc(CI 95%)
Unadjusted Adjusted
Energy (Kcal) 0.871** 0.864 (0.806–0.906) 0.863 (0.807–0.904)
Proteins (g) 0.772** 0.781 (0.668–0.854) 0.884 (0.827–0.922) 0.883 (0.834–0.919)
Fats (g) 0.775** 0.769 (0.679–0.837) 0.840 (0.773–0.888) 0.838 (0.773–0.886)
Carbohydrates (g) 0.880** 0.840 (0.706–0.906) 0.855 (0.766–0.907) 0.853 (0.794–0.897)
Ca (mg) 0.212* 0.102(−0.056–0.268) 0.046(−0.058–0.167) 0.045(−0.038–0.128)
P (mg) 0.731** 0.589 (0.259–0.762) 0.050(−0.054–0.172) 0.049(−0.028–0.126)
Na (mg) 0.911** 0.872 (0.752–0.927) 0.865 (0.741–0.923) 0.864 (0.809–0.904)
K (mg) 0.773** 0.773 (0.629–0.857) 0.723 (0.553–0.824) 0.721 (0.622—0.798)
Fe (mg) 0.504** 0.450 (0.277–0.593) 0.383 (0.195–0.542) 0.381 (0.242–0.505)
Tiamin (mg) 0.808** 0.798 (0.710–0.860) 0.207(−0.046–0.548) 0.205 (0.148–0.261)
Riboflavin (mg) 0.907** 0.834 (0.738–0.958) 0.378 (0.04–0.743) 0.376 (0.300–0.446)
Vitamin B6 (mg) 0.764** 0.818 (0.742–0.873) 0.786 (0.701–0.849) 0.784 (0.701–0.847)
Folic Acid (μg) 0.843** 0.858 (0.792–0.895) 0.846 (0.772–0.895) 0.844 (0.781–0.891)
Vitamin B12 (μg) 0.628** 0.747 (0.629–0.827) 0.824 (0.752–0.877) 0.823 (0.751–0.876)
Vitamin C (μg) 0.751** 0.765 (0.647–0.843) 0.700 (0.570–0.792) 0.698 (0.589–0.782)
Vitamin A (μg) −0.11 −0.11(−0.190–0.173) 0.019(−0.199–0.165) −0.019(−0.05–0.012)
Vitamin D (μg) 0.08 −0.026(−0.218–0.166) −0.069(−0.218–0.094) −0.068(−0.154–0.019)
a
r, Pearson’s correlation coefficient, level of statistical significance: *P < 0.05, **p< 0.01
b
ICCIntraclass correlation coefficient
c
minerals, very different data were obtained: 0.04 for calcium, 0.38 for iron, 0.72 for potassium and 0.86 for sodium. In the case of vitamins, only vitamin C, folic acid and vitamin B12 obtained a CCC higher than 0.6. Vitamins A and D were the ones that ob-tained the lowest values: 0.02 and−0.07, respectively.
The Bland–Altman plots indicated a high level of agreement between both methods (Fig. 2) since there
were very few observations outside the limits for energy, protein, lipids and carbohydrates.
Reproducibility of the FFQ
The Pearson correlation coefficient showed very high values for energy and macronutrients (0.61–0.87). In the case of minerals, ranges between 0.22 and 0.95 were ob-tained, with calcium at the bottom end and those of
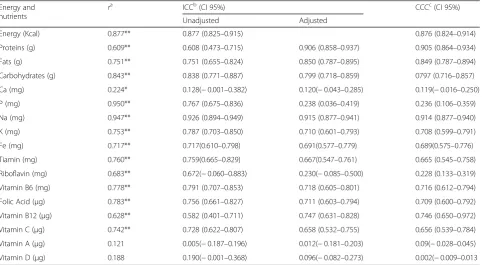
sodium and phosphorus at the top. The ICC gave a value of 0.87 for energy, a range from 0.61 to 084 for un-adjusted macronutrients and from 0.80 to 0.91 for ad-justed macronutrients. In the case of minerals, the values ranged between 0.12 and 0.93 for non-adjusted data and between 0.12 and 0.91 for adjusted data, with calcium obtaining the lowest results in both cases. CCC showed very high values most of which were above 0.6, being energy, proteins, lipids, sodium and potassium, the ones showing the greatest concordance. Again, calcium and vitamins A and D obtained the lowest values (Table7).
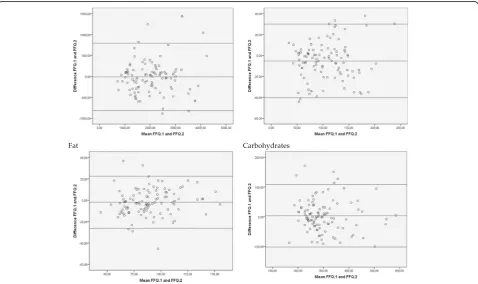
The Bland–Altman plots showed a high level of agree-ment between both FFQs, since very few observations were found outside the limits.
Discussion
An FFQ was designed and validated to make a nutri-tional assessment of food intake in the Peruvian Ama-zon. To determine the validity, the average nutrient intake was obtained using and comparing three R24 on consecutive days. As found in many other studies [3, 9, 20,25,28–32], R24 was chosen as the reference method. To determine reproducibility, the FFQ data were com-pared in two different occasions, with a time interval of 5 months between both moments. Several authors have indicated that to ensure minimum variation between the
results obtained from two surveys collected from the same individual, there must be an intervening time period from 4 to 6 months [2,26].
Regarding the distribution of the sample, it should be noted that there are not many individuals aged over 50 included in the age groups due to the low life expectancy of the population in this area as shown in the last census [11, 12, 16].
The results obtained to establish the validity show a close correlation, with an average Pearson’s correlation coefficient of 0.70, an average ICC of 0.65 and 0.60 for CCC. Approximately 60% of the nutrients had a CCC above 0.60. If we estimated the validity by comparing R24 with FFQ.2, we observed a slight decrease in the correlation values obtained (0.67, 0.63 and 0.54), prob-ably because the time elapsed between the two surveys exceeded 12 weeks [2,26].
As for reproducibility, better results were obtained, with an average Pearson’s correlation coefficient of 0.67, 0.64 ICC and 0.58 CCC. It should be noted that, in this case, 70.6% of the nutrients obtained a CCC above 0.6.
Only vitamins A and D and calcium had a much lower correlation. This is probably due to the lack of nutri-tional information about these vitamins and this mineral in the South American food composition tables [33,34] added to the Peruvian Amazon food database and used
Table 7Nutrient intake reproducibility between FFQ.1 and FFQ.2
Energy and
nutrients r
a
ICCb(CI 95%) CCCc(CI 95%)
Unadjusted Adjusted
Energy (Kcal) 0.877** 0.877 (0.825–0.915) 0.876 (0.824–0.914)
Proteins (g) 0.609** 0.608 (0.473–0.715) 0.906 (0.858–0.937) 0.905 (0.864–0.934)
Fats (g) 0.751** 0.751 (0.655–0.824) 0.850 (0.787–0.895) 0.849 (0.787–0.894)
Carbohydrates (g) 0.843** 0.838 (0.771–0.887) 0.799 (0.718–0.859) 0797 (0.716–0.857)
Ca (mg) 0.224* 0.128(−0.001–0.382) 0.120(−0.043–0.285) 0.119(−0.016–0.250)
P (mg) 0.950** 0.767 (0.675–0.836) 0.238 (0.036–0.419) 0.236 (0.106–0.359)
Na (mg) 0.947** 0.926 (0.894–0.949) 0.915 (0.877–0.941) 0.914 (0.877–0.940)
K (mg) 0.753** 0.787 (0.703–0.850) 0.710 (0.601–0.793) 0.708 (0.599–0.791)
Fe (mg) 0.717** 0.717(0.610–0.798) 0.691(0.577–0.779) 0.689(0.575–0.776)
Tiamin (mg) 0.760** 0.759(0.665–0.829) 0.667(0.547–0.761) 0.665 (0.545–0.758)
Riboflavin (mg) 0.683** 0.672(−0.060–0.883) 0.230(−0.085–0.500) 0.228 (0.133–0.319)
Vitamin B6 (mg) 0.778** 0.791 (0.707–0.853) 0.718 (0.605–0.801) 0.716 (0.612–0.794)
Folic Acid (μg) 0.783** 0.756 (0.661–0.827) 0.711 (0.603–0.794) 0.709 (0.600–0.792)
Vitamin B12 (μg) 0.628** 0.582 (0.401–0.711) 0.747 (0.631–0.828) 0.746 (0.650–0.972)
Vitamin C (μg) 0.742** 0.728 (0.622–0.807) 0.658 (0.532–0.755) 0.656 (0.539–0.784)
Vitamin A (μg) 0.121 0.005(−0.187–0.196) 0.012(−0.181–0.203) 0.09(−0.028–0.045)
Vitamin D (μg) 0.188 0.190(−0.001–0.368) 0.096(−0.082–0.273) 0.002(−0.009–0.013
a
r, Pearson’s correlation coefficient, level of statistical significance: *P< 0.05, **P< 0.01
b
ICCIntraclass correlation coefficient
c
for this validation. The lack of information about com-mon foods in food composition tables is considered a source of error in the validation of FFQs [2].
After adjusting the data by the residual method, a slight fall was produced in the ICC for almost all nutri-ents, as shown in other studies [10,23,35–37].
Our results are higher than those obtained in the stud-ies performed by Dehgham [8, 38], Elorriaga [31], Sat-vinder [35] and Marcinkevage [39] and similar to others, such as the one carried out by Jackson [9] on the Jamai-can population group, which obtained an ICC range be-tween 0.5 and 0.88. Nor was it possible in this study to establish a correlation for fat-soluble vitamins. Another study performed on a New Zealand population group by Wong JE, obtained a Spearman’s correlation coefficient of 0.71 and an ICC of 0.69 when estimating reproduci-bility [40].
The Bland–Altman plot, based on a graphical in-terpretation, was used to obtain further information about the relationship between the FFQs and the results obtained via the R24. The results we ob-served are similar to the ones shown on the studies conducted by Trinidad [10], Zapata [32], Goni [41] and De Salvo [42], where a small number of indi-viduals fell outside the recommended limits, con-firming an acceptable level of agreement between both methods.
The classification capacity obtained by the FFQ was greater than the one observed in other studies [25, 31, 32, 43, 44] when comparing the extreme misclassifica-tion measured with FFQ.1 and the average of the three R24. However, it should be noted that some studies, for comparison purposes, grouped the participants in tertiles [25] or quartiles [45] instead of quintiles, as was the case in our study.
We can, therefore, confirm that the correlation coeffi-cients indicate a good relationship to establish both val-idity and reproducibility, since they are within the values considered acceptable (0.5–0.8) according to Cade et al. and Willet [2,46] (Fig.3).
Conclusions
We conclude that the FFQ employed is a useful and valid tool to estimate the dietary intake of the Peruvian Amazon population, and thus, it can be used in future studies that link dietary patterns to chronic diseases.
Limitations
The main limitation of this research is the fact that it was impossible to use accepted biomarkers as a reference value for the validation of the FFQ. How-ever, numerous researchers also used R24, just like us [8, 9, 20, 23, 31, 32, 35, 38, 39, 44, 45].
Another limitation is the lack of information about certain nutrients in the Peruvian food composition tables [47] and in other databases around South America [33, 34]. Even though food composition tables were specific-ally written for this area, these nutrients could not be evaluated using the FFQ. To fill this information gap, the most representative foods need to be analysed in the laboratory [48].
Supplementary information
Supplementary informationaccompanies this paper athttps://doi.org/10. 1186/s41043-019-0199-8.
Additional file 1.Annexed 1 food frequency questionnaire for Peruvian amazon population.
Abbreviations
CCC:Lin’s concordance correlation coefficient; FFQ: Food frequency questionnaire; ICC: Intraclass correlation coefficient; INEI (in Spanish): Peruvian National Institute of Statistics and Computing; R24: 24-h recall
Acknowledgements
We would like to thank the Department of Cooperation of the University of Córdoba for giving us the opportunity to travel to Iquitos to carry out this research.
A special thanks also goes to the association“La Restinga”for their great help in making our stay in Iquitos easier, for introducing us to the Pueblo Libre community and for the excellent work they carry out in the district of Belén.
Authors’contributions
All the authors participated in the design of the study and all the authors wrote the papper. All authors read and approved the final manuscript.
Funding
Not applicable for this section.
Availability of data and materials
The datasets used and/or analysed during the current study are available from the corresponding author on reasonable request.
Ethics approval and consent to participate
The study was conducted in line with the directives of the Declaration of Helsinki on Ethical Principles for Medical Research. All participants were informed personally, verbally and in writing about the study’s aims, risks and benefits derived from their participation and, in all cases, their informed consent was obtained. Moreover, the research protocol was approved by the Ethical Committee of the PhD Program in Bioscience and Agri-food Sciences of the University of Córdoba (Spain).
Consent for publication Not applicable for this section.
Competing interests
The authors declare that they have no competing interests.
Received: 3 May 2019 Accepted: 28 October 2019
References
1. Shim J, Oh K, Kim H. Dietary assessment methods in epidemiologic studies. Epidemiol Health. 2014;36:e2014009.
2. Willet W, Lenart E. Reproducibility and validity of food-frequency questionnaires. In: Willet W, editor. Nutritional epidemiology. 2nd ed. New York: Oxford University Press; 1998. p. 101–47.
3. Marques P, Ross A, Wynn E, Rezzi S, Paccaud F, Decarli B. Reproducibility and relative validity of a food-frequency questionnaire for French-speaking Swiss adults. Food Nutr Res. 2011;55:10.3402/fnr.v55i0.5905.
4. Pietinen P, Hartman AM, Haapa E, Räsänen L, Haapakoski J, Palmgren J, et al. Reproducibility and validity of dietary assessment instruments. II. A qualitative food-frequency questionnaire. Am J Epidemiol. 1988;128:667–76. 5. Willet WC, Sampson L, Stampfer MJ, Rosner B, Bain C, Witschi J, et al.
Reproducibility and validity of a semiquantitative food frequency questionnaire. Am J Epidemiol. 1985;122:51–65.
6. Teufel NI. Development of culturally competent food-frequency questionnaires. Am J Clin Nutr. 1997;65:1173S–8S.
7. Parr CL, Barikmo I, Torheim LE, Ouattara F, Kaloga A, Oshaug A. Validation of the second version of a quantitative food-frequency questionnaire for use in Western Mali. Public Health Nutr. 2002;5(6):769–81.
8. Dehghan M, del Cerro S, Zhang X, Cuneo JM, Linetzky B, Diaz R, et al. Validation of a semi-quantitative food frequency questionnaire for Argentinean adults. PLoS One. 2012;7(5):e37958.
9. Jackson MD, Walker SP, Younger NM, Bennett FI. Use of a food frequency questionnaire to assess diets of Jamaican adults: validation and correlation with biomarkers. Nutr J. 2011;10:28.
10. Trinidad I, Fernández J, Cucó G, Biarnés E, Arija V. Validación de un cuestionario de frecuencia de consumo alimentario corto: reproducibilidad y validez. Nutr Hosp. 2008;23(3):242–52.
11. Instituto Nacional de Estadística e Informática (INEI). Síntesis estadística 2015. Lima; 2015. Avaible in:https://www.inei.gob.pe/media/ MenuRecursivo/publicaciones_digitales/Est/Lib1292/libro.pdf.
12. Ministerio de la Presidencia. Consejo de Coordinación Regional de Loreto. Mesa de Concertación para la Lucha Contra la Pobreza de Loreto. Plan Concertado de Desarrollo Departamental-Loreto. 2002–2011. Iquitos, 2002. 13. Miranda JJ, Wells JCK, Smeeth L. Transiciones en contexto: Hallazgos
vinculados a migración rural-urbana y enfermedades no transmisibles en Perú. Rev perú med exp salud pública. 2012;29(3):366–72.
14. Chirif, A. Biodiversidad amazónica y gastronomía regional. Folia Amazónica [Internet] 2005. [acceso 25 de agosto de 2013]; 14:91–98. Disponible en http://www.iiap.org.pe/Upload/Publicacion/PUBL643.pdf
15. Molina G, Moreno R, García M, Vaquero M. Nutritional assessment of the most frequently consumed dishes in a slum in Iquitos. Peruvian Amazon Nutr Hosp. 2016;33(1):70–9.
16. Silva Santisteban, A. Censo de población y vivienda y análisis situacional cualitativo del barrio de Pueblo Libre en el distrito de Belén. Informe final Lima; OPS, Informe Técnico 2009.
17. Instituto Nacional de Estadística e Informática (INEI). Perú: Encuesta Demográfica y de Salud Familiar 2011. Nacional y Departamental Lima: INEI; 2012. 18. Janet C, Rachel T, Victoria B, Daniel W. Development, validation and
utilization of food frequency questionnaires. Rev Public Health Nutr. 2001; 5(4):567–87.
19. Moreno R, Pérez F, Cámara F. Nutriplato 2.0 web para valoración de recetas y platos de libre uso. Nutr Clin Diet Hosp. 2012;32(1):58–29.
20. Rivas A, Romero A, Mariscal M, Monteagudo C, Hernández J, Olea-Serrano F. Validación de cuestionarios para el estudio de hábitos alimentarios y masa ósea. Nutr Hosp. 2009;24(5):521–8.
21. Monge R, Nuñez H. Total dietary fiber in urban and rural Costa Rican adolescents’diets. Arch Latinoam Nutr. 2001;51(4):340–5.
22. Sánchez SN, Neira JA, Pérez F, Rojas RM. Preliminary nutritional assessment of the Ecuadorian diet based on a 24-h food recall survey in Ecuador [Internet]. Nutrición Hospitalaria. 2013 [citado 2 de julio de 2016]. Disponible en:http://www.redalyc.org/articulo.oa?id=309230208042
23. Tang Y, Liu Y, Xu L, Jia Y, Shan D, Li W, et al. Validity and reproducibility of a revised semi-quantitative food frequency questionnaire (SQFFQ) for women of age-group 12-44 years in Chengdu. J Health Popul Nutr. 2015;33(1):50–9.
24. Willett W. Nutritional epidemiology. OUP USA; 2013.
25. Yanagisawa A, Sudo N, Amitani Y, Caballero Y, Sekiyama M, Mukamugema C, et al. Development and validation of a data-based food frequency questionnaire for adults in eastern rural area of Rwanda. Nutr Metab Insights. 2016;9:31–42.
26. Arija V, Abellana R, Ribot B, Ramón JM. Sesgos y ajustes en la valoración nutricional de las encuestas alimentarias. Nutr Hosp. 2015; 31(s03):113–8.
28. Aguirre A, Cabrera A, Domínguez S, Borges C, Carrillo L, Batista G, et al. Validación de un cuestionario de frecuencia de consumo de alimentos adaptado para el estudio y seguimiento de la población adulta de las Islas Canarias. Rev Esp Sal Pub. 2008;82(5):509–18.
29. Eulert PC, Roberfroid D, Kolsteren PW. Desarrollo y evaluación de un cuestionario semi-cuantitativo de frecuencias alimenticias para adolescentes bolivianos. Nutr Hosp. 2006;21(5):573–80.
30. Silva KM, Neutzling MB, Drehmer M. FFQ for the adult population of the capital of Ecuador (FFQ-Quito): development, reliability and validity. Public Health Nutr. 2015;18(14):2540–9.
31. Elorriaga N, Irazola VE, Defago MD, Britz M, Martinez SP, Witriw AM, et al. Validation of a self-administered FFQ in adults in Argentina. Chile and Uruguay Public Health Nutr. 2015;18(1):59–67.
32. Zapata ME, Buffarini R, Lingiardi N, Gonçalves AL. Reproducibility and relative validity of a semi-quantitative food-frequency questionnaire in an adult population of Rosario. Argentina Rev Esp Nutr Hum Diet. 2015;19(4):221–30. 33. Sammán N, de Portela ML PM. Current situation and future prospects of
food composition tables and databases in the frame of LATINFOODS/ INFOODS networks. DIAETA (B. Aires). 2010;28(132):29–34.
34. Ortiz R, Rocha K, Doménech G. Revisión de las tablas de composición de alimentos usadas para estimar la ingesta de nutrientes en Ecuador. Rev Chil Nutr. 2016;43(2):209–16.
35. Satvinder K, Hamid M, Rohana AJ, Barakatun M, Hip Y. Validation and reproducibility of a culturally specific food frequency questionnaire (FFQ) for Malaysian Punjabis. Mal J Nutr. 2016;22(2):245–55.
36. Katsouyanni K, Rimm EB, Gnardellis C, Trichopoulos D, Polychronopoulos E, Trichopoulou A. Reproducibility and relative validity of an extensive semi-quantitative food frequency questionnaire using dietary records and biochemical markers among Greek schoolteachers. Int J Epidemiol. 1997; 26(Suppl 1):S118–27.
37. Martin JM, Boyle P, Gorgojo L, Maisonneuve P, Fernandez JC, Salvini S, et al. Development and validation of a food frequency questionnaire in Spain. Int J Epidemiol. 1993;22(3):512–9.
38. Dehghan M, López P, Dueñas R, Anaya LL, García RG, Zhang X, et al. Development and validation of a quantitative food frequency questionnaire among rural- and urban-dwelling adults in Colombia. J Nutr Educ Behav. 2012;44(6):609–13. 39. Marcinkevage J, Mayén A-L, Zuleta C, DiGirolamo AM, Stein AD, Ramirez-Zea
M. Relative validity of three food frequency questionnaires for assessing dietary intakes of Guatemalan schoolchildren. PLoS One. 2015;10(10):e0139125. 40. Wong JE, Parnell WR, Black KE, Skidmore PML. Reliability and relative validity
of a food frequency questionnaire to assess food group intakes in New Zealand adolescents. Nutr J. 2012;11:65.
41. Goni L, Martínez JA, Santiago S, Cuervo M. Validación de una encuesta para evaluar el estado nutricional y los estilos de vida en las etapas
preconcepcional, embarazo y lactancia 2013 Disponible en:https://www. scienceopen.com/document?vid=b952f275-2d78-4a35-ab46-07332a4fecaa 42. De Salvo A, Godoy S. Reproducibility and validity of a food frequency
questionnaire. Rev Saude Publica. 2002;36(4):505–12.
43. Macedo G, Vizmanos B, Márquez YF, Rodríguez NP, López PJ, Fernández JD. Validación de un cuestionario semi-cuantitativo de frecuencia de consumo de alimentos para determinar la ingestión de grupos de alimentos y nutrientes. Nutr Hosp. 2013;28(n06):2212–20.
44. Fernández JD, Piñol JL, Zazpe I, Corella D, Carrasco P, Toledo E, et al. Relative validity of a semi-quantitative food-frequency questionnaire in an elderly Mediterranean population of Spain. Br J Nutr. 2010;103(12):1808–16. 45. Lee Y, Park K. Reproducibility and validity of a semi-quantitative FFQ for
trace elements. Br J Nutr. 2016;116(5):864–73.
46. Cade J, Thompson R, Burley V, Warm D. Development, validation and utilisation of food-frequency questionnaires- a review. Public Health Nutr. 2002;5:567–87.
47. Centro Nacional de Alimentación y Nutrición. Instituto Nacional de Salud. Tablas Peruanas de Composición de Alimentos. Lima: Ministerio de Salud; 2009. 48. Greenfield H, Southgate D. Currents needs and future directions En. In:
Greenfield H, Southgate. Selection of foods, editors. Food Composition Data. 2a ed. Rome: FAO; 2003. p. P199–208.
Publisher’s Note