Philippine Carabao Mango Pest Identification
Using Convolutional Neural Network
Antonio V. Rocha IV, Joe G. Lagarteja
Abstract— The detection and management control of pests in mangoes if applied properly would result to a higher fruit production. Applying precision agriculture with the use of modern technology helps mango farmers detect and identify the different types of pests that are infesting their farms. This research study introduces a computer application development that can identify and determine mango pests based on the provided images using a smartphone. Convolutional Neural Network (CNN) is a type of algorithm that was used to train stack of mango pest images which were pre-processed and used as a train model. Using Convolutional Neural Network (CNN), the images were processed to determine the type of pests currently present on mango trees and provides the best control measure that the system would provide after detection. The neural network was designed using Keras to run on top of the deep learning framework TensorFlow. Datasets composed of 4,300 images were used for training and 800 were used to validate the CNN model. The model achieved a remarkable 88.75% accuracy rate in determining mango pests. GIS (Geographical Information Systems) was also utilized to determine affected areas in the region.
Index Terms— Artificial Intelligence, Carabao Mango Pest, Convolutional Neural Network, Geographical Information System, Pest Management and Control
—————————— ——————————
1
I
NTRODUCTIONMango fruit is one of the premium exports of the Philippines, and Region II is one of the major contributors of mango production in our country. In fact, based on the report of the Philippine Mango Industry Foundation Inc. (PMIFI), the island of Luzon produces 2/3 of the mangoes, and the Province of Isabela is currently at Rank #9 that produces 18,185.99 metric tons of mangoes. But amid the recognition and increasing demand for mangoes, the country’s mango production declined drastically due to pest infestation which results in poor quality of fruits [1]. There are eight (8) different types of pests that are common in mangoes in the Philippines which includes Capsid Bug, Fruit Fly, Mango Cecid Fly, Mango Leafhoppers, Mango Seed Borer, Mealy Bugs, Scale Insect, and Anthracnose. Capsid Bug stays in wild vegetation and is active in the evening. It feeds on developing fruits, up to the size of a chicken egg. Fruit Fly is almost similar in size to the house fly. The female fruit fly punctures the peel of mature fruit and lays eggs on it. Mango Cecid Fly is a very small and delicate fly with long legs and antennae, and hairy transparent wings. Its larvae are tiny bright yellow maggots. Mango Leafhopper pierce and suck plant sap resulting in the withering and falling of individual flowers. Mango Seed Borer larvae feed on the seed and flesh. A single larva can consume the entire seed in a short period of time. Mealy Bugs are small (2mm long), oval-shaped, soft-bodied insects with white cottony filaments on their body. Mealy bugs suck vital plant sap and affect leaves, flowers, and fruits.
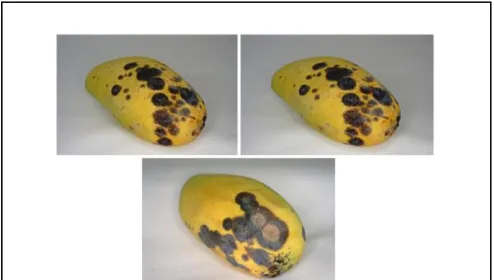
Affected parts turn yellow, dry-up and eventually, fall-off. Scale Insects are usually circular in form with scale-like appearance. In the nursery, leaves of grafted mangoes are readily infested with scale insects, causing them to dry and fall. On bearing trees, high population of scale insects causes blackening of the canopy due to the growth of fungus ―sooty mold‖ which develops from their excreta (honey dew). Affected leaves are covered with a thin, black, papery film, which produces unsightly appearance. Anthracnose is a major post-harvest problem of mango fruits and is the most serious fungal disease of mangoes in the Philippines. Anthracnose causes irregular brown spots on young leaves while mature leaves get
distorted with ―shotholes‖ in various shapes and sizes. It also blackens and withers the flowers and produces ―blossom blight‖ while causing brown to black sunken spots on the fruits. With the different types of pests and their effects in mangoes already known for their characteristics, precision agriculture [2][3] is applied to assist mango growers in decision making about pest monitoring and control by utilizing Geographic Information System (GIS) [4][5][6] for mapping of infected areas of the mango farm, clustering algorithm, and using time series analysis. Thus, the researchers developed the Philippine Mango Integrated Pest Management using Convolutional Neural Network[7][8] that can easily detect pests that are currently present on mango trees through image capturing using a digital camera and then uploaded to the computer for processing which then provided the identification and treatment procedure to eliminate the said pest. The Convolutional Neural Network (CNN) approach is used for the classification and recognition [19] of the different pests, and for mango fruit defect identification by applying a classification algorithm [9][10]. The Geographic Information System (GIS) was utilized to map/locate the infected areas of the mango farm based from the area of interest. Time series analysis model was also applied in order to give farmers a concrete decision-making on how to prevent/control pest infestation in their farms [12].
2
M
ATERIALS ANDM
ETHODS2.1 Research Design
The researchers used the descriptive and developmental research method or approach. It is the most appropriate method of inquiry about the present status and condition of a particular phenomenon. Concepts and procedures of general description, analysis, and classifications are discussed and illustrated in a considerable detail. This method tends to both the qualitative and quantitative analysis of inquiry such as the present investigation. In constructing the project, the Rapid Application Development (RAD) was used [13][14].
————————————————
Antonio V. Rocha IV is from Isabela State University, Jones Campus
3444 The challenge facing software development organizations can
be summarized as better and faster. The RAD development path attacks these challenges head-on by providing a means for developing systems faster, while reducing cost and increasing quality. This life cycle has the following four stages, including the entire task and activities required for the implementation, development and design for the application system that could support the said requirements.
The following are the phases of SDLC:
Phase 1: Requirements Planning
Preliminary Investigation
Conduct interview for the following: o Mango Growers
Consolidation of the Gathered Information
Conduct literature studies to find a similar case of existing research
Problem Identification
Conceptualization of possible solution to the problem
Phase II: User Design
The following minimum hardware and software requirement, and system architecture were used in developing the proposed Philippine Mango Integrated Pest Management uses Convolutional Neural Network.
Phase III. Rapid Construction
In this phase, the researchers focused on the rapid construction and application of the system. Software testing of the developed system is also performed. The study used Python programming language as its programming platform.
Phase IV. Implementation
To evaluate the acceptability of the developed system, the researchers used ISO 25010 Standard.
Pilot Test the system to IT Experts and Mango Growers. Capacitate users (Mango Growers) of the system through orientation and training.
2.2 Network Architecture
Figure 2 shows how the developed system works. There are three (3) stages of procedures to be performed to be able to achieve the intended results. The first stage is the Image Acquisition which means the acquiring of images from the source and that comprises the manual capturing of image photo using a smartphone with a high-resolution camera from a mango tree which is suspected of having pest, which is then sent via the internet. The second stage is the Image Processing & Recognition that deals with the processing of the captured image which includes image filtering and thresholding. The image is partitioned into its foreground and background and isolates objects by converting it into a grayscale image, then to a binary image which will then be queried in the database. The detected pest is extracted from a
TABLE 2
SOFTWARE REQUIREMENTS
Software Specification
Operating System The minimum requirement in terms of Operating System is at least Windows 8/8.1 Professional Edition or higher.
XAMPP Containing PHP and MySQL Browser
Chrome, Mozilla Firefox, Microsoft Edge
Python
Includes TensorFlow and Keras libraries
Hardware Specification
Processor 7th Gen Intel® Core™ i7-8750H Processor (9M Cache, 2.2 GHz, 4.1 GHz max)
Memory
RAM
Installed Size: 16 GB Technology: DDR4 Memory Speed: 2400 MHz
Hard drive Hard Disk: ITB
Interface Type: M.2 SSD/PCIe NVMe
Digital Camera Smartphone with a minimum of 18-megapixel camera resolution
TABLE 1
HARDWARE REQUIREMENTS
Fig. 1. Rapid Application Development Cycle
set of image references, compare it on the training image to get the result, and stored it on the database [14][15]. The variety of the mango fruit will be processed using classification methods, this will be done by clustering the pixels based on their texture and spatial features [16][17][18]. The time series analysis model is responsible for the analyzation of given data to be able to suggest the necessary steps on performing prevention/control management of pests. And the last stage is the Information Forwarding in which the processed results will be forwarded to the intended mango growers via their web account to be able for them to apply the necessary prevention/control to the identified pests on their mango trees. The system was developed and trained datasets using Python web programming.
2.3 Data Gathering Procedure
The researchers undergone two major phases in conducting the gathering of data:
First Phase: Gathering Data of Different Mango Pest
In this phase, the researchers sought permission to gather data from the office of the Department of Agriculture Region II and Isabela State University Main Campus about the different pest that infects mango trees in the whole region of Isabela. The different types of mango pest that was gathered were used as datasets to train the system in order to attain the accuracy of identifying what pests are currently infesting mango trees.
Second Phase: Gathering of Data based on the Instrument Used
The researchers adopted the ISO 25010 Software Product Quality Standard and applied it to the questionnaire that was developed. The researchers distributed the questionnaires to the intended respondents comprising of mango growers and IT experts after presenting them the developed system.
2.4 Dataset
Data are vital in every study. The dataset used in the study comprises of 5100 images of uninfected and infected mango disease acquired from the Department of Agriculture, Cagayan Valley, Philippines. The dataset was divided into two using random split, 4,300 for training set data and 800 for validation set data.
2.5 Data Analysis
The researchers used the Five-point Likert scale from which the participants based their reactions on the system. With the questionnaire that was distributed to the participants, the researchers viewed and oriented them the running system so as to evaluate and gave their reactions and opinions. The weighted mean was used for the computation of the evaluation. The table below is the criteria that the researchers used in basing the result of the evaluation upon:
2.6 Confusion Matrix
A confusion matrix is a table that is typically used to describe the performance of a classification model (or "classifier") on a set of test data known to the real values.
A confusion matrix is a summary of prediction results on a classification problem. The number of correct and incorrect predictions are summarized with count values and broken down by each class is the key to the confusion matrix. The confusion matrix shows how the classification model is confused when it makes predictions. It gives insight not only into the errors being made by a classifier but more importantly the types of errors that are being made.
3 R
ESULTS ANDD
ISCUSSIONS3.1 Current Practices in Detecting Pest and Diseases in Mango.
Based on the interview conducted by the researchers to fifty (50) mango farmers from San Agustin, Jones, and San Mateo, most of the them still practice the traditional way of detecting pest and diseases. These include the manual monitoring and scouting on a pilot basis and forecasting of pest attacks. The procedure for manual monitoring and scouting are done by searching the canopy of a mango tree in an area through visual search to determine what pest is present, how many of each kind of pest are visible, and how much damage they are causing. The forecasting of pest attacks is a way of farmers knowing what pests will show-up on a certain period of time based on their past experience.
3.2 CNN Algorithm to be Utilized in Training the Data Sets
Training of datasets in the convolutional neural network (CNN) is done through batches, which means a set of data is represented as a tensor. The tensor is taken through a convolutional layer operation to get the activation volume. Those operations are done using computer memory specifically the random-access memory (RAM) or the graphics
processing unit (GPU) memory for better performance. The researchers utilized two API’s namely TensorFlow and Keras as the main algorithm. TensorFlow was used for object detection on images uploaded into the system. It allows the experimentation with deep neural networks more easily which means less time to construct artificial neural networks, and less time to train and deploy them. While Keras is used to expand the training dataset in order to improve the
TABLE 3
FIVE-POINT LIKERT SCALE FOR ISO25010
Scale Rating Qualitative Rating
5 4.20 – 5.00 Very Great Extent
4 3.40 – 4.19 Great Extent
3 2.60 – 3.39 Moderate Extent
2 1.80 – 2.59 Little Extent
1 1.00 – 1.70 Very Little Extent
3446 performance and ability of the model to generalize.
3.3 A System Developed to Facilitate the Mango Integrated Pest Management using CNN and GIS.
Figure 4 shows the log-in window on the client side. This is where clients need to go through to access the system by visiting the website philmango-ipm.com.
Figure 5 shows the sign-up window for clients. It shows the different information needed to be provided by the client, which includes the complete name, username, password, and re-type password.
The image uploading window shown in Figure 6 shows the different process need to be accomplished by the client. This includes choosing the file to be uploaded, and the total affected area. The system can automatically detect the location of the client upon successful log-in.
Figure 7 shows the image processing on the client account. After the client successfully sends the image to the central server, it will train the image dataset and provides details like the name of the pest and proper diagnosis.
Figure 8 shows the administrator window that processes all images forwarded by clients. It includes the GIS technology that maps the exact location were the image has been taken. It also contains the archiving of data to be able to compare present to previous years.
3.4 Extent of Compliance of the Developed System with Respect to ISO 25010 Software Quality Standards
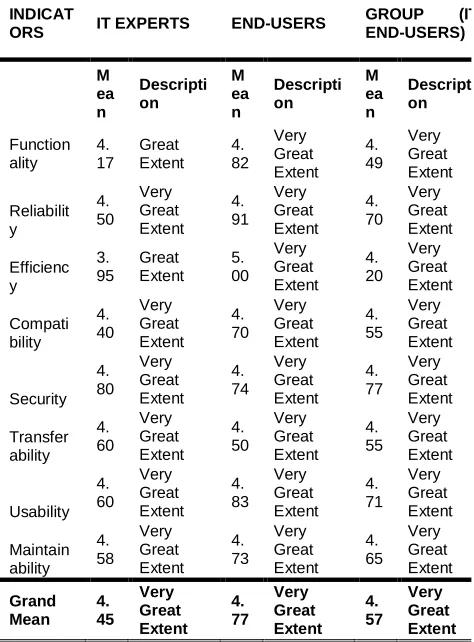
Table 4 shows the 8 indicators used in evaluating the developed system.
Functionality obtained mean value of 4.17 with a qualitative rating of Great Extent under IT Experts, 4.82 qualitative rating of very Great Extent under End-Users, and 4.49 with a qualitative rating of Very Great Extent under Group (IT/End-Users).
Reliability obtained mean value of 4.50 with a qualitative rating of Very Great Extent under IT Experts, 4.91 with a qualitative rating of Very Great Extent under End-Users, and 4.70 with a qualitative rating of Very Great Extent under Group (IT/End-Users).
Efficiency obtained mean value of 3.95 with a qualitative rating of Great Extent under IT Experts, 5.00 with a qualitative rating of Very Great Extent under End-Users, and 4.20 with a qualitative rating of Very Great Extent under Group (IT/End-Users).
Compatibility obtained mean value of 4.40 with a qualitative rating of Great Extent under IT Experts, 4.70 with a qualitative rating of very Great Extent under End-Users, and 4.49 with a qualitative rating of Very Great Extent under Group (IT/End-Users).
Fig. 4. Client Log-in
Fig. 5. Client Sign-up
Fig. 6. Client Sign-up
Fig. 7. Image Processing
Security obtained mean value of 4.80 with a qualitative rating of Great Extent under IT Experts, 4.74 with a qualitative rating of very Great Extent under End-Users, and 4.77 with a qualitative rating of Very Great Extent under Group (IT/End-Users).
Transferability obtained mean value of 4.60 with a qualitative rating of Great Extent under IT Experts, 4.50 with a qualitative rating of very Great Extent under End-Users, and 4.55 with a qualitative rating of Very Great Extent under Group (IT/End-Users).
Usability obtained mean value of 4.60 with a qualitative rating of Great Extent under IT Experts, 4.83 with a qualitative rating of very Great Extent under End-Users, and 4.71 with a qualitative rating of Very Great Extent under Group (IT/End-Users).
Maintainability obtained mean value of 4.58 with a qualitative rating of Great Extent under IT Experts, 4.77 with a qualitative rating of very Great Extent under End-Users, and 4.57 with a qualitative rating of Very Great Extent under Group (IT/End-Users).
Based from the evaluations, the developed system obtained a grand mean of 4.45 with an overall qualitative rating of very Great Extent under IT Experts, 4.77 with a qualitative rating of Very Great Extent under End-Users, and 4.57 with a qualitive rating of Very Great Extent respectivel
3.5 Classification Results Using Confusion Matrix
Table 5 shows the classification result of the study which points to an overall accuracy rate of 88.75%.
4
C
ONCLUSIONImage processing holds an effective set of tools for the analysis of imagery used in precise agriculture. From the farmers’ perspective, automating analysis of yield limiting factors and building rational management plans saves both time and money. Automating this analysis is especially beneficial for those farmers to which expert knowledge and advice is not readily available or affordable. Technological advances in the development of precision agriculture machinery and software will then prove to be cheaper and faster than on-ground human intervention and data collection. The advancement in image processing technology now changes the picture for farmers. The amount of image processing applications in precise agriculture is growing steadily with the availability of higher-quality measurements coupled with modern algorithms and increased possibility to fuse multiple sources of information from satellite imagery. The fusion of image processing in precision agriculture will prove to be straightforward and beneficial for mango farmers.
Acknowledgment
The authors wish to thank Isabela State University for the support of this study.
R
EFERENCES[1] Al Bashish D, Braik M, Bani-Ahmad S. (2010). A framework for detection and classification of plant leaf and stem diseases. International conference on signal and image processing. Chennai: IEEE; 2010.; pp. 113–118.
[2] Atlas Z, Yanar Y, Ozguven Y. (2018). ―Determination of Sugar Beet Leaf Spot Disease Level(Cercospora Beticola Sacc.)with Image Processing Technique by Using Drone‖, Curr Inves Agri Curr Res 5(3).
[3] Atole R, Daechul P. (2018). ―A Multiclass Deep Convolutional Neural Network Classifier for Detection of Common Rice Plant Anomalies‖, International Journal of Advanced Computer Science and Applications, Vol. 9, No. 1.
[4] Barbedo, J.G. (2014). ―An Automatic Method to Detect and Measure Leaf Disease Symptoms Using Digital Image
Processing‖.
[5] Barre P, Herzog K, Hofle R, Hullin M, Topfer R, Steinhage V. (2018). ―Automated phenotyping of epicuticular waxes of grapevine berries using light separation and convolutional neural networks‖.
[6] Bock C.H, Cook A.Z, Parker P.E, Gottwald T.R. (2009). Automated image analysis of the severity of foliar citrus canker symptoms.
Pests Sam
ples Correctly Classifie d Mis Classifie d Accuracy
Anthracnose 100 82 18 82%
Capsid Bug 100 96 4 96%
Cecid Fly 100 87 13 87%
Fruit Fly 100 91 9 91%
Leaf Hoppers 100 93 7 93%
Mealy Bugs 100 82 18 82%
Scale Insect 100 89 11 89%
Seed Borer 100 90 10 90%
88.75% TABLE5
CLASSIFICATION RESULTS
TABLE 4
INDICATORS FOR ISO25010
INDICAT
ORS IT EXPERTS END-USERS
3448 [7] Boese B.L., Dennis D., Clinton P., Golden R.C. (2008). Digital
Image Analysis of Zostera Marina Leaf Injury.
[8] Camargo A., & Smith J.S. (2009). An image-processing based algorithm to automatically identify plant disease visual symptoms. Biosyst Eng. 2009a; 102:9–21.
[9] Chouhan S.S, Kaul A., Singh U.P, Jain S. (2018). ―Bacterial foraging optimization based Radial Basis Function Neural Network (BRBFNN) for identification and classification of plant leaf diseases: An automatic approach towards Plant Pathology‖. [10] Contreras-Medina L.M, Osornio-Rios R.A, Torres-Pacheco I,
Romero-Troncoso R.J, Guevara-González R.G, Millan -Almaraz J.R. (2012). Smart sensor for real-time quantification of common symptoms present in unhealthy plants. Sensors (Basel, Switzerland) 2012;12:784–805.
[11] Fadzil W.M, Rizam S., Nooritawati R.J. (2014). ―Orchid Leaf Disease Detection using Border Segmentation Techniques‖ 2014 IEEE Conference on Systems, Process and Control (ICSPC 2014), Kuala Lumpur, Malaysia, pp.978-1-4799-6106-1/14.
[12] Feng Q., Dongxia L., Bingda S., Liu R., Zhanhong M., Haiguang W. (2016). ―Identification of Alfalfa Leaf Diseases Using Image Recognition Technology‖
[13] Ferentinos K. (2018). ―Deep learning models for plant disease detection and diagnosis‖. Computers and Electronics in Agriculture 145:311-318.
[14] Fuentes A, Sook Y, Sang C.K, Dong, S.P. (2017). ―A Robust Deep-Learning-Based Detector for Real-Time Tomato Plant Diseases and Pests Recognition‖.
[15] Ganthaler A., Losso A., Mayr S. (2018). ―Using image analysis for quantitative assessment of needle bladder rust disease of Norway spruce‖.
[16] Gavhale K.R., Gawande U., Hajari K.O. (2014). ―Unhealthy Region of Citrus Leaf Detection Using Image Processing Techniques‖. IEEE International Conference for Convergence of Technology, pp. 978-1-4799-3759-2/14.
[17] Goncharov P., Ososkov G., Nechaevskiy A., Uzginskiy A., Nestsiarenia I. (2019). ―Disease Detection on the Plant Leaves by Deep Learning‖, NEUROINFORMATICS 2018, SCI 799, pp. 1–9.
[18] [22] Lagarteja, J.G. (2019). Push-n-Pop Genes Xchange (PPX) – A New Crossover Operator in Genetic Algorithm. Journal of Computational and Theoretical Nanoscience. Vol. 16, Number 8, pp.3478-3482.
[19] Lagarteja, J.G. (2019). Enhanced Soil Classification Technique in Cagayan Valley, Philippines Using Artificial
Neural Network (ANN). Journal of Computational and
Theoretical Nanoscience. Vol. 16, Number 8, pp.3473-3477.
[20] Zhou Z., Zang Y., Li Y., Zhang Y., Wang P., Luo X. (2011). Rice plant-hopper infestation detection and classification algorithms based on fractal dimension values and