ScholarlyCommons
Publicly Accessible Penn Dissertations
Summer 8-13-2010
ON MACROSCOPIC CONSTITUTIVE
RELATIONS AND MICROSTRUCTURE
EVOLUTION IN MULTI-SCALE
VISCOPLASTIC COMPOSITES
Michalis Agoras
University of Pennsylvania, [email protected]
Follow this and additional works at:
http://repository.upenn.edu/edissertations
Part of the
Applied Mechanics Commons
This paper is posted at ScholarlyCommons.http://repository.upenn.edu/edissertations/193 For more information, please [email protected].
Recommended Citation
Agoras, Michalis, "ON MACROSCOPIC CONSTITUTIVE RELATIONS AND MICROSTRUCTURE EVOLUTION IN MULTI-SCALE VISCOPLASTIC COMPOSITES" (2010).Publicly Accessible Penn Dissertations. 193.
MICROSTRUCTURE EVOLUTION IN MULTI-SCALE
VISCOPLASTIC COMPOSITES
Abstract
The determination of the effective or macroscopic properties of composite materials from the corresponding
local properties of the constituent phases and the underlying sub-structure constitutes the fundamental
problem in Mechanics of Composites. This problem is motivated from the remarkable physical observation
that the constitutive properties of these materials appear to be homogeneous or uniform at the length scale of
practical applications, despite the sharp variation of their local properties at the length scale of the
heterogeneity and the fairly complex spatial distribution of their phases. This dissertation is concerned with
the macroscopic mechanical properties of “multi-scale” viscoplastic composites, i.e., composite systems with
viscoplastic constituents exhibiting heterogeneity at more than one, well-separated length-scales.
Semi-crystalline polymers, such as polyethylene, polypropylene, Nylon-6, etc., are prominent examples of two-scale
systems, and constitute the largest class of polymers used in technological applications. At the larger
length-scale, a semi-crystalline polymer is an aggregate of a large number of randomly distributed grains that, at the
smaller length scale, are made up of alternating layers of an amorphous and a crystalline phase, both of which
exhibit nonlinear material behavior. During processing, these materials are often subjected to large
deformations that may lead to highly anisotropic mechanical properties as a result of the evolution of the
underlying sub-structure.
Primarily motivated by applications to semi-crystalline polymers, this work develops general variational
methods for the estimation of the effective behavior of multi-scale viscoplastic composites. This general
theory is applied to several two-scale material systems with increasing degree of complexity and
sophistication. The predictions and some important features of these methods are first investigated in the
context of two-dimensional model problems. Then, the general variational methods are used to develop
homogenization-based constitutive models for the macroscopic response and texture evolution of
semi-crystalline polymers under arbitrary finite-strain loading histories. Finally, the theory is specialized to
two-scale polycrystals with granular structures at the meso-two-scale level and lamellar structures at the micro-two-scale
level. In this context, we model the macroscopic instantaneous plastic anisotropy of -TiAl-based
polysynthetically twinned crystals and the rolling textures of ( alpha+beta ) Ti alloys.
Degree Type
Dissertation
Degree Name
Doctor of Philosophy (PhD)
Graduate Group
Mechanical Engineering & Applied Mechanics
First Advisor
Pedro Ponte Castaneda
Multi-scale Composites, Homogenization, Finite Strains, Semi-crystalline Polymers, Fiber-reinforced
Composites, Instabilities
Subject Categories
Applied Mechanics
Evolution in Multi-Scale Viscoplastic Composites
Michalis Agoras
A Dissertation
in
MECHANICAL ENGINEERING AND APPLIED MECHANICS
Presented to the Faculties of the University of Pennsylvania in Partial Fulfillment of the Requirements for the
Degree of Doctor of Philosophy. 2010
Supervisor of Dissertation
Pedro Ponte Casta˜neda, Professor of
Mechanical Engineering and Applied Mechanics
Graduate Group Chairperson
Jennifer R. Lukes, Associate Professor of Mechanical Engineering and Applied Mechanics
Dissertation Committee
John L. Bassani, Professor of
Mechanical Engineering and Applied Mechanics
Prashant K. Purohit, Assistant Professor of Mechanical Engineering and Applied Mechanics
Pedro Ponte Casta˜neda, Professor of
Acknowledgments
I would like to especially thank the advisor of my thesis, Professor Pedro Ponte Casta˜neda, for his
guidance throughout the course of my dissertation and for his valuable research experience and
time that he shared with me. It is certainly a privilege working with one of the worlds leading
experts in the field of nonlinear homogenization.
I am especially indebted to my undergraduate advisor, Professor Nikolaos Aravas, for
introduc-ing me in the fascinatintroduc-ing world of research in solid mechanics and for his constant encouragement
thereafter. His lectures will always be a source of inspiration for me.
I gratefully thank Professor John Bassani and Professor Prashant Purohit for accepting to be
members of my dissertation committee and for their useful comments on my work.
I would also like to thank Dr. Oscar Lopez-Pamies, Dr. Vikranth Racherla and Dr. Ricardo
Lebensohn for their help in the research projects I was involved during these years. Special thanks
go to Dr. Ricardo Lebensohn for providing his VPSC code which proved particularly useful in the
core parts of this thesis.
I would like to express my deep gratitude to my colleague and friend Dr. Konstantinos Danas
for helping me in a variety of issues and also for our delightful conversations on political philosophy
and other matters. Many thanks go to the Ph.D. candidates and friends in the solid mechanics
lab who made my stay in Philadelphia easier and more pleasant.
Finally, let me express my deepest gratitude to my family for their constant support, care and
ABSTRACT
ON MACROSCOPIC CONSTITUTIVE RELATIONS
AND MICROSTRUCTURE EVOLUTION
IN MULTI-SCALE VISCOPLASTIC COMPOSITES
Michalis Agoras
Pedro Ponte Casta˜neda
The determination of the effective or macroscopic properties of composite materials from the
corresponding local properties of the constituent phases and the underlying sub-structure
consti-tutes the fundamental problem in Mechanics of Composites. This problem is motivated from the
remarkable physical observation that the constitutive properties of these materials appear to be
homogeneous or uniform at the length scale of practical applications, despite the sharp variation of
their local properties at the length scale of the heterogeneity and the fairly complex spatial
distri-bution of their phases. This dissertation is concerned with the macroscopic mechanical properties
of “multi-scale”viscoplastic composites, i.e., composite systems with viscoplastic constituents
ex-hibiting heterogeneity at more than one, well-separated length-scales. Semi-crystalline polymers,
such as polyethylene, polypropylene, Nylon-6, etc., are prominent examples of two-scale systems,
and constitute the largest class of polymers used in technological applications. At the larger
length-scale, a semi-crystalline polymer is an aggregate of a large number of randomly distributed
grains that, at the smaller length scale, are made up of alternating layers of an amorphous and
a crystalline phase, both of which exhibit nonlinear material behavior. During processing, these
materials are often subjected to large deformations that may lead to highly anisotropic mechanical
Primarily motivated by applications to semi-crystalline polymers, this work develops general
variational methods for the estimation of the effective behavior of multi-scale viscoplastic
compos-ites. This general theory is applied to several two-scale material systems with increasing degree
of complexity and sophistication. The predictions and some important features of these methods
are first investigated in the context of two-dimensional model problems. Then, the general
varia-tional methods are used to develop homogenization-based constitutive models for themacroscopic
response and texture evolution of semi-crystalline polymers under arbitrary finite-strain loading
histories. Finally, the theory is specialized to two-scale polycrystals with granular structures at
the meso-scale level and lamellar structures at the micro-scale level. In this context, we model the
Contents
Acknowledgements . . . iii
Abstract . . . iv
List of Tables . . . x
List of Figures . . . xi
1 Introduction 1 2 Theory 9 2.1 Sub-structural characterization of granular composites . . . 10
2.1.1 Single-scale systems . . . 11
2.1.2 Two-scale systems . . . 13
2.2 Sub-structural characterization of particulate composites. . . 18
2.2.1 Single-scale systems . . . 18
2.2.2 Two-scale systems . . . 20
2.3 Viscoplastic constitutive behavior. . . 23
2.4 Variational formulations of the homogenization problem . . . 24
2.4.1 Single-scale composites. . . 24
2.4.2 Two-scale composites . . . 26
2.5 Linear comparison composite methods for single-scale composites . . . 29
2.5.1 Secant method . . . 30
2.5.2 Tangent method . . . 33
2.5.3 Generalized-secant method . . . 35
2.5.4 Estimates for single-scale linear thermoelastic composites . . . 39
2.6 Secant method for two-scale composites . . . 42
2.6.1 Direct linearization scheme . . . 42
2.6.2 Sequential linearization scheme . . . 45
2.7 Tangent method for two-scale composites . . . 48
2.7.1 Direct linearization scheme . . . 48
2.7.2 Sequential linearization scheme . . . 51
2.8.1 Direct linearization scheme . . . 53
2.8.2 Sequential linearization scheme . . . 56
2.9 Concluding remarks . . . 59
3 Applications to 2-D model problems 62 3.1 Preliminaries . . . 63
3.2 Application to particulate composites—I . . . 65
3.2.1 Secant estimates for P1 . . . 67
3.2.2 Tangent second-order estimates for P1 . . . 68
3.2.3 Generalized-secant second-order estimates for P1 . . . 73
3.2.4 Results and discussion for P1 . . . 78
3.3 Application to particulate composites—II . . . 81
3.3.1 Secant estimates for P2 . . . 82
3.3.2 Tangent second-order estimates for P2 . . . 83
3.3.3 Generalized-secant second-order estimates for P2 . . . 86
3.3.4 Results and discussion for P2 . . . 88
3.4 Application to granular composites . . . 92
3.4.1 Secant estimates for G2 . . . 94
3.4.2 Tangent second-order estimates for G2 . . . 95
3.4.3 Generalized-secant second-order estimates for G2 . . . 96
3.4.4 Results and discussion for G2 . . . 97
3.5 Concluding remarks . . . 100
3.6 Appendix I. Two-phase single-scale linear thermoelastic composites . . . 102
3.7 Appendix II. Some useful relations . . . 104
4 Applications to semi-crystalline polymers 109 4.1 Idealizations and instantaneous effective behavior . . . 110
4.1.1 Sub-structural characterization . . . 112
4.1.2 Amorphous phase . . . 114
4.1.3 Crystalline phase . . . 117
4.1.4 Effective behavior . . . 119
4.2 Estimates for the instantaneous effective behavior. . . 120
4.3 Estimates for the evolution of the internal variables. . . 124
4.3.1 Morphological texture evolution . . . 124
4.3.2 Lamellar texture evolution. . . 125
4.3.3 Crystallographic texture evolution . . . 126
4.3.4 Macromolecular texture evolution: the back-stress tensor . . . 127
4.3.5 Evolution of the critical resolved shear stresses . . . 127
4.4.1 Self-consistent estimates for the granular composite . . . 129
4.4.2 Exact estimates for the lamellar grains. . . 130
4.5 Results and discussion . . . 133
4.5.1 On the choice of the model parameters. . . 134
4.5.2 Uniaxial compression. . . 142
4.5.3 Simple shear . . . 149
4.5.4 Uniaxial tension . . . 158
4.6 Concluding remarks . . . 164
4.7 Appendix I. Numerical aspects . . . 166
4.8 Appendix II. Material frame indifference . . . 170
5 Applications to two-scale polycrystals 174 5.1 Preliminary definitions . . . 175
5.1.1 Sub-structural characterization . . . 175
5.1.2 Constitutive relations for the single-crystals . . . 178
5.2 Estimates for the instantaneous effective behavior. . . 179
5.3 Estimates for the evolution of the sub-structure . . . 181
5.3.1 Morphological texture evolution . . . 182
5.3.2 Lamellar texture evolution. . . 182
5.3.3 Crystallographic texture evolution . . . 183
5.4 Plastic anisotropy of𝛾-TiAl-based PST alloys . . . 184
5.5 Texture evolution in (𝛼+𝛽) Ti alloys . . . 188
5.6 Concluding remarks . . . 190
6 Closure 192 A A general hyperelastic model for incompressible fiber-reinforced elastomers 198 A.1 Introduction. . . 198
A.2 Problem formulation . . . 200
A.2.1 Transverse Isotropy . . . 203
A.3 Second-order homogenization estimates . . . 204
A.3.1 Local and effective properties of the LCC . . . 205
A.3.2 Tangent second-order estimates . . . 206
A.3.3 Generalized second-order estimates . . . 208
A.4 A constitutive model for general loading conditions . . . 210
A.4.1 Comparisons with bounds and other estimates . . . 214
A.5 Results and discussion . . . 215
A.7 Appendix. Generalized second-order estimates for incompressible fiber-reinforced
rubbers under generalized plane-strain conditions . . . 223
B Onset of macroscopic instabilities in fiber-reinforced elastomers at finite strain229 B.1 Introduction. . . 229
B.2 Homogenization estimates for fiber-reinforced hyperelastic materials . . . 232
B.2.1 The estimate of Agoras et al. for generalized Neo-Hookean phases . . . 234
B.2.2 The estimate of Agoras et al. for Neo-Hookean phases . . . 236
B.2.3 The estimate of deBotton et al. for Neo-Hookean phases . . . 236
B.3 Onset of macroscopic instabilities . . . 237
B.4 Aligned loadings . . . 241
B.4.1 Axisymmetric shear . . . 241
B.4.2 Pure shear . . . 247
B.4.3 Asymptotic results in the limit of rigid fibers . . . 248
B.4.4 Comparisons with earlier results for laminates under pure shear loading . . 249
B.5 Non-aligned loadings . . . 251
B.5.1 Axisymmetric shear at an angle. . . 251
B.5.2 Pure shear at an angle . . . 253
B.5.3 Simple shear at an angle. . . 255
B.6 General loading conditions. . . 256
B.6.1 A closed-form analytical result for general loadings . . . 256
B.6.2 Transverse uniaxial tension . . . 257
B.7 Concluding remarks . . . 262
B.8 Appendix I. Exact results for the macroscopic behavior of Neo-Hookean laminates 264
B.9 Appendix II. Demonstration of the criticality expressions (B.47), (B.48), and (B.49) 266
List of Tables
4.1 The values of the material parameters in the strain-hardening relation (4.77) for the CRSSs 𝜏0(𝑟,𝑐𝑘 ) in the slip systems of the crystalline phase used in the calculations of the LCC
esti-mates of this section. The superscript “∗” indicates quantities determined experimentally
by Bartczak et al. [8]. . . 136
4.2 The values of material parameters defining the hyperelastic model (4.16) (with𝑀 = 3) for the back-stress tensor (4.15), used in the context of the various LCC estimates of Fig. 4.5.
The LCC estimates discussed in subsections 4.5.2, 4.5.3 and 4.5.4 have been computed by
using the set of values (c). . . 137
5.1 The critical resolved shear stresses 𝜏0𝑘 in the (matrix and tween) PST crystals, as
List of Figures
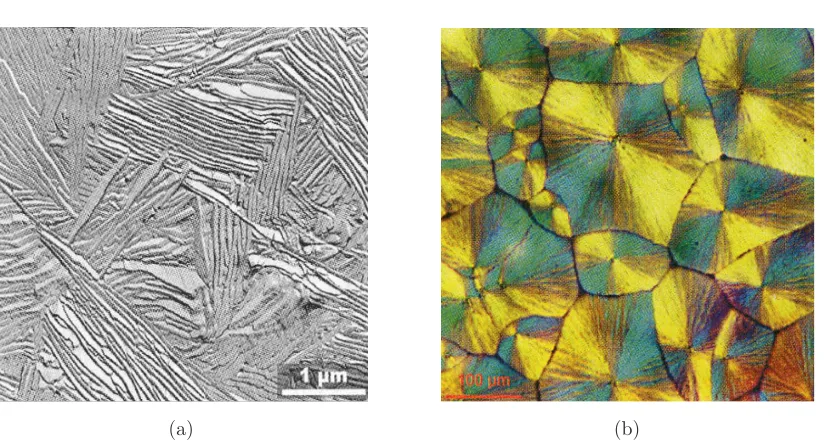
1.1 (a) TEM micrograph of “granular” microstructure in polyethylene crystallized at 130 C for 27 days. (b) Optical micrograph of “spherulitic” microstructure in a typical semi-crystalline
polymer (PPS). (Taken from Ref. [13].) . . . 2
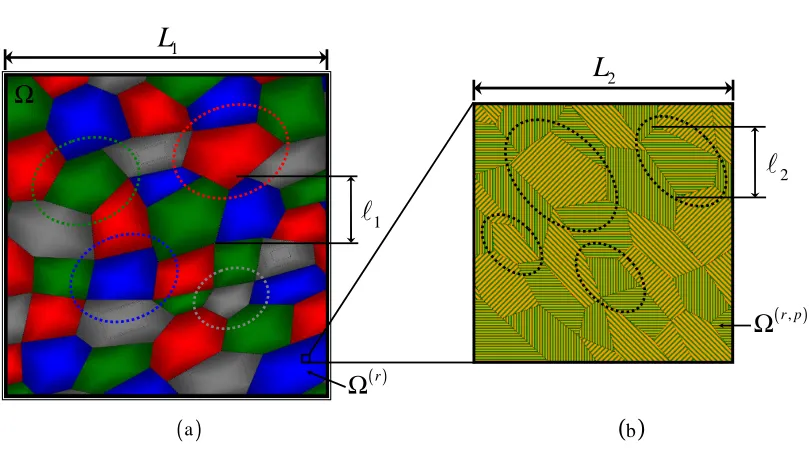
2.1 A two-scale granular composite with random distributions of ellipsoidal symmetry (dotted ellipses). (𝑎) Macroscopic RVE Ω: composite-grain families (distinguished by color). (𝑏)
Mesoscopic RVE of the composite-grain family𝑟: single-crystal orientations. . . 11
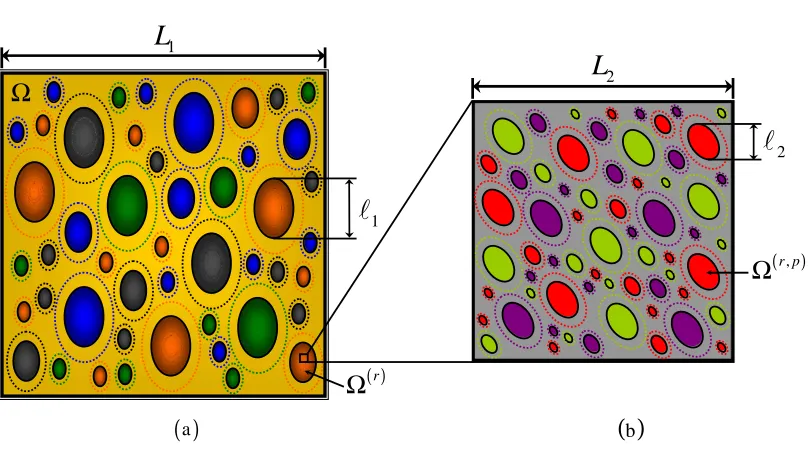
2.2 A two-scale particulate composite with random distributions of ellipsoidal symmetry
(dot-ted ellipses). (𝑎) Macroscopic RVE Ω: composite-inclusion families in a composite-matrix
(distinguished by color). (𝑏) Mesoscopic RVE of the composite-inclusion family𝑟:
homogeneous-inclusion families in a homogeneous-matrix. . . 18
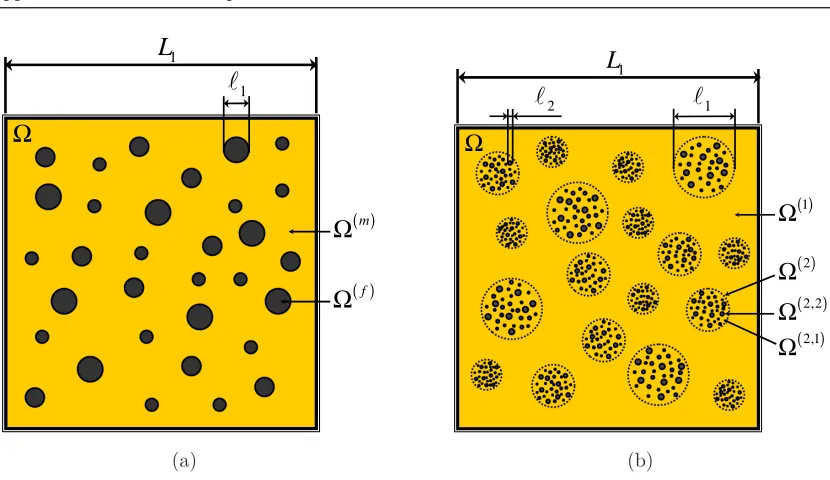
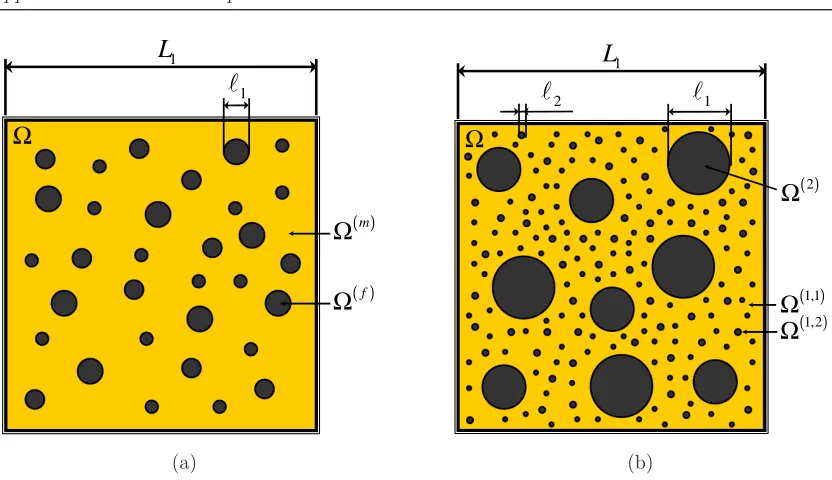
3.1 Schematic of rigidly-reinforced particulate systems. (a) Single-scale composite P0 with rigid-fiber concentration𝑐(𝑓)=∣Ω(𝑓)∣/∣Ω∣. (b)Two-scalecomposite P1 with (meso-scaleℓ
1)
composite-fiber concentration𝑐(2) =∣Ω(2)∣/∣Ω∣, (micro-scale ℓ
2) rigid-fiber concentration
𝑐(2,2)=∣Ω(2,2)∣/∣Ω(2)∣and overall rigid-fiber content𝑐(2)𝑐(2,2)≡𝑐(𝑓). . . 66
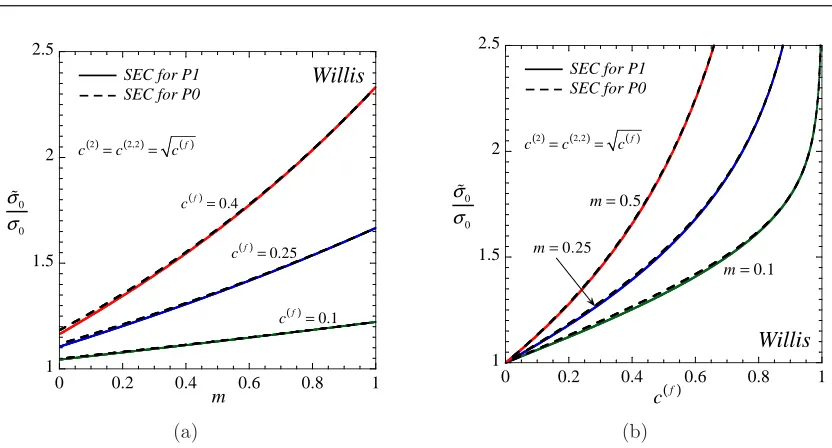
3.2 Comparison of the secant (SEC) bound (3.20) for a single-scale composite P0 (Fig. 3.1(a)), with rigid-fiber concentration 𝑐(𝑓), and the secant (SEC) bound (3.17) for a two-scale
composite P1 (Fig. 3.1(b)), with the same overall rigid-fiber content 𝑐(𝑓) = 𝑐(2)𝑐(2,2).
The corresponding normalized effective in-plane yield-stresses ˜𝜎0/𝜎0 are plotted (a) as a
function of the nonlinearity exponent𝑚= 1/𝑛for fixed values of𝑐(𝑓)= 0.1,0.25,0.4 and
3.3 Comparison of SLS (continuous thin lines) and DLS (continuous thick lines) estimates for the two-scale particulate composite P1 (Fig. 3.1(b)). Part (a) shows the SLS-GSO
estimate (3.54), with (3.51), and the DLS-GSO estimate (3.49) for the normalized effective
in-plane yield-stress ˜𝜎0/𝜎0as a function of the rate-sensitivity exponent𝑚= 1/𝑛for fixed
values of the total rigid-fiber concentration 𝑐(𝑓) = 𝑐(2)𝑐(2,2) = 0.1,0.25,0.4 in P1, with
𝑐(2) =𝑐(2,2) = √𝑐(𝑓); part (c) shows the same estimates for ˜𝜎
0/𝜎0 as a function of 𝑐(𝑓)
for the cases𝑚= 0.1,0.25,0.5. Parts (𝑏) and (𝑑) present the corresponding predictions of
the SLS-TSO estimate (3.44), with (3.39), and the DLS-TSO estimate (3.34), respectively.
GSO and TSO results corresponding to the special case𝑐(1)= 0 and𝑐(2,2)=𝑐(𝑓), i.e., the
case of the single-scale particulate composite P0 (Fig. 3.1(a)), have been included in the
relevant parts (dotted lines). . . 80
3.4 Schematic of rigidly-reinforced particulate systems. (a) Single-scale composite P0 with
rigid-fiber concentration𝑐(𝑓)=∣Ω(𝑓)∣/∣Ω∣. (b)Two-scale composite P2 with meso-scaleℓ 1
rigid-fiber concentration𝑐(2) =∣Ω(2)∣/∣Ω∣, micro-scaleℓ
2 rigid-fiber concentration 𝑐(1,2)=
∣Ω(1,2)∣/∣Ω(1)∣and overall rigid-fiber content 1−(1−𝑐(2))(1−𝑐(1,2))≡𝑐(𝑓). . . . . 82
3.5 Comparison of the secant (SEC) bound (3.20) for a single-scale composite P0 (Fig. 3.1(a)), with rigid-fiber concentration 𝑐(𝑓), and the secant (SEC) bound (3.62) for a two-scale
composite P2 (Fig. 3.4(b)), with the same overall rigid-fiber content𝑐(𝑓)= 1−(1−𝑐(2))(1−
𝑐(1,2)). The corresponding normalized effective in-plane yield-stresses ˜𝜎0/𝜎0are plotted (a)
as a function of the nonlinearity exponent𝑚= 1/𝑛for fixed values of𝑐(𝑓)= 0.1,0.25,0.4
and (b) as a function of𝑐(𝑓) for fixed values of𝑚= 0.1,0.25,0.5. . . . . 89
3.6 The effect of the meso-scale ℓ1 and micro-scale ℓ2 rigid-fiber contents 𝑐(2) and 𝑐(1,2), re-spectively, on the overall response of the two-scaleparticulatecomposite P2 (Fig. 3.4(b)).
Predictions of the (a) DLS-GSO estimate (3.81) and (b) DLS-TSO estimate (3.74) for the
normalized effective in-plane yield-stress ˜𝜎0/𝜎0are plotted for the fixed values𝑚= 0.1,0.25
of the nonlinearity exponent 𝑚 = 1/𝑛as functions of the total rigid-fiber concentration
𝑐(𝑓)= 1−(1−𝑐(2))(1−𝑐(1,2)) for the combinations𝑐(2)=𝑐(1,2),𝑐(2)= 3𝑐(1,2),𝑐(2)= 10𝑐(1,2)
(continuous thick lines) and𝑐(1,2)= 3𝑐(2),𝑐(1,2)= 10𝑐(2) (continuous thin lines), as well as
for the special case𝑐(2)= 0 or𝑐(1,2)= 0 (dotted lines), i.e., the case corresponding to the
3.7 Comparison of SLS (continuous thin lines) and DLS (continuous thick lines) estimates for the two-scale particulate composite P2 (Fig. 3.4(b)). Part (a) shows the SLS-GSO
estimate (3.84), with (3.85), and the DLS-GSO estimate (3.81) for the normalized effective
in-plane yield-stress ˜𝜎0/𝜎0as a function of the rate-sensitivity exponent𝑚= 1/𝑛for fixed
values of the total rigid-fiber concentration𝑐(𝑓)= 0.1,0.25,0.4 in P2, with𝑐(2) =𝑐(1,2)=
1−√1−𝑐(𝑓); part (c) shows the same estimates for ˜𝜎
0/𝜎0as a function of𝑐(𝑓)for the cases
𝑚= 0.1,0.25,0.5. Parts (𝑏) and (𝑑) present the corresponding predictions of the SLS-TSO
estimate (3.78), with (3.79), and the DLS-TSO estimate (3.74), respectively. GSO and
TSO results corresponding to the special case𝑐(2) = 0 and𝑐(1,2)=𝑐(𝑓) (or𝑐(1,2)= 0 and
𝑐(2) =𝑐(𝑓)), i.e., the case of the single-scale particulate composite P0 (Fig. 3.4(a)), have
been included in the relevant parts (dotted lines). . . 91
3.8 Schematic of rigidly-reinforcedgranularsystems. (a)Single-scalecomposite G0 with
rigid-phase concentration 𝑐(𝑓) = ∣Ω(𝑓)∣/∣Ω∣. (b) Two-scale composite G2 with meso-scale ℓ 1
rigid-phase concentration𝑐(2)=∣Ω(2)∣/∣Ω∣, micro-scaleℓ
2rigid-phase concentration𝑐(1,2)=
∣Ω(1,2)∣/∣Ω(1)∣and overall rigid-phase content 1−(1−𝑐(2))(1−𝑐(1,2))≡𝑐(𝑓). . . . . 93
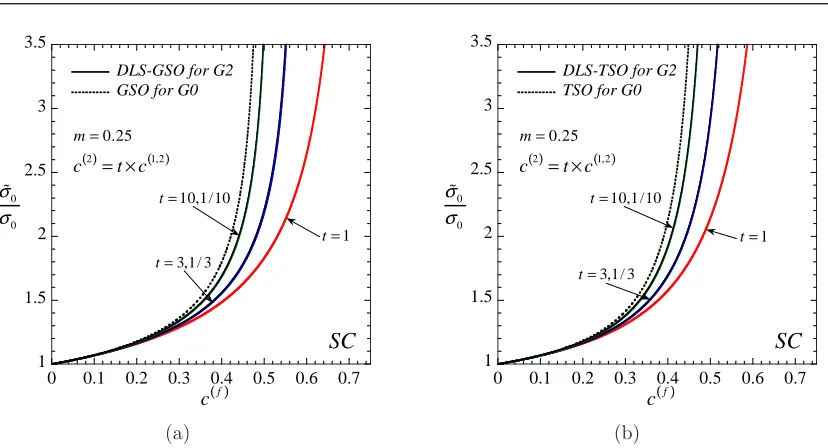
3.9 The effect of the meso-scaleℓ1and micro-scaleℓ2rigid-phase contents𝑐(2)and𝑐(1,2), respec-tively, on the overall in-plane response of the two-scalegranularcomposite G2 (Fig. 3.8(b)).
Predictions of the (a) DLS-GSO estimate (3.81) and (b) DLS-TSO estimate (3.74) for the
normalized effective in-plane yield-stress ˜𝜎0/𝜎0 are shown for the fixed value 𝑚 = 0.25
of the nonlinearity exponent𝑚= 1/𝑛 as functions of the total rigid-phase concentration
𝑐(𝑓)= 1−(1−𝑐(2))(1−𝑐(1,2)) for the combinations𝑐(2)=𝑐(1,2),𝑐(2)= 3𝑐(1,2),𝑐(2)= 10𝑐(1,2)
(continuous thick lines) and𝑐(1,2)= 3𝑐(2),𝑐(1,2)= 10𝑐(2) (continuous thin lines), as well as
for the special case𝑐(2)= 0 or𝑐(1,2)= 0 (dotted lines), i.e., the case corresponding to the
single-scalegranular composite G0 (Fig. 3.8(a)). . . 98
3.10 Comparison of SLS (continuous thin lines) and DLS (continuous thick lines) estimates
for the two-scale granular composite G2 (Fig. 3.8(b)). Part (a) shows the SLS-GSO
estimate (3.84), with (3.85), and the DLS-GSO estimate (3.81) for the normalized effective
in-plane yield-stress ˜𝜎0/𝜎0as a function of the rate-sensitivity exponent𝑚= 1/𝑛for fixed
values of the total rigid-phase concentration𝑐(𝑓)= 0.1,0.25,0.4 in G2, with𝑐(2)=𝑐(1,2)=
1−√1−𝑐(𝑓); part (c) shows the same estimates for ˜𝜎0/𝜎0as a function of𝑐(𝑓)for the cases
𝑚= 0.1,0.25,0.5. Parts (𝑏) and (𝑑) present the corresponding predictions of the SLS-TSO
estimate (3.78), with (3.79), and the DLS-TSO estimate (3.74), respectively. GSO and
TSO results corresponding to the special case𝑐(2) = 0 and𝑐(1,2)=𝑐(𝑓) (or𝑐(1,2)= 0 and
𝑐(2) =𝑐(𝑓)), i.e., the case of the single-scale granular composite G0 (Fig. 3.8(a)), have
3.11 Comparison of SLS (continuous thin lines) and DLS (continuous thick lines) estimates for the two-scalegranular composite G2 (Fig. 3.8(b)) in the ideally plastic limit𝑚= 0.
(a) SLS-GSO and DLS-GSO estimates for the normalized effective in-plane yield-stress
˜
𝜎0/𝜎0 as a function of the total rigid-phase concentration 𝑐(𝑓), with 𝑐(2) =𝑐(1,2) = 1−
√
1−𝑐(𝑓). (b) Corresponding SLS-TSO and DLS-TSO results. The associated results for
the single-scale composite G0 of Fig. 3.8(𝑎) are also shown (dotted lines). In addition, the
corresponding secant (SEC) upper bounds for G2 and G0 are included. . . 100
4.1 Schematic illustration of the mapping of a semi-crystalline polymer from the reference (Parts (a) and (b)) to the current (Parts (c) and (d)) configuration during an arbitrary
finite deformation process prescribed through the macroscopic deformation gradientF(𝑡),
with𝑡standing for the time variable. At the meso-structural level (Parts (a) and (c)), the
material consists of a large number𝑁of grain-families distributed randomly withisotropic
symmetry in the reference configuration (dotted circles in Part (a)) which evolves into
ellipsoidalsymmetry in the current configuration (dotted ellipses in Part (c)). At the
micro-structural level (Parts (b) and (d)), the grains are taken to be lamellar composites consisting
of alternating layers of an amorphous and a crystalline phase; both the orientation of the
lamellar grains—defined by the vectorsn(𝑟) normal to the layers—and the orientation of
the crystals—defined by the associated lattice vectorsa(𝑟),b(𝑟) andc(𝑟)—evolve in time. 111
4.2 Physical description of the back-stress tensorT𝑑in principal stress space, where𝑡𝑖and𝜆𝑖
denote the principal values ofT𝑑and the principal stretches, respectively, and𝜃𝑔 denotes
the glass transition temperature of the polymer. (reproduced from Boyce [14]). . . 115
4.3 The initial crystallographic and lamellar texture in the 500-grain composite system used
in the calculations of the LCC estimates of this section. Parts (a), (b) and (c) show
respectively the equal area projections of the (100), (010) and (001) plane poles, i.e., the
crystallographic axes a(𝑟), b(𝑟) and c(𝑟), respectively. Part (d) shows the corresponding
representation of the lamination orientationsn(𝑟). . . . 135
4.4 Left: Plots of the strain hardening relation (4.77) for the CRSSs 𝜏0(𝑘𝑟,𝑐) as functions of the deformation measure Γ(𝑟,𝑐) for the values of the material parameters of Table 4.1.
Right: Response of the homogeneous hyperelastic material (4.16) under axisymmetric shear
compression—i.e., forF= diag{𝜆−1/2, 𝜆−1/2, 𝜆}with𝜆 <1—for the three different sets of
material parameters (a), (b) and (c) of Table 4.2; the equivalent stress𝑇𝑒≡
√
3T𝑑⋅T𝑑/2
is plotted as a function of the equivalent strain 𝜀𝑒 ≡
√
2𝜀⋅𝜀/3, with T𝑑 and 𝜀 defined
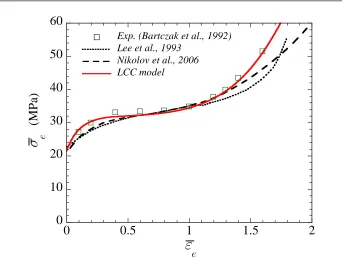
4.5 Fitting the LCC model to the experimental data of Bartczak et al. [10] for uniaxial compression of HDPE. The dotted curves correspond to constant CRSSs𝜏0(𝑟,𝑐𝑘 )=𝜏0𝑘 and
the continuous curve corresponds to 𝜏0(𝑘𝑟,𝑐) given by (4.77), using the relevant material
parameters of Table 4.1. The estimates (a), (b) and (c) make use of the respective sets of
values (a), (b) and (c) of Table 4.2 for the elastic properties of the amorphous phase and
the estimate (d) makes use of the set of values (c) of Table 4.2. . . 139
4.6 LCC estimates for the macroscopic stress-strain response of HDPE under simple shear and uniaxial tension loadings, corresponding to different values of the material parameters of the
phases. The dotted curves correspond to constant CRSSs𝜏0(𝑟,𝑐𝑘 )=𝜏0𝑘 and the continuous
curve corresponds to𝜏0(𝑘𝑟,𝑐)given by (4.77), using the relevant material parameters of Table
4.1. The estimates (b) and (c) make use of the respective sets of values (b) and (c) of Table
4.2 for the elastic properties of the amorphous phase and the estimate (d) makes use of
the set of values (c) of Table 4.2. . . 140
4.7 Macroscopic response of HDPE under uniaxial compression at a constant deformation rate 𝐷33=−10−3𝑠−1. Comparison of the LCC estimate (4.80), the estimate of Lee et al. [80]
and the estimate of Nikolov et al. [110] with the corresponding experimental results of
Bartczak et al. [10]. The applied equivalent stress measure𝜎𝑒 is plotted as a function of
the applied equivalent strain measure𝜀𝑒, with𝜎𝑒 and𝜀𝑒defined by (4.112)1 and (4.112)2,
respectively. . . 143
4.8 Morphological texture evolution in HDPE under uniaxial compression as predicted by the LCC model. The maximum𝑤max and minimum𝑤min aspect ratios of the distributional
ellipsoid (4.8), defined respectively by (4.113)1 and (4.113)2, are plotted as functions of the
applied equivalent strain𝜀𝑒. Results are shown both for the 500-grain system of Fig. 4.3
and also for a refined 1000-grain system. For comparison, the aspect ratio𝑤max=𝑤min=
Exp[3𝜀e/2] corresponding to a perfectly transversely isotropic material is also shown. . . 144
4.9 Lamellar texture evolution in HDPE under uniaxial compression as predicted by the LCC model. Equal area projection figures of the lamination orientations n(𝑟) are shown at
various values of the applied equivalent strain 𝜀𝑒. The direction of compression is along
the 3−axis. . . 145
4.10 Crystallographic texture evolution in HDPE under uniaxial compression as predicted by
the LCC model. Equal area projection figures of the (001) plane poles are shown at various
values of the applied equivalent strain𝜀𝑒. The direction of compression is along the 3−axis.146
4.11 Crystallographic texture evolution in HDPE under uniaxial compression. The equal area projection figures of the (100) and (010) plane poles predicted by the LCC model are
compared with the corresponding pole intensity plots measured experimentally by Bartczak
et al. [10] at various values of the applied equivalent strain𝜀𝑒. The direction of compression
4.12 Crystallographic texture evolution in HDPE under uniaxial compression. The equal area projection figures of the {110} and {011} plane poles predicted by the LCC model are
compared with the corresponding pole intensity plots measured experimentally by Bartczak
et al. [10] at various values of the applied equivalent strain𝜀𝑒. The direction of compression
is along the 3−axis. . . 149
4.13 The effect of the deformation rate𝐷33 on the LCC estimate (4.80) for the macroscopic response of HDPE under uniaxial compression. The applied equivalent stress𝜎𝑒is plotted
as a function of the applied equivalent strain𝜀𝑒 for 𝐷33 =−10−4𝑠−1,𝐷33 =−10−3𝑠−1
and𝐷33=−10−2𝑠−1. . . 150
4.14 Macroscopic response of HDPE under simple shear at a constant shear rate ˙𝛾= 10−3𝑠−1. Comparison of the LCC estimate (4.80), the estimate of Lee et al. [80] and the estimate
of Nikolov et al. [110] with the corresponding experimental results of Bartczak et al. [9]
and Dahoun [24]. The applied equivalent stress measure 𝜎𝑒 is plotted as a function of
the applied equivalent strain measure𝜀𝑒, with𝜎𝑒 and𝜀𝑒defined by (4.114)1 and (4.114)2,
respectively. . . 151
4.15 Morphological texture evolution in HDPE under simple shear as predicted by the LCC model. (a) The aspect ratio 𝑤=𝜆max/𝜆min, with𝜆max and 𝜆max being respectively the
maximum and minimum applied stretches, is plotted as a function of the applied amount
of shear 𝛾. (b) The angle𝜃𝐸 = tan−1(2/𝛾)/2 between the major principal axis and the
shear directione2 is plotted as a function of the applied amount of shear𝛾. . . . 152
4.16 Lamellar texture evolution in HDPE under simple shear as predicted by the LCC model.
Stereographic projection figures of the lamination orientationsn(𝑟) are shown at various
values of the applied amount of shear𝛾. The direction of shear is indicated by the arrows. 153
4.17 Crystallographic texture evolution in HDPE under simple shear. Stereographic projection
figures of the (001) and (100) plane poles predicted by the LCC model are compared with
corresponding experimental results by Bartczak et al. [9]. The theoretical predictions are
presented below the corresponding experimental results. The direction of shear is indicated
by the arrows. . . 155
4.18 Crystallographic texture evolution in HDPE under simple shear. Stereographic projection figures of the (010) and{110}plane poles predicted by the LCC model are compared with
corresponding experimental results by Bartczak et al. [9]. The theoretical predictions are
presented below the corresponding experimental results. The direction of shear is indicated
by the arrows. . . 156
4.19 The effect of the shear rate ˙𝛾 on the LCC estimate (4.80) for the macroscopic response of
HDPE under simple shear. The applied equivalent stress𝜎𝑒is plotted as a function of the
4.20 Macroscopic response of HDPE under uniaxial tension at a constant deformation rate 𝐷33 = 10−3𝑠−1. Comparison of the LCC estimate (4.80), the estimate of Lee et al. [80]
and the estimate of Nikolov et al. [110] with the experimental results of G’Sell and Jonas
[46] and Hiss et al. [54]. The applied equivalent stress measure𝜎𝑒is plotted as a function of
the applied equivalent strain measure𝜀𝑒, with𝜎𝑒 and𝜀𝑒defined by (4.112)1 and (4.112)2,
respectively. . . 159
4.21 Morphological texture evolution in HDPE under uniaxial tension as predicted by the LCC model. The maximum𝑤maxand minimum𝑤minaspect ratios of the distributional ellipsoid
(4.8), defined respectively by (4.116)1 and (4.116)2, are plotted as functions of the applied
equivalent strain𝜀𝑒. Results are shown both for the 500-grain system of Fig. 4.3 and also for
a refined 1000-grain system. For comparison, the aspect ratio𝑤max =𝑤min = Exp[3𝜀e/2]
corresponding to a perfectly transversely isotropic material is also shown. . . 160
4.22 Lamellar texture evolution in HDPE under uniaxial tension as predicted by the LCC model. Stereographic projection figures of the lamination orientationsn(𝑟) are shown at various
values of the applied equivalent strain𝜀𝑒. The direction of tension is along the 3−axis. . 161
4.23 Crystallographic texture evolution in HDPE under uniaxial tension as predicted by the LCC model. Stereographic projection figures of the (001), (100), (010) and{011}plane
poles are shown at various values of the applied equivalent strain 𝜀𝑒. The direction of
tension is along the 3−axis. . . 162
4.24 Crystallographic texture in the HDPE specimen used by Li et al. [83] in their uniaxial tension test. The corresponding stereographic projection figures of the (001), (100) and
(010) plane poles are shown in the undeformed and deformed to 𝜀𝑒 = 2.1 sample, after
relaxation. The direction of tension is normal to the plane shown. . . 163
4.25 The effect of the deformation rate𝐷33 on the LCC estimate (4.80) for the macroscopic
response of HDPE under uniaxial tension. The applied equivalent stress 𝜎𝑒 is plotted as
a function of the applied equivalent strain 𝜀𝑒 for 𝐷33 = 10−4𝑠−1, 𝐷33 = 10−3𝑠−1 and
𝐷33= 10−2𝑠−1. . . 164
5.1 Schematic illustration of the mapping of a two-scale polycrystal from the reference (Parts
(a) and (b)) to the current (Parts (c) and (d)) configuration during an arbitrary finite
deformation process prescribed through the macroscopic deformation gradientF(𝑡), with
𝑡 standing for the time variable. At the meso-structural level (Parts (a) and (c)), the
material consists of a large number 𝑁 of composite-grain-families distributed randomly
with ellipsoidal symmetry (dotted ellipses in Parts (a) and (c)), the specific features of
which change from the reference to the current configuration. At the micro-structural level
(Parts (b) and (d)), the composite-grains have a lamellar structure consisting of alternating
layers of two different single-crystal-grains; both the orientation of the lamellar grains—
defined by the vectorsn(𝑟) normal to the layers—and the orientation of the crystals evolve
5.2 (a) The matrix-twin lamellar structure used to model a𝛾-TiAl PST crystal. (b) Compar-ison of the laminate model (Part (a)) predictions for the normalized yield stress𝜏˜𝜙/˜𝜏90𝑜,
given by 5.40, with the corresponding experimental results for a PST crystal subjected to
uniaxial compression as a function of the loading angle𝜙, defined in Part (a). (Reproduced
from Lebensohn et al. [79].) . . . 186
5.3 Equal area projection figures of the crystallographic {111} plane poles (Part (a)) and of the lamination orientationsn(𝑟)(Part (b)) in the as-cast sample of the PST polycrystal.. 187
5.4 Instantaneous plastic anisotropy of the textured PST polycrystal (see Fig. 5.3), subjected
to compression along an axis forming an angle𝜙with the axis𝑋3on the plane𝑋2−𝑋3(see
Fig. 5.3). The predictions of the SOE model (5.23) and those of the model of Lebensohn
[73] are compared with the corresponding experimental results (Lebensohn [73]). (a) The
effective yield stress ratio ˜𝜏𝜙/˜𝜏90𝑜 is shown as a function of the loading angle 𝜙. (b)
The corresponding ratios of the macroscopic deformation rate components𝐷11/𝐷33 and
𝐷22/𝐷33 are shown as a function of𝜙. . . 188
5.5 Texture development in the (𝛼+𝛽) Ti alloy under rolling, as predicted by the SOE model.
Equal area projection figures are shown for the (0001) basal plane poles of the𝛼-phase,
the{110}plane poles of the𝛽-phase and the lamination orientationsn(𝑟). In these figures,
RD and TD indicate the rolling and the transverse direction, respectively. . . 189
A.1 The GSO estimate (A.28) for the effective stored-energy𝜙ˆof a fiber-reinforced elastomer with compressible Gent phases subjected to anFof the form (A.11), as a function of the
loading parameterℓ, for various values of the invariant𝜓𝛾. . . 211
A.2 The GSO (A.28) and TSO (A.19) estimates for the effective stored-energy 𝜙ˆ of fiber-reinforced elastomers with compressible Gent phases subjected to antiplane combined with
axisymmetric shear loadings, as a function of the loading parameterℓ, for𝜅(1)=𝜅(2)= 10
and 𝜅(1) =𝜅(2) = 1000. The corresponding incompressible TSO estimate (A.26) is also
shown. . . 212
A.3 Second-order estimates (SOE) for the effective response of a fiber-reinforced elastomer with incompressible Neo-Hookean phases under the three different modes of shear. The results
are shown as a function of the corresponding amount of shear 𝛾𝑎,𝛾𝑝 and 𝛾𝑛. (𝑎) The
energiesΨ(ˆ 𝛾𝑎,0,0),Ψ(0ˆ , 𝛾𝑝,0) andΨ(0ˆ ,0, 𝛾𝑛), normalized by𝜇(1). (𝑏) The corresponding (non-zero) normalized stresses𝑆𝑎(𝛾𝑎,0,0),𝑆𝑝(0, 𝛾𝑝,0) and𝑆𝑛(0,0, 𝛾𝑛). . . 217
A.4 Second-order estimates (SOE) for the effective response of a fiber-reinforced elastomer with incompressible Gent phases under the three different modes of shear. The results
are shown as a function of the corresponding amount of shear 𝛾𝑎,𝛾𝑝 and 𝛾𝑛. (𝑎) The
energiesΨ(ˆ 𝛾𝑎,0,0),Ψ(0ˆ , 𝛾𝑝,0) andΨ(0ˆ ,0, 𝛾𝑛), normalized by𝜇(1). (𝑏) The corresponding
A.5 (𝑎) SOE predictions for the macroscopic stresses 𝑆𝑝(0, 𝛾𝑝,0) and 𝑆𝑛(0,0, 𝛾𝑛) of
fiber-reinforced elastomers made out of an incompressible Gent matrix and Neo-Hookean fibers,
with various values of𝜇(2), as functions of the amounts of shear𝛾𝑝and𝛾𝑛, respectively. (𝑏)
SOE predictions for the lock-up limits𝛾𝑙𝑜𝑐𝑘
𝑎 ,𝛾𝑙𝑜𝑐𝑘𝑝 and𝛾𝑙𝑜𝑐𝑘𝑛 of axisymmetric, in-plane and
antiplane shear loadings, respectively—applied to composites with incompressible Gent
constituents—as functions of the lock-up parameter of the fibers,𝐽𝑚(2), for various values
of𝑐0 and𝐽𝑚(1)= 30. . . 219
A.6 (𝑎) Combined loading of the composite considered in Fig. A.3. The predictions of the
SOE for the stresses √3𝑆𝑎(𝛾𝑎, 𝛾𝑝, 𝛾𝑛), √
3𝑆𝑝(𝛾𝑎, 𝛾𝑝, 𝛾𝑛) and √
3𝑆𝑛(𝛾𝑎, 𝛾𝑝, 𝛾𝑛),
normal-ized by𝜇(1), are plotted as functions of the loading parameter𝛾
𝑒. (𝑏) Combined loading
of a fiber-reinforced elastomer with incompressible Gent phases. The normalized stresses
𝑆𝑎(𝛾𝑎, 𝛾𝑝, 𝛾𝑛),𝑆𝑝(𝛾𝑎, 𝛾𝑝, 𝛾𝑛) and𝑆𝑛(𝛾𝑎, 𝛾𝑝, 𝛾𝑛), as predicted by the SOE and the Voigt
upper bound (distinguished by a superscript “𝑉”), are shown as functions of the loading
parameter𝛾𝑒. . . 220
A.7 (𝑎) The predictions of the SOE, BHS and GPM models for the effective in-plane shear
response of an elastomer reinforced withrandomly distributed, rigid fibers are compared
with corresponding experimental (Exp) results forperiodicallydistributed fibers. The SOE
makes use of an OLP model for the matrix. (𝑏) The OLP and Neo-Hookean models, used to
characterize the matrix material in part (𝑎), are compared with corresponding experimental
data for uniaxial tension (ℓ=𝜆−1, with 𝜆 being the tensile stretch) andsimple shear
(ℓ=𝛾, with𝛾 denoting the amount of shear) tests. . . 221
B.1 (a) Schematic of a fiber-reinforced composite in the undeformed configuration Ω0, where
the initial fiber direction is given by the unit vectorN. (b) Corresponding schematic of
a laminate with lamination direction N. The characteristic lengths of the macroscopic
specimen,𝐿, and of the fibers (or layers),𝑑, are assumed to be well separated in the sense
that𝐿≫𝑑. . . 233
B.2 (𝑎) Schematic of a fiber-reinforced material subjected to aligned axisymmetric shear. (𝑏) Illustration of the critical pair of orthogonal vectors, v𝑐𝑟 and u𝑐𝑟, for which the overall
response of the material loses strong ellipticity. . . 242
B.3 Onset of macroscopic instabilities in fiber-reinforced materials with Neo-Hookean matrix and fiber phases subjected to aligned axisymmetric shear (AXS) and pure shear (PS)
loading conditions. The critical stretch𝜆𝑐𝑟(a) for fiber-to-matrix contrasts𝑡=𝜇(2)/𝜇(1)=
20, as a function of the volume fraction of fibers𝑐0, and (b) for 𝑐0= 0.3, as a function of
𝑡. The critical stress𝑆𝑐𝑟, normalized by 𝜇(1), corresponding to (a) and (b) are shown in
(c) and (d), respectively. These results are compared with theapproximateresult of Rosen
(1965), and theexactresult of Triantafyllidis and Maker (1985) for laminates (Lam) under
B.4 Onset of macroscopic instabilities in fiber-reinforced materials with Gent phases subjected toaligned axisymmetric sheardeformations (B.23), as given by expression (B.24). Results
are shown for fiber-to-matrix contrasts𝑡=𝜇(2)/𝜇(1)= 2,5,20,and volume fraction of the
fibers𝑐0 = 0.2. (a) The critical stretch 𝜆𝑐𝑟 for a fixed value of the lock-up parameter of
the matrix,𝐽𝑚(1)= 100, as a function of𝐽𝑚(2). (b) The critical stretch𝜆𝑐𝑟 for a fixed value
of𝐽𝑚(2)= 100, as a function of𝐽𝑚(1). . . 246
B.5 Onset of macroscopic instabilities in fiber-reinforced materials with Neo-Hookean matrix and fiber phases subjected tonon-aligned loadings: (a)axisymmetric shear, and (b)pure
shear. The critical stretch𝜆𝑐𝑟is shown for fiber-to-matrix contrasts𝑡=𝜇(2)/𝜇(1)= 2,5,20,
volume fraction of fibers𝑐0= 0.3, as a function of the angle of fiber misalignment Θ. . . 252
B.6 Onset of macroscopic instabilities in fiber-reinforced materials subjected to non-aligned
loadings. (a) Comparison ofpure shear failure surfaces for a Neo-Hookean fiber-reinforced
composite with Gent fiber-reinforced composites (right) and with a Neo-Hookean laminate
(left). All material systems have𝑐0= 0.3 and𝑡= 20, while for materials with Gent phases
results are shown for several values of 𝐽𝑚 (10, 20, 30, 50). (b) The critical stretch 𝛾𝑐𝑟
for Neo-Hookean matrix and fiber phases undersimple shear loading, as a function of the
fiber misalignment angle Θ, for𝑡=𝜇(2)/𝜇(1)= 2,5,20, and𝑐
0= 0.3. . . 254
B.7 Comparison of the predictions for macroscopic instabilities under transverse uniaxial tensile
(UT) loading for fiber-reinforced (with both Gent and Neo-Hookean phases) and laminates
(with Neo-Hookean phases). The critical stress𝑆𝑐𝑟, normalized by the shear modulus of
the matrix phase𝜇(1), for (a) fiber-to-matrix contrasts𝑡=𝜇(2)/𝜇(1)= 10,50, as a function
of the volume fraction of fibers𝑐0, and for (b)𝑐0= 0.1,0.3, as a function of𝑡. . . 260
B.8 Comparison of the predictions for macroscopic instabilities under transverse uniaxial ten-sion (UT) for fiber-reinforced (with both Gent and Neo-Hookean phases) with the general
analytical formula (B.1). The critical stretch𝜆𝑐𝑟𝑛 along the fiber direction for (a)
fiber-to-matrix contrasts𝑡=𝜇(2)/𝜇(1) = 10,50, as a function of the volume fraction of fibers𝑐 0,
Chapter 1
Introduction
Polymeric molecules, such as polyethylene, polypropylene, Nylon-6, etc., tend to form regular
crystal structures by folding along a well-defined direction, called the chain axis c, when cooled
from the molten state to room temperature. Interestingly, the cooling process in these materials,
unlike metals, does never result in 100% crystallization and the remaining part of the polymer
is found in a disordered or amorphous state. Hence, these materials are called semi-crystalline
polymers. The volume fraction of the crystalline phase, also called “crystallinity”, ranges from
10% to 90%. For example, the crystallinity of high-density polyethylene (HDPE) is about 70%
while that of Nylon-6 is 40%. At room temperature, the amorphous phase is “soft” and exhibits
primarily a rubbery elastic behavior, while the crystalline phase is “stiff” and, similar to metal
single crystals, may undergo large plastic deformations which are crystallographic in nature and
responsible for the high ductility of semi-crystalline polymers. It is important to remark that
the crystalline phase is practically inextensible along the chain axiscand, therefore, it possesses
only four independent slip-systems. Upon formation, the crystalline and amorphous regions in
a semi-crystalline polymer are in intimate contact with each other, forming alternating lamellar
layers whose thickness is of the order of nanometers. Typically, but not always, these lamellar
morphologies radiate out from various center-points in the composite and extend for lengths of
the order of micrometer, leading in this way to a special type of morphological structures called
spherulites (see Fig. 1.1(b)). In other cases, the lamellar stacks form grains that are randomly
oriented in space (see Fig. 1.1(a)). Finally, at the length-scale of structural applications, a
semi-crystalline polymer consists of a large number of spherulites or grains with a granular morphology
similar to that of metal polycrystals. Therefore, in the undeformed configuration, semi-crystalline
polymers are macroscopically isotropic and they exhibit heterogeneity at two well-separated
length-scales: the nanometer “layer” scale and the micrometer “grain” or “spherulite” scale.
Semi-crystalline polymers constitute the largest class of polymers used in structural
(a) (b)
Figure 1.1: (a) TEM micrograph of “granular” microstructure in polyethylene crystallized at 130 C for 27 days. (b) Optical micrograph of “spherulitic” microstructure in a typical semi-crystalline polymer (PPS).
(Taken from Ref. [13].)
are often subjected to large plastic deformation leading to increasingly anisotropic mechanical
properties. Over the past several decades, a large number of experimental studies has been
con-ducted towards the understanding of the various deformation mechanisms involved, and the
in-terplay between the evolution of the underlying sub-structure and the macroscopic response of
semi-crystalline polymers (see, e.g., the review article by Lin and Argon [84]). Many of these
stud-ies focus on HDPE, primarily because of its relatively simple sub-structure and its high crystallinity
(G’Sell and Jonas [46], Bartczak et al. [10], Galeski et al. [36], Bartczak et al. [9], Hiss et al. [54]).
Based on these investigations, it has been well-established that the plastic deformation of
semi-crystalline polymers involves, in general, three important types of texture (depending intrinsically
on the applied loading conditions): (𝑖) the crystallographic texture, resulting from the rotation of the lattice of the crystalline regions towards preferred orientations, (𝑖𝑖) the macromolecular texture, induced by the alignment of the polymer molecules in the amorphous regions along the direction
of the local maximum stretch and (𝑖𝑖𝑖) the lamellar texture, due to the preferential orientation of the layered structures underlying the spherulites or grains. The evolution of the sub-structure
at finite strains has, in turn, a crucial effect in the macroscopic response and overall stability of
semi-crystalline polymers. In this regard, it worth mentioning that HDPE specimens have been
reported (G’Sell and Jonas [46], Bartczak et al. [9], Hiss et al. [54]) to harden significantly when
subjected to uniaxial tension but not under simple shear. Moreover, for the case of simple shear
deformation into shear bands (approximately) parallel to the shear direction, which eventually
extends throughout the specimen leading to the complete destruction of the crystalline-amorphous
lamellar morphology. As observed from texture evolution micrographs, this type of deformation is
favored in lamellar stacks oriented perpendicular to the shear direction and occurs along the chain
axis c. The development of macroscopic shear bands has been attributed to the rotation of the
lamellar stacks towards a favorable orientation, as a result of the large applied plastic deformation.
In more recent work, Krumova et al. [67] investigated the development of chevron morphologies
in a variety of semi-crystalline polymers under tensile loadings and, based on additional results
from the literature, they draw some interesting conclusions. Specifically, these authors observed
that chevron folding is favorable for crystalline-amorphous lamellar stacks which are oriented
per-pendicular to the tensile loading direction and concluded that this deformation mechanism is very
common in semi-crystalline polymers and quite similar to the chevron patterns observed in other
material systems with lamellar morphologies, such as styrene-butadiene-styrene block copolymers
(see, e.g., Cohen et al. [19]). Furthermore, based on the observation that chevron patterns are
formed in some semi-crystalline polymers (e.g., high-density polyethylene) but not in others (e.g.,
low-density polyethylene), and similar observations for other material systems, Krumova et al.
[67] concluded that the prerequisites for chevron patterns formation in composite materials, in
general, are (𝑖) the existence of stacks of parallel lamellar morphologies in the sub-structure of the composite and (𝑖𝑖) a sufficiently high heterogeneity contrast between the constituent phases.
Over the past few decades, several attempts—with increasing levels of sophistication—have
been made to model the overall response and texture evolution in semi-crystalline polymers.
Build-ing on earlier work [10], Lee et al. [80] modeled the semi-crystalline polymer as a collection of a
large number of randomly oriented lamellar “composite inclusions” consisting of a crystalline and
an amorphous layer and, in order to deal with the lack of five independent slip-systems in the
crystalline phase, they made use of ahybridmodel combining Taylor and Sachs approximations—
i.e., the uniform stress and uniform stain-rate model, respectively—to account for the distribution
of the fields. In this work, it was further assumed that both phases exhibit a purely viscoplastic
behavior, and a back-stress tensor (given by the Arruda-Boyce model [6]) was introduced in order
to account for kinematic hardening in the amorphous phase. It should be emphasized that this
later feature turns out to provide a somewhat artificial but efficient way to account for the elastic
resistance of the amorphous phase, which is entropic in nature and it is due to the stretching of the
macromolecules. Despite the fact that the Taylor and Sachs models are known to yield very stiff
and very soft results, respectively, the Lee et al. [80] model managed to reproducequalitatively the
macroscopic stress-strain response of HDPE measured experimentally. An alternative approach,
ignoring the contribution of the amorphous phase, has been proposed by Dahoun et al. [25], who
[105,77] approach. More recently, van Dommelen et al. [146] extended the “composite inclusion”
model of Lee et al. [80] by incorporating finite elastic deformations for the amorphous and
crys-talline phase. This made it possible to account for the initial elastic modulus, yield stress and
post-yield behavior, as well as to handle cyclic loadings. Furthermore, a numerical model was
used by van Dommelen et al. [145] to investigate the mechanics of intra-spherulitic deformation
of polyethylene. Recently, Nikolov et al. [110] proposed another constitutive model for
semi-crystalline polymers assuming that the “spherulites” (or “grains”) are made out of alternating
layers of crystalline and amorphous viscoplastic materials, with the amorphous phase deforming
only under shear strains parallel to the crystalline layer and characterized by a special form of the
kinematic hardening model used by Lee et al. [80]. In the context of this model, the interactions
among the “grains” are accounted for by means of a self-consistent approximation, which is known
to be well-suited for granular systems. In general, the predictions of the Nikolov et al. [109] model
for the overall response and texture evolution of HDPE were found to be more accurate than the
corresponding predictions of the model of Lee et al. [80]. The most important disadvantage of
these models is probably their failure to capture the qualitative features of the effective response of
HDPE in certain cases, such as the dramatic softening observed under simple shear at large strains.
It should be remarked that none of the above theoretical works dealt with the macroscopic stability
of semi-crystalline polymers.
A common feature of all the aforementioned constitutive models is that they make use of
ap-proximate micromechanical models. A more proper treatment of the associated homogenization
problem for the semi-crystalline polymer is expected to lead to improved estimates for its effective
mechanical properties. This fact may be easily understood by noticing that the homogenization
problem for the semi-crystalline polymer determines, in principle, the local stress and deformation
fields developed in it under finite-strain loadings, which in turn determine completely the
over-all response, texture evolution and macroscopic stability of the material. Therefore, accounting
properly for the distribution of these fields in the composite is of crucial importance.
In this thesis, we propose to model the viscoplastic response of semi-crystalline polymers, by
accounting for the coupled effect of the crystalline and amorphous phases, as well as for fine
sub-structural information at both the levels of the layered grains and of the grained polycrystal.
Instead of making use of simplifying micromechanical approximations that are specific to these
material systems, we carry out a more rigorous and complete homogenization analysis, which
is able to better account for the internal stress and deformation fields and, consequently, for a
more accurate representation of the sub-structure (in a suitable statistical sense) and its evolution.
To this end, we propose a suitable generalization of the “generalized-secant second-order” (GSO)
“linear comparison” method—introduced by Ponte Casta˜neda [118] and further developed by Ponte
composites. This homogenization technique has been found to yield the most accurate estimates to
date for single-scale viscoplastic composites [119,65,22] and polycrystals [86,87], including texture
evolution [88,78]. In addition, we provide the corresponding generalizations of the earlier versions
of this method—also proposed by Ponte Casta˜neda [114,117]—known as the “secant” (SEC) and
“tangent second-order” (TSO) method. At this point, it is relevant to remark that applications
of the TSO method to two-scale thermoplastic elastomers with lamellar morphology have been
already considered in the works of Lopez-Pamies et al. [98] and Racherla et al. [132], where it was
shown that the TSO estimates are consistent with the development of macroscopic instabilities in
these composites when such instabilities are expected to occur from physical experience.
Chapter 2 of this thesis provides a precise statement of the homogenization problem for the
instantaneous effective behavior of a multi-scale viscoplastic composite and its (approximate)
treat-ment by means of the SEC, TSO and GSO linear comparison procedures. Composites with
ar-bitrary number of phases and general incompressible viscoplastic behavior of the constituents are
considered. For convenience, the relevant analysis is presented for two-scale systems, but its
gen-eralization to 𝑛-scale composites is straightforward. More specifically, in this chapter we discuss in detail the sub-structural characterization of random two-scale composites of both granular and
particulate type, and introduce the “separation of the length-scales hypothesis” characterizing the
heterogeneity of the materials of interest at both the “micro-scale” and the “meso-scale” level. For
example, in the case of the semi-crystalline polymer the micro-scale corresponds to the thickness
of a typical crystalline or amorphous layer and the meso-scale corresponds to the diameter of a
typical spherulite or grain. Based on these considerations, we present two equivalent variational
formulations of the associated homogenization problem linking the effective constitutive behavior
of a two-scale viscoplastic composite to the local material behavior of the phases and the
un-derlying sub-structure. The first formulation, referred to as the “direct approach”, is a one-step
procedure—analogous to the corresponding variational problem for a single-scale system—requiring
the determination of the local fields in the two-scale composite. The second formulation, referred
to as the “sequential approach”, is a two-step procedure which—by taking advantage of the
sepa-ration of the length-scales hypothesis for the meso-scale heterogeneous-phases (e.g., the grains in
the case of a semi-crystalline polymer)—“decomposes” the homogenization problem for a two-scale
composite into a sequence of corresponding problems for single-scale composites. Finally, the
ho-mogenization problem, as characterized by means of the aforementioned variational statements, is
treated approximately by means of the SEC, TSO and GSO procedures. These methods are first
presented in full detail in the context of single-scale composites and then generalized to two-scale
systems.
in chapter 2, we apply the SEC, TSO and GSO methods to simple material systems.
Two-scale composite systems of both the particulate and granular type are considered. Each material
is taken to be made out of a viscoplastic isotropic phase and a rigid phase. The associated
estimates for the corresponding single-scale composites are also discussed. The main objective
of these applications is to compare the estimates based on the direct variational approach with
the corresponding estimates based on the sequential variational approach, as well as to highlight
the differences in the effective behavior of a two-scale composite and a corresponding single-scale
composite. In this connection, it is remarked that although the direct and sequential variational
formulations constitute two equivalent statements of the associated homogenization problem, the
corresponding estimates obtained from these formulations—due to the approximations involved—
may differ from each other. The direct and sequential estimates generated by means of the SEC
method are found to be exactly identical. In addition, the results of this chapter indicate that,
in general, both the TSO and the GSO estimates of the direct type are in very good agreement
with the corresponding estimates of the sequential type for all values of the nonlinearity parameter
and for any concentration of the rigid phase, as they should. In turn, this observation provides
credence to these estimates and further encourages the application of the more general methods
of chapter2to two-scale composites with more complicated sub-structures.
In chapter4of this thesis, by means of the variational procedures of chapter2, we develop a
con-stitutive model for the finite-strain macroscopic response and texture evolution in semi-crystalline
polymers. Similar to the work of Lee et al. [80], both the amorphous and the crystalline phase in
these composites are assumed to be viscoplastic materials, while the effect of finite elastic strains
in the amorphous phase is also taken into account through a back-stress model. However, in our
approach we account for fine sub-structural information at both levels of the layered grains and
the grained polycrystal, as detailed above. Furthermore, making use of standard kinematical
ar-guments, in this chapter we also develop constitutive equations for the evolution of the underlying
sub-structure in the semi-crystalline polymer. This, in turn, allows consideration of finite-strain
loading processes. The predictions of this model both for the macroscopic response and texture
evolution in high-density polyethylene under uniaxial compression, simple shear and uniaxial
ten-sion loading histories are discussed in full detail. In each case, these estimates are compared with
relevant experimental results and the corresponding predictions of the models of Lee et al. [80] and
Nikolov et al. [110]. It is found that the predictions of the present model are in a good agreement
with the experimental results for all types of loadings considered and that they improve over the
predictions of the earlier models.
In chapter5, the GSO method of chapter2is specialized to two-scale polycrystals with granular
meso-structures and underlying lamellar micro-structures. This result is, in turn, used to study the
twinned grains. The lamellar grains in this material are modeled as stacks of matrix-twin pairs of
crystals. Both the matrix and the twin phase are made out of the same𝛾-TiAl tetragonal lattice structure, oriented differently in the two phases (see Lebensohn et al. [79]). These materials are
obtained by appropriate heat treatments or after casting, and are often highly anisotropic due to
the preferential orientation of the lamellar structures underlying the grains. The predictions of this
model are compared with available experimental data as well as with the corresponding predictions
of the model of Lebensohn [73]. Furthermore, constitutive equations for the evolution of the
sub-structure in the two-scale polycrystals of interest are also developed in this chapter. Making use
of this framework, we compute the textures developed in an initially un-textured (𝛼+𝛽) Ti alloy under rolling conditions. Each grain in this material has a lamellar structure of alternating 𝛼
and 𝛽 phase, with phase 𝛼 corresponding to an ℎ𝑐𝑝 single-crystal and phase 𝛽 corresponding to a 𝑏𝑐𝑐 single-crystal. The phases 𝛼 and 𝛽 are characterized by special crystallographic and morphological correlations (see Lebensohn and Canova [74]). It is remarked that single-scale
polycrystals made out of single-crystal grains, each of which is constituted either by 𝛼 or by 𝛽
phase, may also be constructed. It has been experimentally observed (Dunst et al. [31]) that
rolling of initially un-textured two-scale Ti alloy polycrystals at sufficiently large plastic strains
results in the development of a bi-modal texture of the basal plane normals of theℎ𝑐𝑝phase, with one of its components located around the normal and the other pointing towards the transverse
direction. The interesting point here is that, when specimens of initially un-textured single-scale
Ti alloy polycrystals are subjected to the same rolling conditions only the texture component of the
basal plane normals located around the normal direction is observed. Hence, these two problems
constitute especially well-suited tests for the predictive capabilities of the general theory proposed
in chapter2. It is found that the predictions of the GSO method for both problems are consistent
with the corresponding experimental results.
Finally, it is remarked that in the course of this dissertation the author has also been involved in
a research project—conducted in collaboration with Dr. Oscar Lopez-Pamies and Dr. Pedro Ponte
Casta˜neda—on the overall constitutive behavior and macroscopic failure of incompressible
fiber-reinforced elastomer with general hyperelastic phases. This work resulted in two corresponding
List of publications resulting from this dissertation work
1. Agoras, M., Lopez-Pamies, O., Pedro Casta˜neda, P., 2009. A general hyperelastic model for
incompressible fiber-reinforced elastomers. Journal of the Mechanics and Physics of Solids
57, 268–286.
2. Agoras, M., Lopez-Pamies, O., Pedro Casta˜neda, P., 2009. Onset of macroscopic instabilities
in fiber-reinforced elastomers at finite strain. Journal of the Mechanics and Physics of Solids