9
Optical Signal Quality Optimization by Adopting Spectral
Inversion at the Receiver of High-Speed
Optical Communication System
Hamidine Mahamadou
Dept. of Physics/Faculty of Sciences and Technics/University Dan Dicko Dankoulodo of Maradi, Republic of Niger
Abstract
In this paper a new approach of improving received optical signal quality utilizing Spectral Inversion (SI) technique outside the transmission link is investigated in long-haul intensity and phase modulated transmission systems using channel data rate up to 100 Gb/s. The approach is implemented using a module called Optical Signal Post-Optimization (OSPO) composed with an OPC-unit followed by Highly Nonlinear Fiber (HNLF) with high nonlinear coefficients. 100 Gb/s single channel was simulated with differential quadrature phase shift keying (DQPSK) where an increased in Q factor of the system with OSPO of 1.5 dB is observed at transmission lengths of 2000, 2500 and 3000 km. For 100 Gb/s 5 channels WDM the system Q factor improvement was about 1 dB at transmission lengths of 2000 and 2500 km. To ascertain the effectiveness of the method an experimental investigation was carried out using DPSK systems over 300 km transmission distance. Various results obtained showed an improvement of system Q factor of the order of 1 dB.
Keywords
DQPSK, Fiber impairments; Q factor; HNLF; Optimization; OSPO.
I. Introduction
One of the traditional methods for chromatic dispersion and nonlinear effects compensation in optical fiber transmission systems is based on optical phase conjugation. The ability of OPC to be transparent to the transmission bit rate and the modulation format make them to be attractive since they work in real time. The OPC modules have been successfully tested on transmission systems based on on-off keying (OOK) modulation formats by using either the traditional mid-span spectral-inversion (MSSI) approach [1-3] or, the mid-nonlinear temporal-inversion (MNTI) which is an innovative technique compare to the first [4-7]. The MSSI consist of placing the OPC in the mid-way of the link to compensate for both chromatic dispersion and the Kerr effects while the MNTI does not impose the exact position of the OPC and in this approach the OPC is mainly for compensation of the Kerr effects. Other method have been implemented for phase modulated (PM) transmission systems which consist of placing the OPC-unit at 2/3 of the total link length [8-10]. This method is refer to Gordon-Mollenauer Compensation (GMC) by P. Minzioni et al. [11].
Traditionally, a method to compensate nonlinear signal distortion in optical transmission systems is to position an OPC along the transmission line to reverse the sign of the nonlinear phase noise and as result this transmission impairment is optimally cancel at the receiver. But the OPC-unit placement approaches which are MSSI, MNTI or even the so-called GMC have the drawback of
limited flexibility due to their design which is imposed by the fiber type, the signal and the location imposed by the link length.
Recently some solutions have been proposed to amend this limitation of the OPC-device placement. Pelusi and Eggleton propose in their article a method which propagating the signal through an all-optical module outside the link to apply Tunable Nonlinear Distortion (TD) in combination with OPC [12]. The TD-OPC module modifies the field vector of a signal in the complex plane to acquire an opposite phase rotation to that produced in the fiber link, and thereby enable regeneration of the signal phase. To address the various disadvantages offer by mid link OPC technique and DBP, In this paper we investigate a method of optimizing received optical signal quality by a system utilizing Spectral Inversion (SI) mechanism through optical phase conjugation followed by a few meters of Highly Nonlinear Fiber (HNLF) to compensate for the nonlinearities and the residual dispersion along the transmission line and therefore post-optimizing the optical signal quality. The study will be carried through numerical and experimental analysis for systems employing phase modulation (PM) such as DPSK and DQPSK modulation formats with 40 and 100 Gb/s channel bit rate.
Section II of this paper will present a description and principles of operations of systems under study. The results analysis will be presented and discussed in section III. Section IV will conclude the article.
II. Systems Sets Up and Operating Principles
A. Simulation Set Up Description
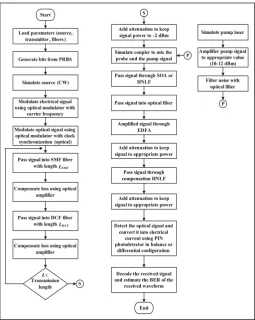
The schematic diagrams of the simulation set up of the systems under investigation are shown on Fig. 1. The simulation is run for a sequence length of 1024 bits with 32 samples per bit in order to ensure results accurate in commercial ‘Optisystem’ which uses split-step Fourier method of evaluation. The algorithm used in the simulation is described by the flow chart on Figure 3. The DQPSK transmitter is achieved with a parallel configuration as shown on Fig. 1. The signal from the continuous wave (CW) laser is modulated by the two nested Mach-Zehnder modulators (MZMs) driven by two 50 Gb/s pseudorandom bit sequence (PRBS) with data stream length of of 215-1.
Fig. 1: Schematic Diagram of System Under Investigation
Optical fiber loop consist of two Erbium-Doped Fiber Amplifier (EDFA) stages, standard single mode fiber (SSMF) followed by Dispersion Compensation Fiber (DCF). The parameters of the SMF and DCF are shown in Table 1. The loss in SMF and DCF in each span are compensated for by EDFA with a noise figure (NF) of 5 dB. To keep the input power into the DCF low such as to reduce the nonlinear effects, the value of the EDFA after the SMF was kept to a constant value of 16 dB.
Table 1: Fiber Parameters
fiber α(dB·km-1) D (ps/ km-nm) S (ps/km-nm2)
γ
(W-1 . km-1) Length(km)
SMF 0.2 16 0.058 1.3 100
DCF 0.5 −100 −0.34 5.0 16
HNLF 0.53 −12.7 0.012 21 0.2/0.5
At the receiver, the signal passes through an optical band pass filter with optical bandwidth frequency of at least equals the bit rate. The signal is detected by a one-bit differential optical delay Mach-Zehnder interferometer (MZI), and balanced receiver is adopted with two PIN detectors. Each PIN photodiode (PD) has responsive of 1 A/W and dark current = 0.1 nA. After detection, the signal is filtered by a 4th order Bessel low-pass filter; with
a cut-off frequency equal 0.75 bit rate and a depth of 100 dB. Thereafter, three regenerators are used to regenerate an electrical signal connected directly to the bit error rate (BER) analyzer, which is used as a visualizer to generate graphs and results, such as eye diagram, BER, Q value, eye opening, etc. For DQPSK system, the resulting signal is split to a pair of Mach-Zehnder delay interferometers (MZDIs) to perform the detection of the in-phase (I) and quadrature (Q) components as shown on Fig.1. Both I and Q components are afterward decoded using a bit error rate (BER) analyzer.
Fig. 2: OPC Set up
The output optical signal from the transmission link is optimized in the optical signal post-optimization module (OSPO) composed of an Optical Phase Conjugation (OPC) followed by about half a km of HNLF. The OPC is formed by a 0.2 km HNLF or an SOA with 0.15 mA injection current as shown on Fig. 1. The characteristics of the HNLF are the same given in Réf.[13] with large normal dispersion D = −12.7 ps/(nm km), dispersion slope S is 0.012 ps2/(nm km) and loss coefficient is α = 0.53 dB/km at
1550 nm. The nonlinear coefficient of the fiber γ is 21 km−1W−1.
The transmitted data signal from the optical link is mixed with the high power signal of the pump laser through a 3 dB coupler and afterward fed into HNLF1 or SOA to ensure a high FWM efficiency. To realize a good FWM efficiency, the pump signal is launched at very much stronger power than the data signal. The light signal power is kept to -2 dBm and 10 dBm for the pump signal power. The FWM process takes place in HNLF1 or SOA. Thus with the pump and the probe signals operating at 1551 nm and 1552 nm respectively, the conjugate signal generated will operate at 1550 nm. The conjugate signal spectrum is inverted from that of the input data signal. The EDFA and the Optical Band Pass Filter (OBPF) placed after the OPC module as shown in Fig.1 amplifies and filters the conjugate signal before feeding the signal in HNLF2. Due to the wavelength conversion that occurs, the sign of the Kerr effect, SPM in this case is inverted after the OPC. As a result the impairments that occur in the HNLF2 compensate the SPM effects that occur in the transmission link before the spectral inversion module.
Start
Load parameters (source, transmitter, fibers)
Generate bits from PRBS
Simulate source (CW)
Modulate electrical signal using optical modulator with
carrier frequency
Modulate optical signal using optical modulator with clock synchronization (optical)
Pass signal into SMF fiber with length LSMF
Compensate loss using optical amplifier
Pass signal into DCF fiber with length LDCF
Compensate loss using optical amplifier Transmission length L< S S
Add attenuation to keep signal power to -2 dBm
Simulate coupler to mix the probe and the pump signal
Pass signal through SOA or HNLF
Pass signal into optical fiber
Amplified signal through EDFA
Add attenuation to keep signal to appropriate power
Pass signal through compensation HNLF
Add attenuation to keep signal to appropriate power
Detect the optical signal and convert it into electrical
current using PIN photodetector in balance or
differential configuration
Decode the received signal and estimate the BER of the
received waveform
End
Simulate pump laser
Amplifier pump signal to appropriate value
(10-12 dBm)
Filter noise with optical filter
P P
Fig. 3: Simple Flow Chart of the Optical Transmission Systems Simulation
11
1 1 2 2
D L D L= (1)
where D1 and D2 in ps/(nm km) are the dispersion parameters of SMF and DCF respectively. L1 and L2 are the fibers length in km respectively. The condition for fiber nonlinearity compensation is satisfied if the SPM-induced phase shift is almost the same in the transmission fiber and the HNLF [2, 18].
(2)
where γs and γc are respectively, the nonlinearity coefficients of the transmission link fiber and the second High Nonlinear Fiber (HNLF) in units of /W/km. Ls and Lc in km are the length of the transmission fiber and the HNLF. Psand PCin watts accounts for
the path-average optical powers in the transmission fiber and the HNLF2 respectively. These powers can be expressed as [2, 18].
( )
0 1
s
s L s
s
P P z dz
L −
=
∫
(3)and
( )
0 1 Lc
c c
c
P P z dz
L
=
∫
(4)The Q-factor is the metric used in this paper. The Q-factor in dB is obtained by converting the measured BER values using the following equation.
(
)
(
1)
(dB) 20Log 2 erfc 2 BER
Q = × − × (5)
B. Experimental set up description
In the experimental set up shown by the illustration on Fig. 4, the light beam from the continuous wave laser source at 1552 nm frequency is polarized through a Polarization controller (PC). The polarized light flows in an MZM and modulated with 40 Gb/s
data from a 27−1 length SHF pseudorandom bit sequence (PRBS)
generator to produce a non-return-to-zero on-off keying (NRZ-OOK) signal. Modulating the NRZ signal in a second modulator driven by a 40 GHz clock will produce a return-to-zero on-off keying (RZ-OOK) signal. The low power NRZ-OOK or RZ-OOK signal is amplifier through a 20 dB optical amplifier. A VOA is used to obtain the appropriate powers of -2, 0 and 2 dBm. A 90:10 power splitter is used to measure the exact power flowing into the transmission link by connecting the 10 % pole to the power meter and the 90 % pole to the transmission link.
Fig. 4: Diagram to Illustrate the Experimental Set Up
The transmission link consisted of 8 × 25 km of SMF. The SMF has a loss of 0.2 dB/km, and nonlinear coefficients of 1.3 km−1W−1.
Each 25 km SMF has a dispersion coefficient of 16.25 ps/(nm km) at 1550 nm. The total dispersion of the DCF is −1677 ps/nm at 1545 nm to compensate for 100 km of SMF. The signal from the optical link is maintained to a constant value of -2 dBm using a second VOA followed by a 90:10 splitter. The optical signal flows in the optimization module through the OPC-unit. The received optimized optical output signal power is kept to -2 dB before and then detected with high speed photodetector and displayed on an Agilent 86100A oscilloscope to measure the optical output waveform. Both the compensation HNLF and that in the OPC module has 0.2 km length and the other parameters remain same as those used in the simulation.
III. Results and discussion
A. Simulation Results
A DQPSK transmitter transmits an information at four levels of phase’s differences 0, π/2, π and –π/2 of optical signal respectively [19-20]. This multi-level coding offer by DQPSK has the advantage of coding several bits in one symbol and thus enabling a reduction of the symbol rate of the system. As a result the requirement of high bandwidth is achieved but on the expense of an increased transmitter and receiver complexity [21].
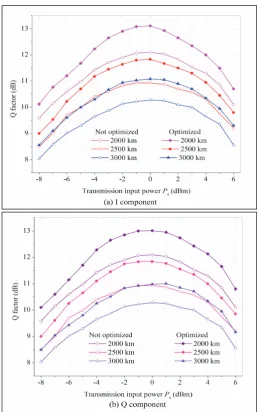
The effectiveness of achieving an optimized optical signal quality with spectral inversion through OPC by HNLF in a single channel RZ-DQPSK 100 Gb/s data channel rate is shown on Fig.5 for both I and Q components. Irrespective of the transmission distance an increment of about 1 dB of the Q factor is observed in the optimal input transmission power region when the optimization module
is utilized with optimal power Pc in the compensation HNLF as
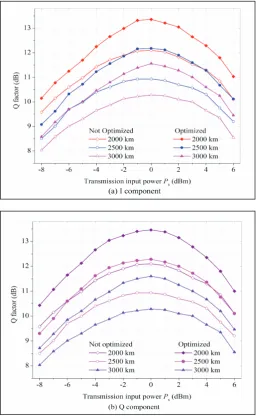
shown by the results on Fig. 5. The received optical signal quality is more optimized with the SOA based OPC as can be observed on Fig. 6 where about 1.5 dB Q factor improvements is observed. It can be concluded that the optimization technique using OPC followed by a HNLF can significantly improve the received optical signal quality in a high-speed optical transmission system with balanced direct-detection differential quadrature phase-shift keying (DD/DQPSK) for different transmission length.
Fig. 6: Performance comparison of 100 Gb/s RZ-DQPSK single channel system with and without OSPO with SOA based OPC
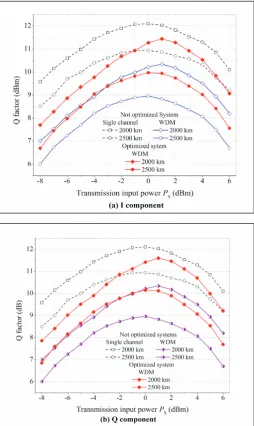
To evaluate the effectiveness of the optimization technique in the presence of both SPM and XPM, 5 channels RZ-DQPSK WDM systems with 80 GHz channel spacing is simulated with 100 Gb/s channel data rate. The central channel is 1552 nm. The optical signal power into the OPC is set to 0 dBm; the pump power is 15 dBm and the SOA injection current is 300 mA. All other parameters remain the same as the single channel system. Fig. 7 and Fig. 8 show the Q factor as a function of transmission
input power P for the central channel of the WDM system with
and without optimization with 5 nm Optical Band Pass Filter (OBPF). The Q factor of the uncompensated WDM system has drop with about 3.0 dB comparing to the uncompensated single channel system.
Fig. 7: Performance of 100 Gb/s RZ-DQPSK single channel and WDM systems with and without received optical signal optimization with HNLF based OPC
The impact of XPM due to the neighboring channels significantly distort signal in WDM. The optimization technique has improved the WDM system performance by about 0.5 dB and 1 dB in Q factor for HNLF and SOA based OPC modules respectively. This technique has the advantage of increasing the nonlinear threshold limit of both the single channel and WDM system.
B. Experimental results
Fig. 9 shows the evolution of the Q factor with a range of input power Ps into the transmission link of 300 km for single channel 40 Gb/s DPSK system y with and without signal optimization at the receiver for input powers Pc into compensation HNLF ranging from - 6 dBm to 6 dBm with 1 dBm increment. The signal quality is improved with the optimization system and the minimum required
13
Fig. 8: Performance of 100 Gb/s RZ-DQPSK single channel and WDM systems with and without received optical signal optimization with SOA based OPC
Fig. 10 shows the eye-pattern improvement that occurs with increasing input power in the HNLF. Q is greatly improved at
high transmission input power Ps where the compensation power
Pc required is high.
This implies OSPO is effective to compensate for fiber nonlinear impairments which mostly occurred in the high input power. The experimental results for the DPSK agree with the simulation results discuss earlier. The eye pattern of the DPSK shows an increase in performance at high input signal power with relatively high power set for the compensation HNLF. One of the drawbacks that can be associated with this approach is the requirement of high power amplifiers to acquire the necessary power for the compensation HNLF. This method involving spectral inversion at the receiver through OPC compensate dispersion and nonlinearity in an all-optical fashion and may involve complex nonlinear processes such as the mid-link method. But it offers the advantage of flexibility since it is located at the receiver and therefore easily accessible for maintenance and redeployment. The trade-off between the spectral inversion method at the receiver and DBP is that the first does not offer computation complexities observed in the later and a prior knowledge of fiber spans configuration is not required.
Fig. 9: Q Factor vs Pc with and without OSPO at Various
Transmission Power Ps after 300 Km
Fig. 10: Output Eye Patterns for Optimized System for a set of Ps vs Pc.
IV. Conclusion
Simulation and Experimental results show that an optical module composed of OPC followed by a HNLF placed between the receiver and the optical transmission medium can significantly improve the received signal quality of intensity and phase modulated direct-detection optical transmission system. The technique compensate for residual chromatic dispersion and the Kerr effects such as SPM and XPM which easily occurs in high-speed system employing 40, 100 Gb/s data channel or even more. This technique improves significantly the nonlinear threshold power limit of both single channel and WDM systems.
References
[1] A. Gnauck, R. Jopson, R. Derosier, “10- Gb/s 360-km transmission over dispersive fiber using mid system spectral inversion”. IEEE Photonics Technology Letters, Vol. 5, No. 6, pp: 663-666, 1993.
[2] S. Watanabe M. Shirasaki,“Exact compensation for both chromatic dispersion and Kerr effect in a transmission fiber using optical phase conjugation”. Journal of Lightwave Technology, Vol. 14, No. 3, pp. 243-248, 1996.
[4] P. Minzioni A. Schiffini, “Unifying theory of compensation techniques for intrachannel nonlinear effects”. Optic Express, Vol. 13, No. 21, pp. 8460-8468, 2005.
[5] P. Minzioni, F. Alberti, A. Schiffini,“Techniques for nonlinearity cancellation into embedded links by optical phase conjugation”, Journal of Lightwave Technology, Vol. 23, No. 8, pp. 2364-2370, 2005.
[6] P. Minzioni, I. Cristiani, V. Degiorgio, et al.,“Experimental demonstration of nonlinearity and dispersion compensation in an embedded link by optical phase conjugation”, IEEE Photonics Technology Letters, Vol. 18, No. 9, pp: 995-997, 2006.
[7] P. Minzioni,“Nonlinearity compensation in a fiber-optic link by optical phase conjugation”, Fiber and Integrated Optics, Vol. 28, No. 3, pp. 179-209, 2009.
[8] C. McKinstrie, S. Radic, C. Xie, “Reduction of soliton phase jitter by in-line phase conjugation”. Optics letters, Vol. 28, No. 17, pp. 1519-1521, 2003.
[9] S. L. Jansen, D. van den Borne, G.D. Khoe, H. De Waardt , C. Climent Monsalve,“Reduction of phase noise by mid-link spectral inversion in a DPSK based transmission system”. OFC/NFOEC Technical Digest in Optical Fiber Communication Conference 2005, 6-11 March, Anaheim, CA, USA, OThO5.
[10] S. Jansen, D. V. D. Borne, B. Spinnler, S. Calabro, H. Suche, P.M. Krummrich, W. Sohler, G.-D. Khoe, H. De Waardt “Optical phase conjugation for ultra-long-haul phase-shift-keyed transmission”. Journal of lightwave technology, Vol. 24, No. 1, pp. 54-64, 2006.
[11] P. Minzioni, V. Pusino, I. Cristiani, L. Marazzi, M. Martinelli, C. Langrock, M. M. Fejer, V. Degiorgio,“Optical phase conjugation in phase-modulated transmission systems: experimental comparison of different nonlinearity-compensation methods”, Optics express, Vol. 18, No. 17, pp. 18119-18124, 2010.
[12] M. D. Pelusi B. J. Eggleton,“Optically tunable compensation of nonlinear signal distortion in optical fiber by end-span optical phase conjugation”, Optics Express, Vol. 20, No.7, pp: 8015-8023, 2012.
[13] G. Xia, D. Huang, X. Chen, et al.,“Broadband 40-GHz coherent source based on supercontinuum generation in highly nonlinear fiber”. Microwave and optical technology letters, Vol. 47, No. 1, pp. 73-76, 2005.
[14] G. P. Agrawal, “Nonlinear fiber optics”. (4th ed). Elsevier / Academic Press, Boston, 2007.
[15] G. P. Agrawal,“Fiber-optic communication systems”. (4th ed), Wiley, New York, 2010.
[16] A. Yariv, D. Fekete, D. M. Peppe,“Compensation for channel dispersion by nonlinear optical phase conjugation”. Optics Letters, Vol. 4, No. 2, pp. 52-54, 1979.
[17] S. Ramachandran,“Fiber based Dispersion Compensation”. Springer, New York, 2007.
[18] S. Watanabe,“Optical signal processing using nonlinear fibers”, Journal of Optical and Fiber Communications Research, Vol. 3, No. 1, pp. 1-24, 2006.
[19] P. J. Winzer R.-J. Essiambre,“Advanced optical modulation formats for high-capacity optical transport networks”, Journal of Lightwave Technology, Vol. 24, No. 12, pp. 4711-4728, 2006.
[20] K.-P. Ho,“Phase-modulated optical communication systems”, Springer, 2005.
[21] E. Lach W. Idler,“Modulation formats for 100G and beyond” Optical Fiber Technology, Vol. 17, No. 5, pp. 377-386, 2011.