https://doi.org/10.5194/tc-12-3653-2018
© Author(s) 2018. This work is distributed under the Creative Commons Attribution 4.0 License.
Microbial processes in the weathering crust aquifer
of a temperate glacier
Brent C. Christner1,2, Heather F. Lavender2, Christina L. Davis1, Erin E. Oliver2,a, Sarah U. Neuhaus3, Krista F. Myers4, Birgit Hagedorn5, Slawek M. Tulaczyk3, Peter T. Doran4, and William C. Stone6
1Department of Microbiology and Cell Science, University of Florida, Biodiversity Institute, Gainesville, FL 32611, USA 2Department of Biological Sciences, Louisiana State University, Baton Rouge, LA 70803, USA
3Department of Earth and Planetary Sciences, University of California Santa Cruz, Santa Cruz, CA 95064, USA 4Department of Geology and Geophysics, Louisiana State University, Baton Rouge, LA 70803, USA
5Sustainable Earth Research LLC, Anchorage, AK 99508, USA 6Stone Aerospace, Del Valle, TX 78617, USA
acurrent address: Department of Biology, San Diego State University, San Diego, CA 92182, USA
Correspondence:Brent C. Christner ([email protected]) Received: 2 July 2018 – Discussion started: 8 August 2018
Revised: 29 October 2018 – Accepted: 3 November 2018 – Published: 26 November 2018
Abstract.Incident solar radiation absorbed within the abla-tion zone of glaciers generates a shallow perched aquifer and seasonal icebound microbial habitat. During the melt sea-sons of 2014 and 2015, borehole investigations were used to examine the physical, geochemical, and microbiological properties in the near-surface ice and aquifer of the temper-ate Matanuska Glacier (south-central Alaska). Based on tem-perature, solar forcing, and ice optical properties, the dissi-pation of shortwave radiation promoted internal melting and the formation of a weathering crust with a maximum depth of ∼2 m. Boreholes into the weathering crust provided ac-cess to water percolating through the porous ice. The wa-ter had low ion concentrations (4–12 µS cm−1), was aerobic (12 mg O2L−1), contained 200 to 8300 cells mL−1, and har-bored growing populations with estimated in situ generation times of 11 to 14 days. During the melt season, the upper 2 m of ice experienced at least 3 % of the surface photosynthet-ically active radiation flux and possessed a fractional water content as high as 10 %. Photosynthetic subsistence of bio-geochemical reactions in the weathering crust ecosystem was supported by ex situ metabolic experiments and the presence of phototrophic taxa (cyanobacteria, golden and green algae) in the aquifer samples. Meltwater durations of∼7.5 months coupled with the growth estimates imply biomass may in-crease by 4 orders of magnitude each year. Our results pro-vide insight into how seasonal dynamics affect habitability
of near-surface ice and microbial processes in a portion of the glacial biome poised to expand in extent with increasing global temperature and ablation season duration.
1 Introduction
influence ice velocity and ice sheet thinning (Zwally et al., 2002; Sole et al., 2011).
Glacial meltwater production also provides aquatic en-vironments that are suitable for supporting microbial com-munities and promoting active biogeochemical cycling on glacier surfaces (Hodson et al., 2008; Edwards and Cameron, 2017). Conditions in certain supraglacial environments even fall within the tolerances of cold-adapted multicellular or-ganisms, and invertebrate populations have been documented in a number of cryoconite ecosystems (Zawierucha et al., 2015). The uptake of nutrients and dissolved organic car-bon in fast-flowing supraglacial streams demonstrates the ef-fect of microbial activity on meltwater composition and im-plies that higher degrees of biogeochemical processing are possible with longer hydrologic retention times (Scott et al., 2010). Visual discoloration of snow and ice surfaces due to blooms of cyanobacteria and algae are commonly observed (Hopes et al., 2017), and in regions with standing water (e.g., cryoconite holes), photosynthetic rates can be sufficient for positive net community productivity (Anesio et al., 2009; Hodson et al., 2013). An important consequence of micro-bial growth and pigment production is darkening of the ice surface and albedo reduction (Yallop et al., 2012; Stibal et al., 2017; Tedstone et al., 2017), a critical parameter govern-ing surface meltgovern-ing (Gardner and Sharp, 2010).
In the ablation zone, the absorption of shortwave radia-tion within the ice promotes internal melting and density re-duction (LaChapelle, 1959; Munro, 1990), forming a highly porous veneer on the glacier surface termed the weather-ing crust (Müller and Keeler, 1969). Flow paths through the weathering crust’s saturated water table link segments of the supraglacial hydrological system, transporting microbes and nutrients via subsurface flow (Irvine-Fynn et al., 2012; Hoffman et al., 2014; Karlstrom et al., 2014; Cook et al., 2016). The availability of photosynthetically active radiation (PAR) in the near-surface aquifer may support phototrophic metabolism (Hodson et al., 2013; Irvine-Fynn and Edwards, 2014), allowing the development of microbial communities in the glacial weathering crust during the melt season. The weathering crust aquifer (WCA) is presumed to be an impor-tant component of the hydrological and biogeochemical bud-get for cold-based glaciers (Irvine-Fynn et al., 2012; Cook et al., 2016; Rassner et al., 2016), but no data have been avail-able to assess microbial activities and biogeochemical trans-formations in temperate ice systems.
This study examined physical, geochemical, and micro-biological properties in the weathering crust of the temper-ate Matanuska Glacier (loctemper-ated in the Chugach Mountains of south-central Alaska) to gain information on the nature of the near-surface aquatic ecosystem it supports during the ab-lation season. Comparison of water percolating through the weathering crust to the surface ice melt revealed unique geo-chemical features and the enrichment of certain microbial taxa in the WCA, supporting that it may possess distinct bio-geochemical processes and species within the supraglacial
environment. Sufficient PAR fluxes exist with depth in the ice for photosynthetic activity, and the WCA samples con-tained growing cell populations and phototrophic taxa. We use these biogeochemical data and modeling results to spec-ulate on how microbial processes in the weathering crust are likely affected by seasonal variability in temperature, light, and water availability.
2 Methods
2.1 Site description
The Matanuska Glacier is a∼48 km valley glacier with an upper accumulation zone at an elevation of∼3500 m a.s.l. and the terminus is at∼500 m a.s.l.; its width ranges from
∼3 km near the equilibrium line to∼5 km along the termi-nus (Arcone et al., 1995). The measurements and samples analyzed in this study were collected in the vicinity of a re-search site established on the western lateral margin in the ablation zone of the glacier (61◦4209.300N, 147◦37023.200W) during June to July of 2014 and 2015, approximately 8 km from the glacier terminus. Science and technical operations were performed on the ice surface and in portable shel-ters that contained various scientific equipment, including a 61×31 cm laminar flow hood (Fungi Perfecti LLC, item no. E-ALFH1). A meltwater stream∼100 m up-glacier from the research camp was sampled to provide a measure of the mi-crobial community structure in supraglacial water environ-ments in proximity to the study site.
2.2 Borehole sampling of ice and water
In the 30 cm diameter boreholes, particulates in large vol-umes of meltwater (up to 404 L) were size fractionated (i.e., particulate fractions>3 µm,<3 to>0.8 µm, and<0.8 to >0.2 µm) and concentrated in situ on 142 mm Supor PES membranes (Pall) using a McLane large-volume water trans-fer system (WTS-LV; Christner et al., 2014). Water in the boreholes was also sampled by lowering clean silicone tub-ing into the borehole and ustub-ing a peristaltic pump to deliver the water to the surface. To determine if the ice was porous and active water flow was occurring through the weathering crust, water was drained from several of the boreholes and monitored daily to assure that meltwater was not entering di-rectly from the surface. Two of the drained boreholes refilled with water that percolated laterally from the WCA (BH4 and BH10; Table S1), and each was subsequently monitored at approximately hourly intervals when personnel were on site (typically 09:00 to 18:00 local time). The borehole water was retrieved at the surface using sterilized tubing and a peri-staltic pump or by lowering clean acid-washed HDPE bot-tles into the borehole using nylon paracord (Fig. S1 in the Supplement).
Meltwater samples from discrete ice depth intervals were obtained using a customized water sampler and filtration sys-tem that was integrated as a scientific payload on the cryobot (Clark et al., 2017; Stone et al., 2018). Operation of the cry-obot requires a water-filled cavity; therefore, the 30 cm alu-minum melt head was used to create a∼1 m pilot hole, the meltwater generated was replaced with an equal volume from a supraglacial stream, and this water was continually circu-lated through a 0.2 µm filter for ∼1 h to reduce the num-ber of microorganisms in the priming water. Stainless steel Swagelok fittings and tubing from the melt head were con-nected to a peristaltic pump, which was used to pump water into sterile 120 mL capacity sampling bags (Labtainer™ Bio-Process Container, cat. no. SH30658.12; 10 total per mis-sion) or through 90 mm Supor PES filters with a 0.2 µm pore size (five total per mission). The sampling bags had duel ports: one for filling through a sanitary check valve and one for overflow, which was controlled by a sanitary pressure relief valve. The filters were housed within a Savillex filter holder made of PFA fluoropolymer and sealed with ULTEM clamps. During water or filtration sampling, the cryobot was operated in “passive” mode (i.e., the hot water jets were not used and heat transfer was directed only to the melt head of the vehicle; Clark et al., 2017), which melted the ice at a rate of ∼1 L min−1. To prevent inadvertent collection of bulk borehole water, the sampling pumps were operated at a rate of 56 mL min−1 (i.e.,∼6 % of the rate of meltwater generation). Based on the rate of descent and collection, each water sample of 120 mL represented the melt generated from a depth horizon of approximately 1.6 cm in the ice.
2.3 Conductivity, pH, and chemical composition of the water samples
Electrical conductivity and pH of the water samples were measured using a multiparameter PCS test probe (Oakton In-struments, Vernon Hills, IL).
The concentration of major ions and trace elements in the water samples were analyzed using inductively cou-pled plasma mass spectrometry with a reaction cell for cations (ICP RC-MS, Agilent 7500c) and ion chromatograph (Dionex ICS 5000+) for anions. For ICP RC-MS analysis, samples were acidified to 1 % HNO3v/v and analyzed for 28 elements. Elements prone to interferences (e.g., Ca2+and As3+) were analyzed using H2 and He as the reaction gas. Quantification was performed using seven external calibra-tion standards ranging from 0.1 to 100 ppb. Drift correccalibra-tion was achieved by online addition of 10 ppb of a four ele-ment internal standard mix (Li(7), Y, Ce, and Bi). An Ion-Pac AS15 2×250 mm column was used for anion separa-tion using 38 mM KOH as eluent and an ASRS 300 zero reagent suppressor. The sample injection volume was 10 µL and quantification was performed using five external calibra-tion standards ranging from 0 to 10 ppm. Calibracalibra-tion verifi-cation standards and blanks were run every 10th analysis for anions and cations. The NIST SRM 1643d was used to ver-ify cation calibration and a secondary anion standard (Dionex Anion Standard II) was used to check anion calibration. Sam-ples that exceeded the calibration by 120 % were diluted and reanalyzed. Nitrite was not analyzed due to overlap with bi-carbonate in the chromatogram. The mass balance deficit be-tween anions and cations was used to determine bicarbonate concentrations.
2.4 Ice temperature and meltwater content
Vertical gradients of temperature in the ice surface were mea-sured over 2 months during the summer of 2015 by deploying a sensor string into a borehole with thermistor sensors placed at every 10 m along the string and collecting data at hourly intervals. The thermistors were calibrated under controlled conditions and had an accuracy of ca. 0.1◦C.
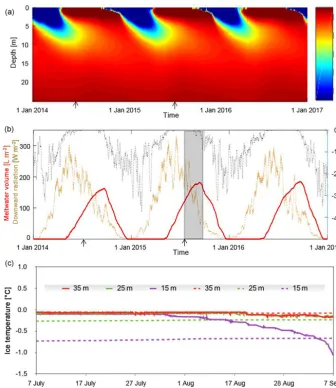
Figure 1.Temperature and ice water content from 2014 to 2016.(a)Modeled ice temperature was calculated using a finite-difference solver to a one-dimensional diffusion–advection–production equation. Only values between 0 (red limit) and−5◦C (blue limit) are plotted.(b)The model is driven by the ERA-Interim reanalysis 2 m air temperature (black dots) and downward radiation data (brown dots) for the region (Dee et al., 2011). Both forcings are plotted at hourly intervals after smoothing with a daily (surface temperature) and weekly (radiation) running-average filter to suppress short-term variability. The grey region in panel(b)represents the summer 2015 interval plotted in panel(c)when ice temperature data were collected. The arrows in panels(a)and(b)indicate the timing of the two field campaigns.(c)Comparison among ice temperatures observed with thermistors placed in a borehole at 15, 25, and 35 m below the surface from early July to early September of 2015 (solid lines) and the simulated ice temperatures (dashed lines) for the same depths below the surface of the model domain.
taken to be equal to the surface temperature at the top of the model domain when the former is negative but is set to the melting point of ice when air temperature is positive. When the latter is the case, the surface melt rate was calculated us-ing the positive-degree-day parametrization (van Beusekom et al., 2010) and a melt factor of 5 mm◦C−1day−1. The sur-face melt rate, which typically reaches several centimeters per day in summer (Ensminger et al., 1999; Reynolds, 2005; Mankoff and Russo, 2013), was treated throughout the 100 m thick model domain as spatially uniform upward advection. Surface solar radiation downwards from the ERA-Interim dataset was used to scale internal heating in the upper
op-tically translucent part of the glacier following the exponen-tial Lambert law of light attenuation with ane-folding length scale of 0.825 m as constrained by the PAR data (Fig. 2a). When ice is at 0◦C and still experiencing internal heating from solar radiation, the additional heat is used to calcu-late meltwater fraction using the calcu-latent heat of ice fusion (334 000 J kg−1). Similarly, when wet ice is cooling down, the negative heat budget is used to first freeze the internal meltwater, and ice temperature can drop below 0◦C only
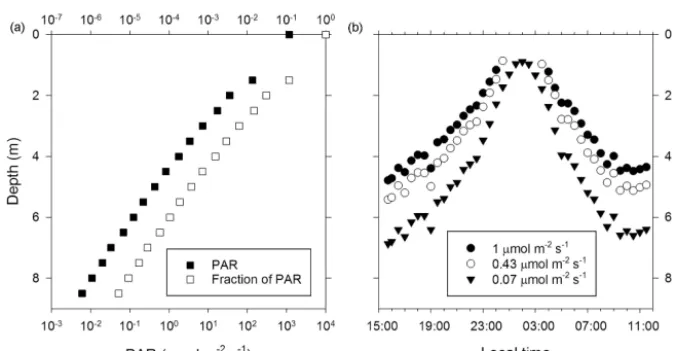
sea-Figure 2.PAR optical properties of the near-surface ice during the 2014 ablation season.(a)Measurement of PAR attenuation to a depth of 8.5 m.(b)Diel pattern for select PAR fluxes that support oxygenic photosynthesis in cold and shaded aquatic environments (Priscu et al., 1988; Hawes and Schwarz, 2001). The data plotted were derived from an overnight measurement with the sensor at a depth of 3.5 m and then using data from panel(a)to extend the overnight profile to the upper 8.5 m of the ice column.
sonal snowpack on either the temperature or energy balance of the simulated glacier surface. In winter, such snowpack would slow cooling of underlying glacier ice while in early summer it would hinder light penetration into the glacier near the surface. The entire model domain was initialized as tem-perate ice and then the calculation cycled through repeats of the 3-year surface forcings until the drift of calculated ice temperatures reached<0.01◦C over a 3-year cycle.
2.5 Determination of the PAR fluence rate
PAR (400–700 nm) was measured in boreholes using a LI-COR LI-193 spherical underwater quantum sensor (LI-LI-COR, Inc) and 10 m of underwater cable. The stated sensitivity of the LI-193 is typically 7 µA per 1000 µmol s−1m−2in water. PAR was also measured at the ice surface with a LI-COR quantum sensor mounted on a small board using a leveling device. Both sensors were driven and logged by a LI-COR LI-1400 data logger and were calibrated prior to the first field season.
Two types of measurements were made in water-filled boreholes: vertical profiling within a short period of time and overnight measurement at a fixed depth. For profiling, the sensor was deployed in a 10 cm diameter borehole and mea-surements were taken from 0 to 8.5 m at 0.5 m increments. To mitigate the “borehole effect” caused when measuring trans-mitted light in a liquid-filled borehole, the sensor was placed 1 m below a 10–15 cm opaque packer (Muni-Ball®, Cherne Industries Inc.) that was inflated at discrete depths to create a lighttight seal. To avoid freezing the packer in the ice during overnight deployments, the sensor was deployed at 3.5 m in a 30 cm diameter borehole and light was blocked from enter-ing with an opaque tarp. Due to the larger distance between
blocked light and the sensor, the diel measurement may have been subject to a larger borehole effect than the profile mea-surement.
The PAR attenuation coefficient was derived as described by Hodson et al. (2013) based on PAR(Z)=PAR0e−KZ, whereZ is the ice depth from the surface in meters, PAR0 is the surface PAR flux in µmol m−2s−1, andKis the PAR attenuation coefficient.
2.6 Epifluorescence microscopy
2.7 Determination of ATP biomass
Triplicate measurements of ATP were performed on each sample in the field by concentrating the cells in 25 mL of water on a 0.22 µm Millex-GS syringe filter (Millipore, cat. no. SLG033SS), followed by passing 0.2 mL of Extractant B/S from the ATP Biomass Kit HS (BioThema Inc., cat. no. 266-112) and collecting the filtrate. For each procedu-ral replicate, one-quarter of the filtrate (50 µL) was added to 400 µL of ATP Reagent HS and luminescence was mea-sured using a 20/20n luminometer (Turner BioSystems, cat. no. E5331). Subsequently, 1 pmol of an ATP standard was added to each sample and luminescence was measured, al-lowing the relative luminescence units (RLUs) for each mea-surement to be corrected for possible inhibition of the lu-ciferase enzyme and/or changes of ambient temperature dur-ing the course of measurement. The quantity of ATP was de-termined by generating standard curves (six 10-fold dilutions of 100 nM to 1 pM ATP) that allowed relating RLUs to the ATP concentration.
2.8 Detection of respiring cells via reduction of a tetrazolium salt
An assay with the tetrazolium salt XTT [2,3-Bis(2-methoxy-4-nitro-5-sulfophenyl)-2H-tetrazolium-5-carbox-anilide] was performed in the field to assess cellular respiration activity. The water sample (50 L) was filtered through a 142 mm, 0.22 µm SUPOR filter (Pall) and the retentate was suspended in a volume of filtrate that concentrated material >0.2 µm in diameter approximately 1500-fold. Aliquots of this suspension (1 mL) were amended with the XTT reagent (XTT Cell Proliferation Assay Kit, Trevigen cat. no. 4891-025-K) to a final concentration of 330 µM; the electron-coupling agent (phenazine methosulfate) was not included in the assay (see Roslev and King, 1993).
Individual samples in 1.5 mL microcentrifuge tubes were placed in 50 mL conical tubes that were either transparent or covered with black electrical tape (i.e., dark incubation), affixed to a nylon tether, and incubated in the borehole at a depth of 1.5 m below the surface. A packer (Muni-Ball®) was inflated 1 m above the samples to prevent direct light transmittance through the water in the borehole. At desig-nated time points, formazan production was determined in triplicate samples by measuring absorption at 470 nm with an Ocean Optics USB4000-UV-VIS miniature spectrometer.
2.9 Dissolved oxygen concentration and oxygen uptake rates
The concentration of dissolved oxygen was measured using Winkler titration and the dissolved oxygen test kit (Hanna Instruments, cat. no. HI3810). To determine oxygen uptake rates, samples of the water were dispensed into 30 mL serum vials (Wheaton, cat. no. W223743) and sealed with butyl
rub-ber stoppers while ensuring that no air bubbles were present in the headspace. During transport from the field site and shipment to the laboratory at Louisiana State University, the samples were kept chilled on blue ice and stored in the dark. A total of 2 weeks after sample collection, the serum vials were transferred to an environmental chamber, temperature probes were placed directly above the vials, and the samples were incubated at 5◦C. All samples were incubated under a continuous illumination of∼270 µmol photons m2s−1, with half of the vials covered with aluminum foil for dark incu-bation. Over the course of 117 days, triplicate measurements of dissolved oxygen concentration and cell abundance were made on the samples. Rates of oxygen uptake and cell growth at 5◦C were adjusted to the in situ temperature of 0◦C us-ing the Arrhenius equation and an energy of activation of 63 kJ mol−1(Priscu, 2013).
2.10 DNA extraction, amplification of 16S/18S rRNA gene sequences, and phylogenetic analysis
The filters obtained for nucleic acid extraction were quar-tered, placed in cryotubes containing a solution of 40 mM EDTA pH 8.0 and 50 mM Tris pH 8.3, and stored chilled in an insulated cooler on the glacier for approximately 1 week. Immediately after return from the field, sucrose was added to the storage buffer (final concentration of 0.73 M) and the cryotubes were frozen and shipped overnight to Louisiana State University on blue ice. The samples were stored in a laboratory freezer at−80◦C until analyzed.
A portion of the 16S rRNA gene (V4 region) was am-plified from the extracted genomic DNA samples using the oligonucleotide primers 515F and 806R (Caporaso et al., 2012). Each 25 or 50 µL polymerase chain reaction (PCR) contained 0.1 to 6 ng of genomic DNA, 3 mM MgCl2, 1X Gold buffer, 0.2 mM dNTPs, 0.2 µM of each primer, and 2.5 U of AmpliTaq Gold DNA polymerase LD (Invitrogen). The amplification conditions included an incubation at 95◦C for 8 to 10 min followed by 35 to 45 cycles of denaturation at 94◦C for 30 s, annealing at 50◦C for 30 s, and extension at 72◦C for 45 s. A final extension was performed at 72◦C for 5 min. The amplicons were evaluated by electrophoresis through a 1 % agarose gel, purified using the Mo Bio Ultr-aClean PCR Clean-Up Kit, quantified with Qubit fluorom-etry, and 240 ng of each amplicon was pooled. Paired-end sequencing was performed using the Illumina MiSeq plat-form (RTSF Genomics Core at Michigan State University and ICBR NextGen DNA Sequencing Core at University of Florida).
Barcodes and adapters were removed using Trimmomatic (v0.36; Bolger et al., 2014) and the amplicon sequences were processed using mothur (Schloss et al., 2009). Paired-end se-quence reads of the V4 region were assembled into contigs and quality filtered using the following default parameters: maximum sequence length of 275, minimum quality score of 25, and maximum ambiguous bases of 0. Sequences were aligned with the mothur-compatible SILVA database (v128). Chimeric sequences were removed using the VSEARCH al-gorithm within mothur. The mothur-formatted Ribosomal Database Project (RDP) training set (v16) was used to as-sign all sequences with≥97 % similarity to an operational taxonomic unit (OTU). Singletons and OTUs in the proce-dural controls were removed before data normalization. To assess community diversity and richness of the samples, the OTU abundance data were normalized (9151 sequences); Good’s estimator of coverage and Simpson’s diversity in-dex were calculated in mothur. Abundant OTUs were defined as having a relative abundance of ≥0.1 % of the total se-quences. Nonmetric multidimensional scaling (NMDS) plots were calculated within mothur and visualized in R (v.3.4.1; R Core Team, 2017).
A portion of the 18S rRNA gene (V4 and V5 regions) was amplified using genomic DNA isolated from sample BH10d and the universal eukaryal primers F566 and R1200 (Hadzi-avdic et al., 2014). PCRs of 25 µL contained 2.8 ng of ge-nomic DNA, 1X Taq buffer A, 0.5 mM dNTPs, 0.5 µM of each primer, and 1.25 U of Taq polymerase (Thermo Fisher Scientific, Inc.). The amplification protocol started with a 3 min incubation at 95◦C, followed by 35 cycles of denat-uration at 95◦C for 30 s, annealing at 60◦C for 45 s, and extension at 72◦C for 1 min. A final extension was per-formed at 72◦C for 10 min. Gel electrophoresis through a 1 % agarose gel was used to evaluate amplicon size and clone libraries were constructed with the TOPO TA Cloning Kit for Sequencing (Invitrogen) according to the
manufac-turer’s instructions. Individual clones (25) were cultured in Miller LB media containing 50 µg mL−1of ampicillin, and plasmid DNA was purified using the PureLink Quick Plas-mid Miniprep Kit (Invitrogen). PlasPlas-mid DNA was quantified with a NanoDrop 2000c (Thermo Scientific) and 50–150 ng of each was used to bidirectionally sequence each insert by Sanger sequencing (Eton Bioscience, Inc.).
Phylogenetic tree construction was conducted by aligning the query sequences based on secondary structure to their nearest neighbors using SINA alignment services (Pruesse et al., 2012). The sequence alignment was trimmed using MEGA7 and a phylogenetic tree was created with the max-imum likelihood method (Kumar et al., 2016). Bootstrap values were calculated in MEGA7 based on Felsenstein’s method and 1000 replicates.
2.11 Statistical analysis
The assumption of normality was evaluated using the Shapiro–Wilk test. The strength of linear and montonic cor-relations between geochemical and microbiological vari-ables was assessed by evaluating Pearson’s (rp) and Spear-man’s (rs) correlation coefficients, respectively. A Student’s t-distribution test was applied to determine the probability of significant differences among variables (α≤0.05). Sta-tistical differences among the microbial communities were evaluated using analysis of molecular variance (AMOVA) in mothur (Schloss et al., 2009).
3 Results
3.1 Evidence for a porous weathering crust and near-surface aquifer system
3.2 Physical conditions
A one-dimensional numerical model of heat diffusion, ad-vection, and production was used to create a prediction of temperature (Fig. 1a) and subsurface melt distribution in the ice based on internal heating (Fig. 1b). Modeled temperatures are dominated by the effects of downward propagation of the winter cold wave to depths of ∼10 m (Fig. 1a). Somewhat more subtle is the development of an isothermal, temperate summer layer in the top∼2 m of the glacier due to internal heating caused by penetration of solar radiation. Once at the melting point, this layer experiences internal melting result-ing in water contents of up to 200 L m−2or∼10 % by vol-ume (Fig. 1b). The onset of freezing air temperatures in win-ter quickly eliminates the wawin-ter-bearing layer in the model.
Comparison of the modeled and observed temperatures (Fig. 1c) shows some similarities and some differences. In July 2015, all three temperature sensors at depths of 15, 25, and 35 m reported the ice to be temperate, ca. 0◦C, in spite of the fact that the model predicts temperate conditions only at 35 m in depth. During the second half of the record, the ob-served ice temperatures at 15 m in depth drop markedly and reach less than −1◦C by early September. At depths of 25 and 35 m, ice temperatures also drop but much more gradu-ally, and by a smaller magnitude, ca.−0.1◦C. Surface obser-vations in this ice marginal study area confirmed the presence of many crevasses and crevasse traces, as well as moulins. Hence, disagreements between modeled and observed tem-peratures are attributable to the fact that the former does not include such heterogeneities, which may play an important role in transporting water and heat within the ice column. The model also makes no provision for meltwater percola-tion and storage in intercrystalline veins. Where fast drainage pathways exist (i.e, crevasses and moulins), the meltwater ta-ble can drop well below the surface and permit air access and rapid ice cooling, as indicated by the 15 m sensor (Fig. 1c). Heterogeneities enabling advective transport of heat and wa-ter significantly alwa-ter the simplified picture of physical con-ditions in near-surface ice, tending to expand the vertical ex-tent of temperate wet ice beyond the depth of several meters affected by penetration of solar radiation (Fig. 1a). Such het-erogeneities would also enable transport of microbial cells and nutrients into deeper ice.
To examine the optical properties of the near-surface ice and its potential to support photosynthetic activity, the diel flux of incident PAR (400–700 nm) and PAR attenuation with ice depth were determined (Fig. 2). Based on mid-afternoon borehole measurements on 16 June 2014, PAR in-tensity decreases exponentially with ice depth (Fig. 2a) and the PAR attenuation coefficient (KPAR; Hodson et al., 2013) is 1.5 m−1. Comparison with PAR data for benthic mats (1 µmol m−2s−1; Hawes and Schwarz, 2001) and the water column of highly shaded Antarctic lake ecosystems (0.43 and 0.07 µmol m−2s−1; Priscu et al., 1988) implied that midday
PAR fluxes could support photosynthesis to maximum depths of 5 to 7 m (Fig. 2b).
3.3 Chemical composition of the near-surface ice and WCA
A novel ice-penetrating cryobot (Stone et al., 2014, 2018) with a water sampling system (Clark et al., 2017) was used to obtain meltwater from two boreholes (BH6 and BH7; Ta-ble S1) located within ∼1.5 m of each other, and 24 sam-ples were collected from discrete depths of between 1.4 and 8.3 m and filtered for chemical analysis. These data (Ta-ble S2) indicated that Ca2+was the dominant cation (average of 56±27 ppb;±standard deviation) and strongly positively correlated (rs>0.62,n=24,p <0.001) to subordinate K+, Na+, Mg2+, Al3+, and Fe(aq) concentrations. Sulfate was
the most abundant anion (136±28 ppb) followed by HCO−3 (75±78 ppb), the latter of which showed large variation with depth (Fig. 3a; Table S2). Nitrate and Cl−exceeded the ana-lytical limit of detection in approximately one-quarter of the samples in the profile, averaging 81±21 and 172±38 ppb, respectively.
Water that percolated into BH10 via porous flow during July 2015 had a pH of 6.2 and 6.8 and conductivity of 12 and 4 µS cm−1(samples BH10b and BH10d, respectively), which is a similar pH but higher conductivity than that observed in supraglacial waters (∼1 µS cm−1). Chemical analysis of WCA sample BH10b (Table S2) indicated that in contrast to data obtained from ice melt, Na+ was the dominant cation
and Cl− was the dominant anion. Comparing odds ratios for each analyte indicated that six compounds were substan-tially enriched (4- to 170-fold; Na+, K+, F−, Al3+, Fe(aq),
and Br−) and five were depleted (3- to 17-fold; SO24−, NO−3, Cr3+, Pb2+, and Co2+) in the WCA sample relative to av-erage concentrations in ice melt from 1.4 to 8.3 m (Fig. 3b). The largest differences observed between the ice and WCA chemistry were with F− (170-fold enriched in the WCA), Pb2+, and Co2+ (16- and 17-fold depleted in the WCA, re-spectively).
3.4 Microbial cells and biomass in the near-surface glacial ice and WCA
Figure 3.Geochemical composition of melted ice and water from the WCA.(a)Depth profile for analytes correlated with the cell and/or ATP data.(b)Ratio of compounds in the WCA water samples relative to the average in ice from depths of 1.4 to 11.3 m. The order of compounds is based on their abundance in the WCA sample (i.e., decreasing abundance from left to right). The plus and minus symbols are the ratios based on the maximum and minimum values, respectively, observed in the ice profile.
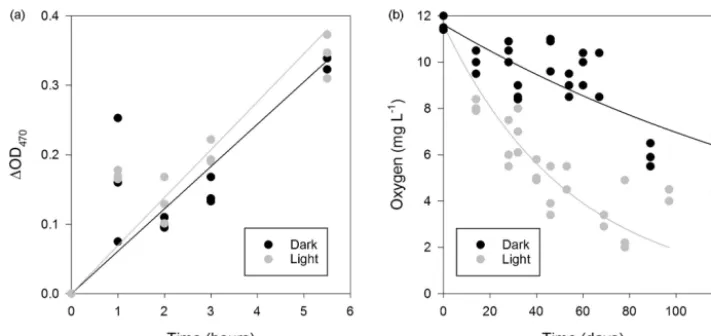
Figure 5.Respiratory activity of microorganisms in the WCA.(a)Time-dependent reduction of XTT for samples (BH5) incubated in situ. Linear regression models for the data are also plotted.(b)Oxygen consumption in the light (∼270 µmol photons m2s−1) and dark over approximately 3 months at 5◦C (sample BH10c). The data were fit with an exponential model (dark,y=11.6e−0.00553,r2=0.676; light, y=11.6e−0.0167,r2=0.644).
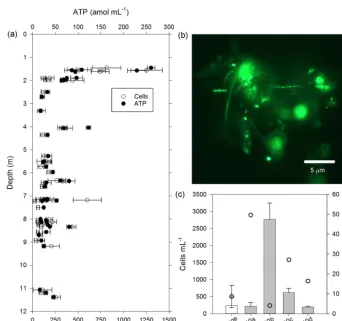
ATP concentration were higher relative to samples from ad-jacent depths (Fig. 4a). The cell and ATP data strongly pos-itively correlated with Co2+(rs>0.60,n=24,p <0.002) and moderately positively correlated with HCO−3 (rs>0.47, n=24,p <0.019); the ATP concentration also moderately positively correlated with Al3+and K+(rs>0.57,n=24, p <0.004; Fig. 3a).
The cell concentration in the water generated by melt-ing BH10 (i.e., BH10a) was similar to average values from depths of 1.4 to 11.3 m (Fig. 4c) and 875-fold lower than that observed in supraglacial water (1.92±0.465×
105cells mL−1). Relative to the second refill event collected on 5 July 2015 (BH10b; 2760±488 cells mL−1), subsequent sampling on consecutive days (6 and 7 July 2015; samples BH10c and BH10d, respectively) revealed that cell concen-trations in the third and fourth refills were 78 % and 93 % lower, respectively (Fig. 4c). The ATP concentration in water sampled from the third refill (BH10c) was 32±3.4 amol L−1 and slightly lower than the average for depths of 1.4 to 11.3 m (54±50 amol L−1; Fig. 4a).
3.5 Microbial respiration and oxygen consumption
The respiration potential of microorganisms in the WCA was evaluated in June 2014 by measuring the reduc-tion of XTT [2,3-Bis(2-methoxy-4-nitro-5-sulfophenyl)-2H-tetrazolium-5-carbox-anilide] during time-course experi-ments that were incubated at a depth of 1.5 m in a packered borehole. A sample for the rate measurement was obtained from water in BH5, which was melted 1 day prior to the ex-periment. To investigate if the respiration rate was affected by PAR availability at 1.5 m (Fig. 2), identical preparations of the samples were incubated in situ in the light and dark. Under both conditions, the production of formazan at the
in situ temperature was linear over 5.5 h (Fig. 5a), and the slope of the data from the light (blight=0.0691) was slightly higher than that in the dark (bdark=0.0610), but formazan production was not statistically different between the treat-ments (Student’st distribution,p=0.46,n=29).
During July 2015, water collected from the third refill event in BH10 (sample BH10c) was found to be undersat-urated with respect to oxygen (11.6±0.3 mg L−1, 88 % of air-saturated water). To estimate the oxygen uptake rate in the WCA, the BH10c samples were sealed in serum bottles with no headspace and incubated ex situ at 5◦C in the dark
and light (∼270 µmol photons m2s−1) for 117 and 97 days, respectively. The rate of oxygen consumption during these experiments (Fig. 5b) was modeled as a first-order decay process and revealed that samples incubated in the light had a larger reaction rate coefficient (k=0.0167 day−1, R2=
0.644) than those in the dark (k=0.00553 day−1, R2=
0.676). Data from the first 32 days of incubation were used to calculate the initial rate of consumption in the light and dark (152 and 70 µg O2L−1day−1, respectively), and the lin-ear regression models for these conditions had significantly different slopes (p=0.010,n=24). Correction of the rate data to the in situ temperature of 0◦C (Fig. 1a) provided oxy-gen consumption estimates of 42 and 92 µg O2L−1day−1in the dark and light, respectively.
dark and light, respectively. Assuming exponential growth during the first half of the experiment, the mean doubling time of the populations at 0◦C was estimated at 14 and
11 days in the dark and light, respectively.
3.6 Composition of microbial assemblages in the near-surface ice and WCA ecosystem
A total yield of ≤200 pg (i.e., limit of detection for the DNA quantification method) to 200 ng of genomic DNA was obtained from the filter samples extracted, a portion of which was used to amplify the V4 region of the 16S rRNA gene. Amplicons obtained from 31 samples (Table S3) and four procedural controls (three DNA extraction blanks and a PCR control, all amplified using 45 cycles) were sequenced, producing 14 349 197 paired-end contigs with an average read length of 253 bp. After quality filtering and removing chimeras and singletons, 10 024 390 sequences remained that classified as 12 970 OTUs. OTUs that co-occurred in the procedural control data at abundances>0.05 % of total se-quences (279 OTUs) were designated as experimental con-taminants and removed from the dataset, leaving 7 754 705 unique reads for evaluation. Each sample was normalized to 9151 sequences, reducing the dataset to 283 681 sequences that classified as 3381 OTUs. Abundant OTUs were defined as having relative abundances≥0.1 % of total sequences and represented between 65 % and 99 % of the OTUs in each sample. Based on Good’s coverage estimates for the normal-ized sequences (>0.96; Table S3), the data are sufficient to describe the most abundant taxa in the samples.
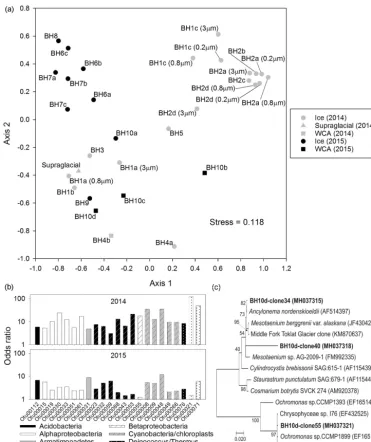
The abundant OTUs in the samples classify within nine bacterial phyla: Proteobacteria were the dominant phy-lum, followed by Cyanobacteria, Bacteroidetes, Actinobacte-ria, Armatimonadetes, Firmicutes, AcidobacteActinobacte-ria, Deinococ-cus, and candidate phylum WPS-2 (eight bacterial OTUs could not be classified at the phylum level). Based on the NMDS analysis (Fig. 6a), the samples cluster into three highly significantly different groups (AMOVA; p≤0.001, n=31) that can be generally characterized as (i) 2014 sam-ples from boreholes of 10 to 30 m in depth (top right of plot), (ii) 2015 samples collected at discrete depths between 2 and 15 m (top left), and (iii) samples heavily influenced by surface and in-ice melting (i.e., stream and WCA wa-ter; bulk ice melt from boreholes≤4 m; bottom of Fig. 6a). The vast majority of sequences in the englacial 2014 sam-ples from borehole depths of 10 to 30 m were proteobac-terial (94 % of the sequences), with taxa in the Actinobac-teria (3 %), Bacteroidetes (1 %), CyanobacActinobac-teria (1 %), and six other phyla comprising the remainder (Fig. S2). Sam-ples from the deepest 2015 boreholes had similar phyla dis-tributions; however, the 2014 samples were dominated by Gammaproteobacteria, whereas betaproteobacterial OTUs were more abundant in the 2015 data. This contrasted with the assemblages in the near-surface samples, which were comprised of OTUs affiliated with the phyla
Proteobac-teria (39 %), CyanobacProteobac-teria (22 %), Bacteroidetes (18 %), Actinobacteria (9 %), Armatimonadetes (2 %), Acidobacte-ria (1 %), Deinococcus/Thermus (1 %), and candidate phy-lum WPS-2 (<0.5 %; Fig. S2).
To explore the provenance of species in the glacier’s near surface and ascertain if the observed distributions were con-sistent with the release of microbes from englacial ice dur-ing meltdur-ing, an odds ratio for each OTU was calculated by comparing abundance with data from the deepest boreholes (Fig. 6b). For the 2014 samples, OTU abundances in samples BH3, BH4a, and BH5 were compared to data from BH2 (n=
8; Table S3). Similarly, samples from shallow 2015 boreholes (BH9 and BH10a) were compared with data from BH6, BH7, and BH8 (n=7). Based on this approach, 23 OTUs in seven bacterial phyla were identified that had>5-fold higher abun-dances in the glacier’s near surface (Fig. 6b) and represented approximately one-third of the sequences in these samples. Most of these OTUs classify as Alphaproteobacteria, Bac-teroidetes, and Cyanobacteria, with the nearest neighbors for three of the five cyanobacterial OTUs being the 16S rRNA sequences of plastids most closely related to those possessed by chrysophyte and streptophyte algal species (Fig. S3). Sev-eral of the plastid 16S rRNA sequences were the most abun-dant OTUs in the near-surface samples (OTU8 and OTU9 together make up 16 % of the 2014 and 11 % of the 2015 data). DNA from BH10d was used to amplify and clone a portion of the 18S rRNA gene for phylogenetic analysis. Se-quencing of 25 clones identified three OTUs related to green and golden algae (Fig. 6c) as well as four OTUs related to fungal, ciliate, and rotifer species (Table S4). The phyloge-netic relationships of the 18S rRNA gene sequences related to members of the classes Zygnematophyceae and Chryso-phyceae (Fig. 6c) were consistent with the composition of algal taxa inferred based on the plastid 16S rRNA gene data (Fig. S3).
4 Discussion
Figure 6.Microbial community structure in the ice and WCA based on analysis of 16S/18S rRNA genes.(a)NMDS ordination plot of communities observed in samples of englacial (upper left and right) and near-surface (bottom) ice.(b)Odds ratios for taxa enriched in the near-surface ice samples. The OTUs shown have abundances >0.25 % of all sequences and odds ratios>5-fold in samples from 2014 or 2015.(c)Phylogenetic analysis of amplified 18S rRNA gene sequences (positions 566 to 1200,Saccharomyces cerevisiaenumbering) related to algae in the Zygnematophyceae and Chrysophyceae classes. GenBank accession numbers are listed in parentheses. The scale bar represents 0.020 substitutions per site and bootstrap values are shown as a percentage of 1000 replications.
High Arctic glaciers (Irvine-Fynn and Edwards, 2014) but exceeds that for Antarctic dry valley glaciers by more than 10-fold (5–15 cm; Hoffman et al., 2014) because the ice is much colder and penetrating radiation is used to warm ice rather than melt it. Although the low-density surface ice can serve as a reservoir for 14–18 cm of meltwater (Cooper et al., 2018), the low hydraulic conductivities observed for North-ern Hemisphere glaciers indicate that meltwater flow through the WCA is slow and inefficient (Stevens et al., 2018).
the photosynthetic properties of highly shaded polar aquatic ecosystems (Priscu et al., 1988; Hawes and Schwarz, 2001), sufficient PAR may penetrate to ice depths of 5 to 7 m during daily maximums to support cyanobacterial and al-gal photosynthesis (Fig. 2b). However, since the solar radi-ation flux is incapable of producing appreciable meltwater at depths>2 m (Fig. 1a), photosynthetic and microbial ac-tivity are likely localized to the near-surface region. The up-per 2 m of ice exup-periences at least 3 % of the surface PAR flux (Fig. 2a) and may hold up to 200 L of liquid water per square meter of glacier surface during the peak of the melt season (Fig. 1b). Remarkably, if the WCA community pos-sesses species capable of acclimating to highly shaded con-ditions, such as those found in ice-covered Antarctic lakes (0.07 µmol m−2s−1; Priscu et al., 1988), then the diel pattern observed during civil twilight implies the PAR flux contin-ually exceeded the threshold necessary to support photosyn-thetic activity (Fig. 2b).
The oxygen uptake rate for WCA samples incubated in the light (92 µg O2L−1day−1; Fig. 5b) was more than twice the values obtained in the dark (42 µg O2L−1day−1) and
∼5-fold lower than estimates in supraglacial melt ponds in proximity to the study site (440 to 600 µg O2L−1day−1 un-der ambient light; data not shown). Similar measurements in most aquatic ecosystems typically observe higher dissolved oxygen concentrations when samples are incubated in the light due to stimulation of oxygenic photosynthetic activity. Pace and Prairie (2005) and Abbasi and Chari (2008) of-fer four possible explanations germane to interpreting these results. First, the photochemical oxidation of inorganic or organic compounds consumes oxygen and cannot be dis-counted as a sink in these experiments. Nevertheless, cell growth was observed in the microcosm studies and the pop-ulations had shorter generation times in light versus dark incubations (11 and 14 days, respectively). Second, sam-ples incubated in the light may experience higher incuba-tion temperatures, but this possibility can be excluded be-cause the dark samples were wrapped in aluminum foil and incubated under illumination, making uniform temper-ature differences among treatments unlikely. Finally, oxygen may be consumed by phototrophic algae and cyanobacteria through pseudocyclic electron transport (i.e., the Mehler re-action) or by the CO2-fixing enzyme RuBisCO (ribulose-1,5-bisphosphate carboxylase/oxygenase) during photorespira-tion. Given the high proportion of phototrophic taxa detected in the near-surface samples (Fig. S2), these latter mecha-nisms provide the most plausible explanation for the elevated oxygen consumption rates during light incubation (Fig. 5b).
Meltwater production and duration in the ice are highly relevant to microbial processes in the WCA. Modeling of the ice properties under the local meteorological conditions from 2014 to 2016 suggests water content in the weathering crust increased gradually with the onset of the ablation season and that a substantial fraction of this water persisted in the ice for
∼7.5 months each year (Fig. 1). Snow cover is not included
in our simulations but its two main effects may cancel each other out. Snow on ice acts as a thermal insulator, decreas-ing the cooldecreas-ing effect of the winter cold wave propagatdecreas-ing into the near-surface zone. In late spring and early summer, snow will hinder penetration of sunlight, ice warming, and generation of internal melt. Therefore, we conjecture that the two effects may impact more the timing of the beginning and the end of the seasonal WCA rather than its overall duration. Acknowledging that ex situ assays may allow microbial pop-ulations to enumerate at rates higher than those in situ (i.e., the bottle effect), the maximum generation times observed (2 weeks) coupled with the duration of the meltwater interval imply that 16 generations per year were possible. Assuming retention of the cells in the surface during summer (Irvine-Fynn et al., 2012), the potential for WCA communities to in-crease total biomass by 4 orders of magnitude (i.e., 216) each melt season is a level of production that could significantly influence the carbon cycling budgets of ecosystems directly associated with the glacier and its drainage system (Anesio et al., 2010).
cryoconite holes (Hodson et al., 2010; Langford et al., 2010), and sea ice (Riebesell et al., 1991).
Surface water transport and emergence of ice in the ac-tively melting ablation area are the processes most likely providing microbial inoculum to the WCA. According to NMDS ordination, microbial assemblages in the deepest boreholes (i.e., originating from englacial ice) clustered by year and were highly significantly different from samples in the glacier’s near surface (Fig. 6a). Considering ablation rates of 4 to 15 cm day−1at the Matanuska Glacier during May to August (Ensminger et al., 1999; Reynolds, 2005; Mankoff and Russo, 2013), most of the ice column sampled in 2014 would have ablated by the following season (i.e., relative to the ice surface in 2014, the samples collected in 2015 origi-nated from a deeper horizon in the glacier). Curiously, data from a 10 m borehole (BH1) on two consecutive days in 2014 (BH1a and BH1b) clustered with near-surface ice samples, but the assemblages observed on the third day (BH1c) were more similar to those in the deeper 2014 boreholes (Fig. 6a). Movement of the glacier over irregular terrain has highly fractured the ice in the marginal area studied, and the hydro-logically connected fracture networks of temperate glaciers link the near surface to the englacial zone (Fountain et al., 2005). The temporal changes observed in BH1 support the possibility that microbes originating from deeper portions of the ice column can be mobilized and englacially transported with water on relatively short time frames.
Microbial communities in the 2014 and 2015 samples from shallow boreholes (4 m), a supraglacial stream, and the WCA formed a loose cluster in NMDS ordination space (Fig. 6a). Comparison of bulk meltwater (BH4a and BH10a) with water that subsequently percolated into the boreholes (BH4b, BH10b, BH10c, and BH10d) indicated no signifi-cant difference in community structures (p=0.138,n=6). The community in the first WCA sample collected in 2015 (BH10b) was considerably less diverse than that in the bore-hole meltwater (BH10a; Fig. 4c), plotted on the periphery of the near-surface cluster in NMDS analysis (Fig. 6a), and had a structure significantly different from the other WCA sam-ples (p=0.015, n=6). However, samples collected from BH10 over the following 2 days (BH10c and BH10d) con-tained more diverse communities (Fig. 4c) that were more similar to each other and the 2014 WCA sample BH4b (Fig. 6a). Sample BH10b was collected after a period of rain-fall, contained a cell concentration 5- to 14-fold higher than the other WCA samples (Fig. 4c), and was highly enriched with two gammaproteobacterial OTUs in the genera Pseu-domonasandStenotrophomonasthat comprised 54 % of the sequences. Together, the data from BH10 provide anecdo-tal evidence for a hydrologic response to precipitation that enhanced the mobilization of microbes from other hydroge-ological regions and/or facilitated the transfer of species de-posited in rain to the WCA.
If the WCA represents an ecotone between the supraglacial and englacial environment, then the presence
of distinct species and community structures would be ex-pected. However, a strict interpretation of the WCA commu-nity composition based on data from the percolating water may be complicated by the co-occurrence of microbes in the samples that originated from aquatic ecosystems on the sur-face, glacial ice melt, and wet or dry deposition. Odds ra-tios derived from sequence abundances (Fig. 6b) indicate that 23 OTUs affiliated with eight bacterial phyla and the plas-tids of golden and green algae (Fig. S3) were enriched more than 5-fold in the WCA relative to englacial ice samples. Four of these OTUs (OTU21, OTU31, OTU48, and OTU53) were at abundances>1 % of the sequences in the WCA and near-surface ice samples but represented<0.1 % of the se-quences in supraglacial water, suggestive for the presence of distinct OTUs in the weathering crust. The largest odds ra-tios were observed for deltaproteobacterial OTUs in the 2014 samples, but three OTUs with high identity to plastid 16S rRNA gene sequences of Zygnematophyceae and Chryso-phyceae taxa (OTU8, OTU9, and OTU48) had odds ratios that ranged from 5 to 35 during both years (Fig. 6b) and represented 11 % to 16 % of sequences detected in the near-surface ice samples (BH3, BH4a, BH5, BH9, and BH10a). Phylogenetic analysis of 18S rRNA gene sequences ampli-fied from a WCA sample revealed OTUs closely related to snow and ice algae in the generaAncylonema, Mesotae-nium, andOchromonas(Fig. 6c; Table S4). Previous studies have identifiedAncylonema nordenskioldiiandMesotaenium breggreniiin Matanuska Glacier cryoconites near the termi-nus (Takeuchi et al., 2003) as well as on the surface of the Greenland and Antarctic ice sheets (Anesio et al., 2017; Lutz et al., 2018).
5 Conclusions
environments, and proglacial streams, elucidating the factors affecting biogeochemical flux and cycling in WCA ecosys-tems warrants more detailed investigation.
Data availability. The 16S rRNA gene sequence data are deposited in the National Center for Biotechnology Information’s Sequence Read Archive (project number SRP130982). The cloned 18S rRNA gene sequence data are assigned the GenBank accession numbers MH037315 to MH037321 (Benson et al., 2008).
Supplement. The supplement related to this article is available online at: https://doi.org/10.5194/tc-12-3653-2018-supplement.
Author contributions. BCC, SMT, PTD, and WCS designed the re-search; BCC, HFL, CLD, EEO, SUN, KFM, SMT, and PTD per-formed the research; BH conducted analytical analysis; WCS de-veloped and provided technological resources; BCC, CLD, SMT, and PTD analyzed the data; and BCC wrote the paper with contri-butions from all authors.
Competing interests. The authors declare that they have no conflict of interest.
Acknowledgements. This research was supported by a grant from the NASA ASTEP program (NNX11AJ89G). Partial support was also provided by the Institute of Food and Agricultural Sciences at the University of Florida. We thank Jennifer Farrar for assistance with extracting samples for nucleic acid analysis; Joseph Cook, Andrew Hodson, and John Priscu for discussion; and the two anonymous reviewers for valuable input that improved this paper. Support and assistance provided by the following 2014 and 2015 VALKYRIE field team members were crucial to the success of this research: Nathan Bramall, Evan Clark, Chris Flesher, John Harman, Bart Hogan, Josh Moor, David Rickel, Dan Sampson, Vickie Siegel, and Vicky Yuan.
Edited by: Jürg Schweizer
Reviewed by: two anonymous referees
References
Abbasi, S. A. and Chari, K. B: Environmental management of urban lakes: with special reference to Oussudu, Discovery Pub. House, New Delhi, India, 2008.
Anesio, A. M., Hodson, A. J., Fritz, A., Psenner, R., and Sat-tler, B.: High microbial activity on glaciers: importance to the global carbon cycle, Glob. Change Biol., 15, 955–960, https://doi.org/10.1111/j.1365-2486.2008.01758.x, 2009. Anesio, A. M., Sattler, B., Foreman, C., Telling, J., Hodson, A.,
Tranter, M., and Psenner, R.: Carbon fluxes through bacte-rial communities on glacier surfaces, Ann. Glaciol., 51, 32–40, https://doi.org/10.3189/172756411795932092, 2010.
Anesio, A. M., Lutz, S., Christmas, N. A. M., and Benning, L. G: The microbiome of glaciers and ice sheets, NPJ Biofilms Micro-biomes, 3, 10, https://doi.org/10.1038/s41522-017-0019-0, 2017. Arcone, S. A., Lawson, D. E., and Delaney, A. J.: Short-pulse radar wavelet recovery and resolution of di-electric contrasts within englacial and basal ice of Matanuska Glacier, Alaska, USA, J. Glaciol., 41, 68–86, https://doi.org/10.3189/S0022143000017779, 1995.
Bamber, J. L. and Aspinall, W. P: An expert judgement assessment of future sea level rise from the ice sheets, Nat. Clim. Change, 3, 424–427, https://doi.org/10.1038/nclimate1778, 2013.
Benson, D. A., Karsch-Mizrachi, I., Lipman, D. J., Ostell, J., and Wheeler, D. L.: GenBank, Nucleic Acids Research, Oxford Uni-versity Press, Oxford, UK, 36 (Database issue), p. D25, 2008. Bolger, A. M., Lohse, M., and Usadel, B.: Trimmomatic: A flexible
trimmer for Illumina sequence data, Bioinformatics, 30, 2114– 2120, https://doi.org/10.1007/s12686-017-0754-9, 2014. Caporaso, J. G., Lauber, C. L., Walters, W. A., Berg-Lyons, D.,
Huntley, J., Fierer, N., Owens, S. M., Betley, J., Fraser, L., Bauer, M., and Gormley, N.: Ultra-high-throughput microbial commu-nity analysis on the Illumina HiSeq and MiSeq platforms, ISME J., 6, 1621–1624, https://doi.org/10.1038/ismej.2012.8, 2012. Christner, B. C., Priscu, J. C., Achberger, A. M., Barbante, C.,
Carter, S. P., Christianson, K., Michaud, A. B., Mikucki, J. A., Mitchell, A. C., Skidmore, M. L. Vick-Majors, T. J., and the WISSARD Science Team: A microbial ecosystem be-neath the West Antarctic Ice Sheet, Nature, 512, 310–313, https://doi.org/10.1038/nature13667, 2014.
Chu, V. W.: Greenland ice sheet hydrology: a review, Prog. Phys. Geogr., 38, 19–54, https://doi.org/10.1177/0309133313507075, 2014.
Clark, E. B., Bramall, N. E., Christner, B., Flesher, C., Harman, J., Hogan, B., Lavender, H., Lelievre, S., Moor, J., Siegel, V., and Stone, W. C.: An intelligent algorithm for autonomous scientific sampling with the VALKYRIE cryobot, Int. J. Astrobiol., 17, 247–257, https://doi.org/10.1017/S1473550417000313, 2017. Cook, J. M., Hodson, A. J., and Irvine-Fynn, T. D.:
Supraglacial weathering crust dynamics inferred from cry-oconite hole hydrology, Hydrol. Process., 30, 433–446, https://doi.org/10.1002/hyp.10602, 2016.
Cooper, M. G., Smith, L. C., Rennermalm, A. K., Miège, C., Pitcher, L. H., Ryan, J. C., Yang, K., and Cooley, S. W.: Melt-water storage in low-density near-surface bare ice in the Green-land ice sheet ablation zone, The Cryosphere, 12, 955–970, https://doi.org/10.5194/tc-12-955-2018, 2018.
Dee, D. P., Uppala, S. M., Simmons, A. J., Berrisford, P., Poli, P., Kobayashi, S., Andrae, U., Balmaseda, M. A., Balsamo, G., Bauer, P., Bechtold, P., Beljaars, A. C. M., van de Berg, L., Bid-lot, J., Bormann, N., Delsol, C., Dragani, R., Fuentes, M., Geer, A. J., Haimberger, L., Healy, S. B., Hersbach, H., Hólm, E. V., Isaksen, L., Kållberg, P., Köhler, M., Matricardi, M., McNally, A. P., Monge-Sanz, B. M., Morcrette, J.-J., Park, B.-K., Peubey, C., de Rosnay, P., Tavolato, C., Thépaut, J.-N., and Vitart, F.: The ERA-Interim reanalysis: configuration and performance of the data assimilation system, Q. J. Roy. Meteor. Soc., 137, 553–597, https://doi.org/10.1002/qj.828, 2011.
Ensminger, S. L., Evenson, E. B., Larson, G. J., Lawson, D. E., Alley, R. B., and Strasser, J. C.: Preliminary study of laminated, silt-rich debris bands: Matanuska Glacier, Alaska, USA, Ann. Glaciol., 28, 261–266, https://doi.org/10.3189/172756499781821850, 1999.
Fitzpatrick, A. A. W., Hubbard, A. L., Box, J. E., Quincey, D. J., van As, D., Mikkelsen, A. P. B., Doyle, S. H., Dow, C. F., Hasholt, B., and Jones, G. A.: A decade (2002–2012) of supraglacial lake volume estimates across Russell Glacier, West Greenland, The Cryosphere, 8, 107–121, https://doi.org/10.5194/tc-8-107-2014, 2014.
Fountain, A. G., Jacobel, R. W., Schlichting, R., and Jansson, P.: Fractures as the main pathways of wa-ter flow in temperate glaciers, Nature, 433, 618–621, https://doi.org/10.1038/nature03296, 2005.
Gardner, A. S. and Sharp, M. J.: A review of snow and ice albedo and the development of a new physically based broadband albedo parameterization, J. Geophys. Res.-Earth, 115, F01009, https://doi.org/10.1029/2009JF001444, 2010.
Hadziavdic, K., Lekang, K., Lanzen, A., Jonassen, I., Thompson, E. M., and Troedsson, C.: Characterization of the 18S rRNA gene for designing universal eukaryote specific primers, PLoS ONE, 9, e87624, https://doi.org/10.1371/journal.pone.0087624, 2014. Hawes, I. and Schwarz, A. M.: Absorption and utilization of
ir-radiance by cyanobacterial mats in two ice-covered Antarc-tic lakes with contrasting light climates, J. Phycol., 37, 5–15, https://doi.org/10.1046/j.1529-8817.1999.014012005.x, 2001. Hodson, A., Cameron, K., Bøggild, C., Irvine-Fynn, T.,
Lang-ford, H., Pearce, D., and Banwart, S.: Glacial ecosystems, Ecol. Monogr., 78, 41–67, https://doi.org/10.1890/07-0187.1, 2008. Hodson, A., Cameron, K., Bøggild, C., Irvine-Fynn, T., Langford,
H., Pearce, D., and Banwart, S.: The structure, biological activ-ity and biogeochemistry of cryoconite aggregates upon an Arc-tic valley glacier: Longyearbreen, Svalbard, J. Glaciol., 56, 349– 362, https://doi.org/10.3189/002214310791968403, 2010. Hodson, A., Paterson, H., Westwood, K., Cameron, K., and
Laybourn-Parry, J.: A blue-ice ecosystem on the margins of the East Antarctic Ice Sheet, J. Glaciol., 59, 255–268, https://doi.org/10.3189/2013JoG12J052, 2013.
Hoffman, M. J., Fountain. A. G., and Liston, G. E.: Near-surface internal melting: a substantial mass loss on Antarctic Dry Valley glaciers, J. Glaciol., 60, 361–374, https://doi.org/10.3189/2014JoG13J095, 2014.
Hopes, A., Thomas, D. N., and Mock, T.: Polar microal-gae: functional genomics, physiology, and the environ-ment, in: Psychrophiles: From Biodiversity to Biotechnology, chap. 14. Springer, Cham, Switzerland, 2017.
Irvine-Fynn, T. D. and Edwards, A.: A frozen asset: the potential of flow cytometry in constraining the glacial biome, Cytometry A, 85, 3–7, https://doi.org/10.1002/cyto.a.22411, 2014.
Irvine-Fynn, T. D. L., Edwards, A., Newton, S., Langford, H., Rassner, S. M., Telling, J., Anesio, A. M., and Hodson, A. J.: Microbial cell budgets of an Arctic glacier surface quanti-fied using flow cytometry, Environ. Microbiol., 14, 2998–3012, https://doi.org/10.1111/j.1462-2920.2012.02876.x, 2012. Karlstrom, L., Zok, A., and Manga, M.: Near-surface
permeabil-ity in a supraglacial drainage basin on the Llewellyn Glacier, Juneau Icefield, British Columbia, The Cryosphere, 8, 537–546, https://doi.org/10.5194/tc-8-537-2014, 2014.
Kumar, S., Stecher, G., and Tamura, K.: MEGA7: Molecular Evo-lutionary Genetics Analysis version 7.0, Mol. Biol. Evol., 33, 1870–1874, https://doi.org/10.1093/molbev/msw054, 2016. LaChapelle, E.: Errors in ablation measurements from
set-tlement and sub-surface melting, J. Glaciol., 3, 458–467, https://doi.org/10.3189/S0022143000017202, 1959.
Langford, H., Hodson, A., Banwart, S., and Bøggild, C.: The microstructure and biogeochemistry of Arc-tic cryoconite granules, Ann. Glaciol., 51, 87–94, https://doi.org/10.3189/172756411795932083, 2010.
Langley, E. S., Leeson, A. A., Stokes, C. R., and Jamieson, S. S.: Seasonal evolution of supraglacial lakes on an East Antarctic outlet glacier, Geophys. Res. Lett., 43, 8563–8571, https://doi.org/10.1002/2016GL069511, 2016.
Lim, Y. I. and Jørgensen, S. B.: Distributed Dynamic Models and Computational Fluid Dynamics, in: Computer Aided Process and Product Engineering (CAPE), chap. 2, Wiley-VCH, Weinheim, Germany, 2006.
Lutz, S., McCutcheon, J., McQuaid, J. B., and Benning, L. G.: The diversity of ice algal communities on the Greenland Ice Sheet as revealed by oligotyping, Microb. Genom., 4, e000159, https://doi.org/10.1099/mgen.0.000159, 2018.
Mankoff, K. D. and Russo, T. A.: The Kinect: A low-cost, high-resolution, short-range 3D camera, Earth Surf. Proc. Land., 38, 926–936, https://doi.org/10.1002/esp.3332, 2013.
Müller, F. and Keeler, C.M.: Errors in short-term ablation mea-surements on melting ice surfaces, J. Glaciol., 8, 91–105, https://doi.org/10.3189/S0022143000020785, 1969.
Munro, D. S.: Comparison of melt energy computations and ab-latometer measurements on melting ice and snow, Arct. Alp. Res., 22, 153–162, https://doi.org/10.2307/1551300, 1990. Munro, D. S.: Delays of supraglacial runoff from differently
de-fined microbasin areas on the Peyto Glacier, Hydrol. Process., 25, 2983–2994, https://doi.org/10.1002/hyp.8124, 2011. Pace, M. L. and Prairie, Y. T.: Respiration in lakes, in: Respiration in
aquatic ecosystems, Oxford Univ. Press, Oxford, UK, 103–122, 2005.
Priscu, J. C.: Limnological methods for the McMurdo Long Term Ecological Research Program, available at: http://mcm.lternet.edu/sites/default/files/MCM_Limno_ Methods_AC_23_Oct_2013.pdf (last access: 12 November 2018), 2013.
Priscu, J. C., Priscu, L. R., Howard-Williams, C., and Vin-cent, W. F.: Diel patterns of photosynthate biosynthesis by phytoplankton in permanently ice-covered Antarctic lakes un-der continuous sunlight, J. Plankton. Res., 10, 333–340, https://doi.org/10.1093/plankt/10.3.333, 1988.
Priscu, J. C., Fritsen, C. H., Adams, E. E., Giovannoni, S. J., Paerl, H. W., McKay, C. P., Doran, P. T., Gordon, D. A., Lanoil, B. D., and Pinckney, J. L.: Perennial Antarctic lake ice: an oasis for life in a polar desert, Science, 280, 2095–2098, https://doi.org/10.1126/science.280.5372.2095, 1998.
Pruesse, E., Peplies, J., and Glöckner, F. O.: SINA: ac-curate high-throughput multiple sequence alignment of ribosomal RNA genes, Bioinformatics, 28, 1823–1829, https://doi.org/10.1093/bioinformatics/bts252, 2012.
surface escape viral control?, Front. Microbiol., 7, 956, https://doi.org/10.3389/fmicb.2016.00956, 2016.
R Core Team: R: A language and environment for statistical com-puting. R Foundation for Statistical Computing, Vienna, Austria, available at: https://www.R-project.org/ (last access: 12 Novem-ber 2018), 2017.
Reynolds, H.: Evaluation of relationships between supraglacial stream discharge, ablation rates, and climate conditions at the Matanuska Glacier, Alaska, Geological Society of America, Ab-stracts with Programs, Boulder, CO, USA, 37, p. 84, 2005. Riebesell, U., Schloss, I., and Smetacek, V.: Aggregation
of algae released from melting sea ice: implications for seeding and sedimentation, Polar Biol., 11, 239–248, https://doi.org/10.1007/BF00238457, 1991.
Roslev, P. and King, G. M.: Application of a tetrazolium salt with a water-soluble formazan as an indicator of viability in respiring bacteria, Appl. Environ. Microbiol., 59, 2891–2896, 1993. Schloss, P. D., Westcott, S. L., Ryabin, T., Hall, J. R.,
Hart-mann, M., Hollister, E. B., Lesniewski, R. A., Oakley, B. B., Parks, D. H., Robinson, C. J., and Sahl, J. W.: Intro-ducing mothur: open-source, platform-independent, community-supported software for describing and comparing micro-bial communities, Appl. Environ. Microbiol., 75, 7537–7541, https://doi.org/10.1128/AEM.01541-09, 2009.
Scott, D., Hood, E., and Nassry, M.: In-stream uptake and retention of C, N and P in a supraglacial stream, Ann. Glaciol., 51, 80–86, https://doi.org/10.3189/172756411795932065, 2010.
Smith, L. C., Chu, V. W., Yang, K., Gleason, C. J., Pitcher, L. H., Rennermalm, A. K., Legleiter, C. J., Behar, A. E., Overstreet, B. T., Moustafa, S. E., and Tedesco, M.: Efficient meltwater drainage through supraglacial streams and rivers on the south-west Greenland ice sheet, P. Natl. Acad. Sci. USA, 112, 1001– 1006, https://doi.org/10.1073/pnas.1413024112, 2015.
Smith, L. C., Yang, K., Pitcher, L. H., Overstreet, B. T., Chu, V. W., Rennermalm, Å. K., Ryan, J. C., Cooper, M. G., Gleason, C. J., Tedesco, M., and Jeyaratnam, J.: Di-rect measurements of meltwater runoff on the Greenland ice sheet surface, P. Natl. Acad. Sci. USA, 114, E10622–E10631, https://doi.org/10.1073/pnas.1707743114, 2017.
Sole, A. J., Mair, D. W. F., Nienow, P. W., Bartholomew, I. D., King, M. A., Burke, M. J., and Joughin, I.: Seasonal speedup of a Greenland marine-terminating outlet glacier forced by sur-face melt–induced changes in subglacial hydrology, J. Geophys. Res.-Earth, 116, F03014, https://doi.org/10.1029/2010JF001948, 2011.
Stevens, I. T., Irvine-Fynn, T. D., Porter, P. R., Cook, J. M., Edwards, A., Smart, M., Moorman, B. J., Hodson, A. J., and Mitchell, A. C.: Near-surface hydraulic conductivity of northern hemisphere glaciers, Hydrol. Process., 32, 850–865, https://doi.org/10.1002/hyp.11439, 2018.
Stibal, M., Box, J. E., Cameron, K. A., Langen, P. L., Yallop, M. L., Mottram, R. H., Khan, A. L., Molotch, N. P., Chrismas, N. A., Calì Quaglia, F., and Remias, D.: Algae drive enhanced dark-ening of bare ice on the Greenland ice sheet, Geophys. Res. Lett., 44, 11463–11471, https://doi.org/10.1002/2017GL075958, 2017.
Stone, W. C., Hogan, B., Siegel, V., Lelievre, S., and Flesher, C.: Progress towards an optically powered cryobot, Ann. Glaciol., 55, 1–13, https://doi.org/10.3189/2014AoG65A200, 2014. Stone, W., Hogan, B., Siegel, V., Harman, J., Flesher, C., Clark,
E., Pradhan, O., Gasiewski, A., Howe, S., and Howe, T.: Project VALKYRIE: Laser-powered cryobots and other methods for penetrating deep ice on Ocean Worlds, Outer Solar System: Prospective Energy and Material Resources, Springer, Cham, Switzerland, 47–165, https://doi.org/10.1007/978-3-319-73845-1_4, 2018.
Takeuchi, N., Kohshima, S., and Segawa, T.: Effect of cryoconite and snow algal communities on surface albedo on maritime glaciers in south Alaska, Bulletin of Glaciological Research, 20, 21–27, 2003.
Taylor, G. T. and Sullivan, C. W.: Vitamin B12 and cobalt cycling among diatoms and bacteria in Antarctic sea ice microbial communities, Limnol. Oceanogr., 53, 1862–1877, https://doi.org/10.4319/lo.2008.53.5.1862, 2008.
Tedstone, A. J., Bamber, J. L., Cook, J. M., Williamson, C. J., Fet-tweis, X., Hodson, A. J., and Tranter, M.: Dark ice dynamics of the south-west Greenland Ice Sheet, The Cryosphere, 11, 2491– 2506, https://doi.org/10.5194/tc-11-2491-2017, 2017.
van Beusekom, A. E., O’Nell, S. R., March, R. S., Sass, L. C., and Cox, L. H.: Re-analysis of Alaskan benchmark glacier mass-balance data using the index method (No. 2010-5247), US Geo-logical Survey, available at: https://pubs.usgs.gov/sir/2010/5247/ pdf/sir20105247.pdf (last access: 12 November 2018), 2010. Yallop, M. L., Anesio, A. M., Perkins, R. G., Cook, J.,
Telling, J., Fagan, D., MacFarlane, J., Stibal, M., Barker, G., Bellas, C., and Hodson, A.: Photophysiology and albedo-changing potential of the ice algal community on the sur-face of the Greenland ice sheet, ISME J., 6, 2302–2313, https://doi.org/10.1038/ismej.2012.107, 2012.
Zawierucha, K., Kolicka, M., Takeuchi, N., and Kaczmarek, Ł.: What animals can live in cryoconite holes? A faunal review, J. Zool., 295, 159–169, https://doi.org/10.1111/jzo.12195, 2015. Zwally, H. J., Abdalati, W., Herring, T., Larson, K., Saba,