A LINEAR STATE ESTIMATION FORMULATION
FOR SMART DISTRIBUTION SYSTEMS
Shaik Bajani
1,
Md Feroz Ali
2,
Dr Abdul Ahad
31
Student, Dept.of EEE, Nimra College of Engineering & Technology, Ibrahimpatnam, VJA, (India)
2
Assotiate Professor, Dept.of EEE, Nimra College of Engineering & Tech., Ibrahimpatnam, (India)
3
Professor, Dept.of EEE, Nimra College of Engineering & Technology, Ibrahimpatnam, (India)
ABSTRACT
This project presents a linear zed, three-phase, and distribution class state estimation algorithm for applications
in smart distribution systems. Unbalanced three-phase cases and single-phase cases are accommodated. The
estimator follows a complex variable formulation and is intended to incorporate synchronized phasor
measurements into distribution state estimation. Potential applications in smart distribution system control and
management are discussed. Index Terms in this project are Distribution management systems, distribution
system monitoring and control, distribution system state estimation, power distribution engineering,
synchronized phasor measurements, three-phase unbalance.
I. INTRODUCTION
Distribution system monitoring, automation, control and operation are key challenges facing the Smart Grid.
Increased efficiency, reliability and flexibility may be achieved through enhancing these features of power
distribution. Direct load control, demand response (DR), increased renewable electric generation, and sensory
and communication networks are envisioned as part of the Smart Grid. The cited Smart Grid objectives motivate
the work reported in this paper, namely state estimation for distribution systems. Three-phase unbalanced radial
distribution power flow techniques based on ladder iterative or similar, methods are generally employed for
distribution system analysis. However, as utilities tend toward smart distribution systems, the need for enhanced
system This work was supported by the Power Systems Engineering Research Center, a Generation III Industry
University Cooperative Research Center, under grant NSF EEC-0001880 and EEC-0968993 and the Future
Renewable Electric Energy Distribution and Management Center (FREEDM), an Engineering Research Center
under grant NSFEEC-08212121.The authors are with the Department of Electrical, Computer, and Energy
Engineering, Arizona State University, monitoring and control based on real-time data becomes significant.
Smart distribution systems are characterized as having higher penetration of DG, DR enabled loads, and
controllable elements. Perhaps integral to the smart distribution system is the distribution management system
(DMS) where an information technology (IT) layer allows for enhanced automation and control functions.
Distribution automation (DA) and DM systems may generally include components of voltage or VAR control
and outage management. Its transmission engineering analog, energy management system (EMS), is used
extensively for near real-time analysis and control. The need for state estimation at the distribution level is
particularly acute in the smart distribution applications. For example, monitoring and situational awareness may
become necessary for: circuits with active DG injection where potential bi-directional power flows may occur in
each phase; exacerbation of voltage unbalance issues due to DG and stochastic loading; and assessment of
Other key developments in state estimation include incorporation of synchronized phasor measurement devices
and smart meter devices. In transmission state estimation, the former enables effective wide-area monitoring for
assessment of real-time system state. This is due to its ability to capture measurements in full phasor detail. The
latter has recently been adopted by utilities and is expected to drastically enhance monitoring and near real-time
data availability for distribution networks. Also automatic meter-reading, remote connect/disconnect and DR
initiatives, and variable pricing are enhanced.
II. STATE ESTIMATION FORMULATION FOR ELECTRIC POWER DISTRIBUTION
SYSTEMS
State estimation is a mathematical tool in which a set of measurements is combined with an assumed
mathematical model of a system so that the resulting set of equations relating measurements to the system are
satisfied in the least squares sense. That is, the system states are estimated using an over determined set of
equations whose right- and left-hand sides agree with a minimum squared difference. Mathematically, the
measurements are arranged in a vector and related to the system states by the vector valued function (of vector
valued argument). Attention turns to the development of a three-phase distribution state estimator. The basic
design of the estimator is non-iterative, purely real, linear zed and in full phase detail. In the distribution system
application, it is assumed that coincident demands (example: smart meter) and selected synchronous
measurements will be used. In the formulation below, data shall be represented in complex, rectangular, phasor
form. Three-phase unbalanced voltages and current measurements are envisioned along with some branch active
and reactive power flow measurements. Measurement vector, the state vector, and the process matrix are
complex quantities where the subscripts and refer to real and imaginary components. Note that differentiation
with respect to a complex variable is generally non analytic. Therefore is rewritten. Note that residual vector
may be separated into real and image.
III. LINEAR THREE-PHASE STATE ESTIMATOR
Attention turns to the development of a three-phase distribution state estimator. The basic design of the
estimator is non-iterative, purely real, linearized and in full phase detail. In the distribution system application, it
is assumed that coincident demands (e.g., smart meter [22]) and selected synchronous measurements will be
used. In the formulation below, data shall be represented in complex, rectangular, phasor form. Three-phase
unbalanced voltages and current measurements are envisioned along with some branch active and reactive
power flow measurements.
Then, the minimization of the 2-norm may directly follow (6), where the state variables in this case are
real-valued and partitioned into real and imaginary sub-vectors. Direct calculation for the 2-norm of a complex
IV. DISTRIBUTION SYSTEM MEASUREMENTS
The measurement paucity, characteristic of conventional distribution systems, motivated some researchers to
use historical data to supplant measurements to obtain an observable process matrix. However, reliance on
historical data with insufficient measurement redundancy may produce inconsistent results when loading
patterns deviate from history, or when unexpected outages and topology changes occur. In this case, the
estimator may provide spurious results. Exploiting the available real-time data may fulfill the objective of
enhanced decision making and control as envisioned for Smart Grid DMS and DA functions.
The state estimation formulation explored here exploits the advantages of the new technologies identified in
Section I as they relate to distribution system engineering. That is, the data gathered from smart meters provide
the requisite near real-time load measurement and potentially statistical data within short time intervals. Smart
meters may record and transmit active and reactive power, energy consumption over time intervals, example 5,
15, 60 min, and voltage magnitude data. Also, synchrophasors are envisioned to provide direct voltage phase
angle measurement for distribution buses. The practicality of this implementation is application dependent. Line
power Flows and current magnitudes may be ascertained via direct phasor quantity measurement. Note that
standards require measurement synchronization to within 1, which corresponds to 0.0216 phase error in a 60-Hz
system. Additionally, a maximum phase error of 0.57 produces total vector error (TVE), as defined in, of 1.0%
which is the maximum allowable TVE.
In the distribution state estimation formulation, it is assumed that both substation bus voltages and power flows
(or current magnitudes) are always available. Other assumptions include sufficient availability of near real-time
data (e.g., active and reactive power measurements, some voltage magnitudes and load power factors) to
complement the estimator. The measurements may come from smart meters at loads and from distribution class
synchrophasors at other buses. Assumed and measured load and DG injection currents are calculated. For
example, a constant power load (other models may be used) current injection may be found using where denotes
the phase and the voltage angle is assumed near nominal for that phase respectively, when not measured. If
measured via synchrophasor, the measured or that of a nearby bus may be used. Currents calculated in are
written in linear expressions in terms of the states, namely the bus voltages in rectangular notation. Substation
active and reactive power flows may be expressed in terms of real and imaginary part of currents which are also
linearly related to the states, particularly since substation bus voltage magnitude is known (as is impedance to
the first load node). Other load models may be employed. Field tuning of load models may be required for
verification, especially for power flow study accuracy. At the operating point, the solution to the system is
linear, irrespective of load model used according to.
The selection of weights for calculated, linearized currents may be approximated mathematically or determined
heuristically. Measured and are random variables each with an expected value and variance. Approximate
expressions for mean and variance of calculated currents may be obtained when measurements are treated as
independent random variables. The expected values of measured variables are, and their variance is chosen
based on transducer accuracy. Attention now turns to the approximation of variance of the calculated current.
The expectation of real and imaginary parts of (respectively) may be approximated from the nonlinear
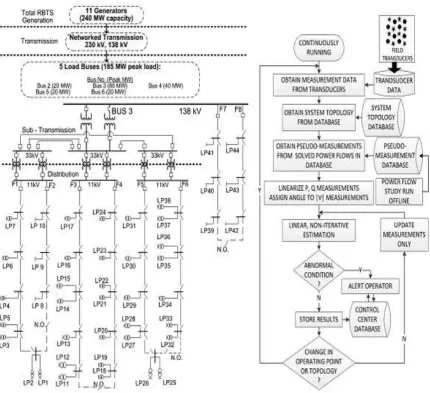
function Figure. 1. (Left) RBTS one-line diagram showing bus 3 distribution subsystem and load points (LP),
recreated from [34]; and (right) flowchart for the state estimation algorithm that runs continuously at the
approach may be taken: the variance of and may be approximated by choosing a value corresponding to the
largest variance (normalized) of all random variables, truncate the sum in to only the largest term.
Fig. 1. (Left) RBTS one-line diagram showing bus 3 distribution subsystem and load points (LP), recreated from
and (right) flowchart for the state estimation algorithm that runs continuously at the distribution substation
Figure 1 presents the one-line diagram for a sample distribution test system, denominated RBTS after its creator
Roy Billiton. Voltages range from 400 V–138 kV. Feeder F1 of this Control theory is an interdisciplinary
branch of engineering and mathematics that deals with the behavior of dynamical systems. The desired output of
a system is called the reference. When one or more output variables of a system need to follow a certain
reference over time, a controller manipulates the inputs to a system to obtain the desired effect on the output of
the system. The usual objective of control theory is to calculate solutions for the proper corrective action from
the controller that result in system stability, that is, the system will hold the set point and not oscillate around it.
V. EXPERIMENTAL RESULTS
Fig. 1 presents the one-line diagram for a sample distribution test system, denominated RBTS after its creator
Roy Billinton [34]. Voltages range from 400 V–138 kV. Feeder F1 of this system is modified to represent a
and two phase conductors and loads/load points (LP). Conductor details are provided in Table I. Power and
voltage bases are 100 MVA, 11 kV, and 415 V.
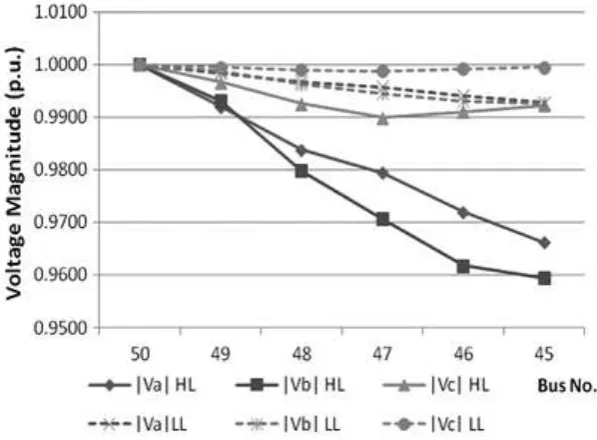
Fig. 2. Main feeder bus voltage magnitudes at heavy load (HL) and light (LL) load, RBTS feeder F1 (all
examples)
Fig. 3 Main feeder voltage magnitudes in HE5; exact data depicted from a three-phase power flow study, EX1a,
EX1b
VI. CONCLUSIONS
The well known weighted least squares method is used to develop linear, non-iterative power system static state
estimator for three-phase unbalanced distribution systems. The estimator is envisioned as a tool to aid system
monitoring, automation and control efforts in a Smart Grid environment. Decision making based on real-time
information communication and better control algorithms are made possible. The formulation presented and
examples incorporate smart meter data and synchronized phasor measurements at the primary distribution level.
Estimator performance is illustrated on a range of feeder loading conditions. Biasing measurements is shown to
increase expected accuracy. In the examples shown, relying on trusted measurements results in nearly an order
current magnitude errors from 15% down to 4%. Knowledge of bus voltage phase angle from synchronized
phasor measurements improves the state estimation process for power systems, and is shown here for
distribution circuits. The practicality of large scale deployment of synchrophasors measurements in distribution
systems is unknown. Direct measurement of bus voltage angle may be useful in distribution circuits for
ascertaining power flows (both directions and magnitudes). DG injections and loading conditions of feeders may
create an interesting case of bidirectional power flow. The estimator formulation presented here is shown to be
comparable to conventional estimation formulation of positive sequence quantities only, but the proposed
formulation has the advantage of providing full three-phase detail. Bad data detection is illustrated on the test
system.
REFERENCE
[1] R. E. Larson, W. F. Tinney, L. P. Hajdu, and D. S. Piercy, “State estimation in power systems part II: Implementation and applications,” IEEE Trans. Power App. Syst., vol. PAS-89, no. 3, pp. 353–363, 1970.
[2] I. Roytelman and S. M. Shahidehpour, “State estimation for electric power distribution systems in quasi
real-time conditions,” IEEE Trans. Power Del., vol. 8, no. 4, pp. 2009–2015, Oct. 1993.
[3] M. E. Baran and A. W. Kelley, “State estimation for real-time monitoring of distribution systems,” IEEE Trans. Power Syst., vol. 9, no. 3, pp. 1601–1609, Aug. 1994.
[4] M. E. Baran and A. W. Kelley, “A branch-current based state estimation method for distribution systems,” IEEE Trans. Power Syst., vol. 10, no. 1, pp. 483–491, Feb. 1995.
[5] C. N. Lu, J. H. Teng, andW. E. Liu, “Distribution system state estimation,” IEEE Trans. Power Syst., vol.
10, no. 1, pp. 229–240, Feb. 1995.
[6] R. Billinton and S. Jonnavithalu, “A test system for teaching overall power system reliability assessment,” IEEE Trans. Power Syst., vol. 11, no. 4, pp. 1670–1676, Nov. 1996.
[7] O. Alsac, N. Vempati, B. Stott, and A. Monticelli, “Generalized state estimation,” IEEE Trans. Power
Syst., vol. 13, no. 3, pp. 1069–1075, Aug. 1998.
[8] A. Monticelli, “Electric power system state estimation,” Proc. IEEE, vol. 88, no. 2, pp. 262–282, Feb. 2000.
[9] R. Ebrahimian and R. Baldick, “State estimator condition number analysis,” IEEE Trans. Power Syst., vol. 16, no. 2, pp. 273–279, May 2001.
[10] Office of Electric Transmission and Distribution, United States Department of Energy, Grid 2030: A National Vision for Electricity’s Second 100 Years. Washington, DC, Apr. 2003.
[11] J. Northcote-Green and R. G.Wilson, Control and Automation of Electrical Power Distribution Systems. Boca Raton, FL: CRC, 2006.
[12] W. H. Kersting, Distribution System Modeling and Analysis, 2nd ed. New York: CRC, 2007.
[13] A. J. Wood and B. F. Wollenberg, Power Generation Operation and Control, 2nd ed. New York: Wiley, 2007.
[14] R. Singh, B. C. Pal, and R.A. Jabr, “Choice of estimator for distribution system state estimation,” IET Gen., Transm., Distrib., vol. 3, no. 7, pp. 666–678, Jul. 2009.
[15] A.G. Phadke and J. S. Thorp, Synchronized Phasor Measurements and Their Applications. New York: Springer, 2010.
[16] D. Wight et al., Assessment of Demand Response and Advanced Metering Staff Report, U.S. Federal
Energy Regulatory Commission, Feb. 2011.
[17] S. Mak, “Smart meters serving as synchro-sensors for smart distribution grid applications,” in Proc. IEEE