O R I G I N A L A R T I C L E
Evaluation of larval growth process and bamboo consumption
of the bamboo powder-post beetle
Dinoderus minutus
using X-ray
computed tomography
Hiroki Watanabe•Yoshiyuki Yanase• Yoshihisa Fujii
Received: 6 October 2014 / Accepted: 20 December 2014 / Published online: 10 January 2015
ÓThe Japan Wood Research Society 2015
Abstract The bamboo powder-post beetle Dinoderus minutusis a major pest of felled bamboo in Japan. In this study, X-ray computed tomography (CT) was utilized to non-destructively trace the movement of the larvae ofD. minutusinside infested bamboo specimens and to evaluate the bamboo consumption of the larvae. The infested specimens, which had been enclosed with adultD. minutus beetles, were scanned using a microfocus X-ray CT system every 2 to 5 days. Larvae and other stages of the beetles were clearly recognizable in the CT images with a voxel size of 61.9lm, and they were distinguishable from the bamboo, insect tunnels, and frass. The larvae were traced until pupation, and the length and volume of their tunnels were measured to evaluate their bamboo consumption. The tunnel length and volume bored by one larva was estimated to be 0.98 mm and 1.06 mm3(0.70 mg of oven-dry mass) per day within the average observation period of 22 days, respectively, and the active larval period was estimated to be 39 days in our experimental conditions.
Keywords Powder-post beetleDinoderus minutus BambooX-ray computed tomography
Introduction
Bamboo has been widely used in Japan as a building material for decorative elements in traditional wooden houses, and for furniture or craft products. However, its vulnerability to insect attack limits its use, and thus mea-sures to protect bamboo materials from insects are neces-sary. This is especially important when bamboo is employed as laths that contribute to the strength of clay walls in wooden houses. Because bamboo laths are covered with clay, insect damage is not easily detected and the damage may become widespread, making the laths brittle and causing the wall to lose strength.
The bamboo powder-post beetle Dinoderus minutus (Fabricius) (Coleoptera: Bostrichidae) is one of the most significant pests of felled bamboo in Japan, whether it is in use or in storage. Mated adults enter bamboo from the cut surfaces, especially the end surfaces of culms, and oviposit inside. The hatched larvae develop by boring into and feeding on the parenchyma in the inner layer of culms and undergo ecdysis four times before pupation. The adults also feed on bamboo after emergence and leave via an exit hole to mate. D. minutus has one to four broods per year in Japan, and adults are seen from March to November. Tunnels bored by larvae run parallel to the grain and are filled with frass, which is a powdery mixture of excrement and bamboo fragments. Tunnels bored by adults, in con-trast, run in various directions and are hollow, discharging frass [1–4].
The most desirable process for insect control for bam-boo in storage or in use is to determine first if insect attack exists. If it exists, bamboo being stored before use should be disposed of, and bamboo in use should be either replaced or treated with insecticide if the attack is active. Effective insect-preventative measures should then be
Part of this paper was presented at the 25th annual meeting of the Japanese Society of Environmental Entomology and Zoology (Kobe, Japan, 2013) and the 45th annual meeting of the International Research Group on Wood Protection (St. George, Utah, USA, 2014).
H. Watanabe (&)Y. YanaseY. Fujii
Graduate School of Agriculture, Kyoto University,
Kitashirakawaoiwake-cho, Sakyo-ku, Kyoto 606-8502, Japan e-mail: [email protected]
taken for new bamboo without attack or old bamboo to avoid attack in the future. The use of chemical preserva-tives effectively increases bamboo resistance to insects, but it is not always recommendable considering both the expense and impacts on human health and the environment. Felling bamboo in the proper felling season, traditionally said to be from September to November, reduces the risk of insect attack because the starch content in culms is lower in this season [5]. However, prevention based solely on fell-ing season is imperfect, and it is disadvantageous that the felling season is limited to only few months per year. Therefore, appropriate measures of insect control are required. Nevertheless, the biology of D. minutus, espe-cially feeding activity, remains poorly understood. This data is especially relevant to establishing control measures. Furthermore, it is difficult to analyze the feeding activity of the larvae of D. minutus because they never leave the bamboo culm before emergence.
X-ray computed tomography (CT), which allows for the non-destructive analysis of the 3D-density distribution of an object, has been widely applied to assess the internal structures or defects of wood. X-ray CT has also been used to detect termite or beetle damage in wood [6–10]. For example, X-ray CT was used to visualize the gallery system of two drywood termite species, Cryptotermes secundus [6] and Incisitermes minor [7], and the oak platypodid beetle Platypus quercivorus [8] developed in wood. It was also used to image the bodies of the Asian longhorn beetle Anophophora glabripennis [9] and the anobiid beetle Priobium cylindricum [10] in wood. We, therefore, conducted this study to non-destructively observe the boring process of D. minutus larvae inside infested bamboo specimens using a microfocus X-ray CT system. We then used the data to estimate the bamboo consumption by the larvae.
Materials and methods
Experimental insects and bamboo specimens
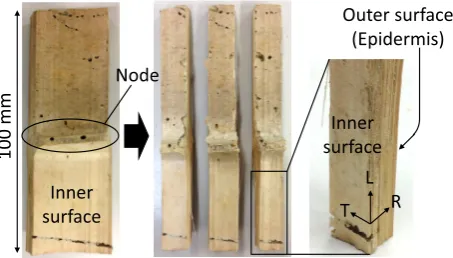
Adult D. minutus were collected from infested bamboo culms in Oita Prefecture, Japan and were bred using an artificial diet made of buckwheat flour, which was reported to be suitable for laboratory culture [11]. Bam-boo pieces (100 mm in length and ca. 35 mm in width), each with a node in the middle of its length, were pre-pared from non-treated, partly moist culms of madake (Phyllostachys bambusoides Siebold and Zucc.) felled in May 2013 in Kyoto Prefecture, Japan. A total of 25 adult beetles and 4 bamboo pieces were enclosed together in a plastic container with a vent hole and were left undis-turbed at room temperature (25–29°C) for 2 months so
that the adults could oviposit in the bamboo pieces. X-ray CT scans confirmed the existence of larvae inside the pieces.
In this experiment, one out of the four bamboo pieces was used for CT scanning. This piece was split into 3 thinner specimens as scanning objects so that their cross section would fit into the xy field of view when scanning (Fig.1). All of the 3 split specimens were kept in a glass bottle with the fiber direction vertical and were scanned every 2–5 days (mostly every 3 days). During the 2 month exposure, the specimens were considered to have reached an equilibrium moisture content of 12 %, which was obtained by oven drying of an uninfested bamboo piece under the same conditions.
CT scanning
Scans of the bamboo specimens were performed using a Microfocus X-ray CT System (SMX-160CT-SV3S, Shi-madzu Co., Japan) with half-scan cone-beam CT (Fig.2). The X-ray source was operated with a tube voltage of 70 kV and a tube current of 80 mA. The tomogram con-sisted of 464 slices, each of which contained the cross-sectional image and was 512 9512 pixels. The voxel size and the slice pitch of the tomogram were both 61.9lm under these scanning conditions, and the field of view was 31.7 mm along the x andy axes and 28.7 mm along the zaxis. The scanning time was 320 s, during which time the scanned object was irradiated and rotated by approximately 180°. The specimens were set at a constant height for every scan, but the height was adjusted when a target larva had moved out of thez-axis field of view. The 3D tomogram acquired from each CT scan was displayed in 2D grayscale images of three orthogonal planes, which are referred to as ‘‘CT images’’ in this paper. In a CT image, the gray level of a pixel is an index of density; the brighter the pixel, the denser the area.
L R T
100 mm
Node
Inner surface
Inner surface
Outer surface (Epidermis)
Results and discussion
Larval growth in CT images
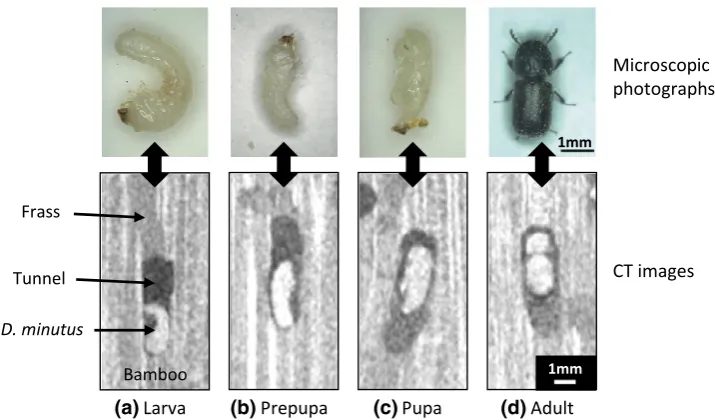
The CT images provided a clear macroscopic view of the inside of the scanned bamboo specimens. Figure3 shows example CT images capturing the silhouettes of the beetles. First, the bundle sheath fibers of the bamboo culm were separated from surrounding fundamental tissue composed of parenchyma cells, owing to the difference in density; the former were relatively brighter than the latter. Then, the silhouettes of insect bodies were apparent and had high gray value. The insect tunnels, whether they were hollow or filled with frass, were also visible, although in cases where the frass was as dense as the fundamental tissue of the specimens, the tunnels were not clearly separated. Furthermore, the stages of the beetle, larva, prepupa, pupa, and adult, were identified by the silhouettes.
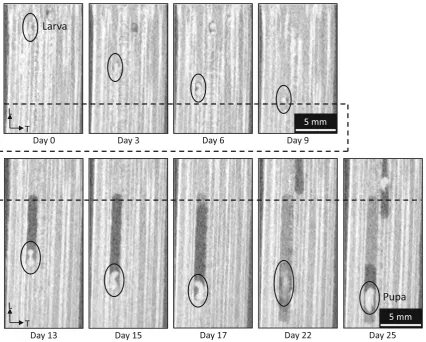
In this experiment, a total of seven larvae were traced until pupation. Figure4 shows an example of a series of CT images representing the movement of one of the larvae from the day it was first observed until it pupated. The larva was first observed on day 0 near the inner surface of the specimen. It bored downward along the fiber direction at all times. The entire tunnel was filled with dense frass, except for where the larva was present, until day 9. After day 13, a hollow part of the tunnel appeared, probably because the larva had bored a hole to the inner surface and frass was discharged from the hole. The size of the larva seemed to have changed by day 13, which suggested that it had undergone ecdysis and was in the final instar. On day 22, the silhouette of the larva is not seen clearly in the CT image, suggesting that it was not still during the 320 s of scan. The boring activity had stopped by day 22, and it was confirmed from the silhouette that the larva had pupated by day 25.
Figure5shows the 3D elongation of the tunnels of two larvae, Larvae 1 and 2, in one specimen, which were first observed on the same day. Larva 1 is the same individual as shown in Fig.4. The 3D image of the larval tunnels in Fig.5was created by marking only the pixels of the cross-section of the tunnels in each slice of the tomogram. Some parts of the tunnels where they are hollow were easily marked automatically by adjusting the threshold gray level. However, it was difficult to automatically identify the parts of the tunnels where they were filled with dense frass, so they were marked manually. The 3D image was displayed using volume graphic software VGStudio MAX 2.0.5 (Volume Graphics GmbH, Germany). In contrast to the tunnel of Larva 1, which was always bored linearly along the fiber direction, the tunnel bored by Larva 2 was somewhat more complex. Larva 2 reversed its boring X-ray source
Image intensifier Bamboo specimen
(Object) ca. 180° SID = 400 mm
SOD = 200 mm
FOV(z) = 28.7 mm
Fig. 2 Schematic diagram of the X-ray CT system.SIDsource to image intensifier distance,SODsource to object distance
Microscopic photographs
(a)Larva (c)Pupa (d)Adult
CT images Tunnel
Frass
D. minutus
Bamboo
1mm
(b) Prepupa
1mm
direction twice by day 13 and it bored slightly obliquely to the fiber direction between day 3 and day 9. The reason for this pattern of movement was not clear. Between day 17 and day 22, it bored in two different directions, probably to avoid encountering the nearby tunnel of Larva 1.
The rest of the larvae exhibited similar movement pat-terns; they mostly bored along the fiber direction, but they sometimes reversed direction or bored obliquely to the fiber direction, possibly to avoid encountering other indi-viduals or tunnels that could obstruct their movement. However, it was not possible to trace larvae when they were smaller than that shown in the first image of Fig.4 because they were easily lost sight of in the CT images.
The influence of X-ray irradiation on larval growth was considered in this experiment, but none of the observed larvae died before pupation and the estimated larval period (see the next section) was within the 20–40 days reported previously [1]. This led us to conclude that there was no apparent influence of X-ray irradiation in the experimental conditions employed, yet it needs to be confirmed in a more rigorous study by comparing the growth of irradiated larvae to that of control larvae.
Bamboo consumption of larvae
In order to evaluate the bamboo consumption by the larvae, the length and volume of their tunnels were calculated. Tunnel length was measured in pixels using image pro-cessing software ImageJ 1.45s (National Institutes of Health, USA), and the change in length from the previous scanning date was calculated in millimeters, converted from pixels. One method for calculating the volume of the tunnel was to accumulate the number of pixels in each slice that represented the cross section of the tunnel and convert it to a volume. However, it was often difficult to auto-matically identify the parts of the tunnel, as mentioned in the previous section, making this approach impractical. Therefore, we assumed that the cross section of the tunnel was elliptic (Fig.6) and used the following steps. First, the lengths of the major and minor axes of the cross section were measured in pixels in order to calculate the cross-sectional area of the tunnel. The cross-cross-sectional area was multiplied by the length change to calculate the volume change from the previous scanning date in cubic millime-ters. It should be noted that the image of a plane that
Day 13 L
T
Day 15 Day 17 Day 22 Day 25
Pupa
Day 3 Day 6 Day 9
Day 0
Larva
L
T 5 mm
5 mm
included or was close to the target larva was used to measure the cross-sectional area of the tunnel because there was usually no frass around the larva.
Figure7 shows the time courses of tunnel length obtained for seven larvae that were traceable until pupa-tion. The last plot of each graph represents the last day of the larval stage, when it had stopped boring activity in order to pupate. The seven larvae were traced for 22 days on average until pupation. Because they were not traced from the point of hatching and their instars were uncertain, the last plots of all graphs were placed at the origin. Thus, the abscissa represents the number of days before the end of larval boring activity, and the ordinate represents the length that would be bored by the end of larval boring activity. Many of the line graphs show step-wise incre-ments, suggesting that the larvae underwent ecdysis when the length did not increase. However, this remains uncer-tain because X-ray CT only provides information regarding the moment of the scan, and another approach is necessary to evaluate activity continuously. Although many of the graphs in Fig.7are step-wise, we assumed that the tunnel length increased proportionally over time in order to for-mulate the increase. The straight line in Fig.7 is the regression line for all plots through the origin and has a slope of 0.98. Thus, the tunnel length of one larva in these experimental conditions was estimated to increase by 0.98 mm per day within the average tracing period of 22 days.
Day 0
Day 3
Day 6
Day 9
Day 15 Day 13
Day 17
Day 22
Day 0
Day 3 Day 13
Day 15, 17 Day 6 Day 9
Day 22 Day 22
Day 25 Day 28
L
R
T
5 mm
Larva 1 Larva 2
Fig. 5 3D elongation of the tunnels of Larva 1 (left) and Larva 2 (right; labels italicized) in the same specimen
1mm
Outer surface
Inner surface
Larval tunnel
Fig. 6 The cross section of a tunnel assumed to be elliptical.White arrowsrepresent the two axes used to calculate tunnel area
Tunnel length (mm)
Time unl end of larval acvity (d)
Larva 1
Larva 2
-40 -30 -20 -10 0
-40 -20 -10 0
-30
-50
Figure8 shows the time courses of tunnel cross-sec-tional area for all larvae. The abscissa of the plots in Fig.8 represents the number of days before the end of larval boring activity, as in Fig.7. Increased tunnel cross-sec-tional area suggests that body size of larvae enlarged as they grew. The seven larvae were not traced from hatching and their actual larval period was unknown. Therefore, the length of the larval period was estimated by assuming that the cross-sectional area of the tunnel increased propor-tionally with time as a whole. The straight line in Fig.8is the regression line for all plots, which has anx-intercept of -39. Thus, the active boring period of the larvae in these experimental conditions was estimated to be 39 days.
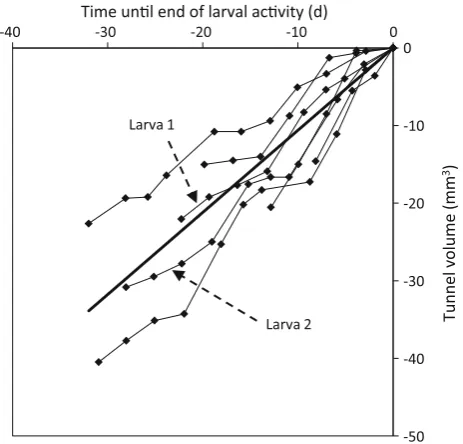
Figure9shows the time courses of tunnel volume for all larvae, which were calculated from the data represented in Figs.7 and8. The increase in tunnel volume was formu-lated in the same manner as tunnel length. The slope of the regression line in Fig.9 was 1.06, and thus the tunnel volume of one larva was estimated to increase by 1.06 mm3 per day within the average tracing period of 22 days. By multiplying the increase in tunnel volume by the oven-dry density of the inner layer of the bamboo culm, which was obtained from the same culm as the specimens, the oven-dry mass of bamboo bored by one larva was estimated to be 0.70 mg per day. This amount represents the daily damage caused by a larva.
The consumption in entire larval period is also important for understanding the biology and establishing control measures. The increases in tunnel length, volume, and bamboo mass consumed by one larva per day were mul-tiplied by the estimated larval period of 39 days to estimate that each larva bored 38 mm, produced tunnels that were 41 mm3, and consumed 27 mg of bamboo in its entire
larval period. However, these values may be overestimated since the consumption in early larval stage was not investigated in our experiment, and the certainty of these values should be verified in future research.
One major disadvantage of applying X-ray CT to monitor insect activity is that the obtained data are momentary and discontinuous. In our experiment, the scan intervals were mostly 3 days, and uncertainty remained regarding the activity of larvae between the scans. There-fore, a different approach with higher temporal resolution that could be used in a continuous, long-term measurement would be desirable. When wood-attacking insects, such as termites [12] and lyctus beetles [13], bite off a wood fragment, elastic waves called acoustic emission (AE) are produced. Because AE is directly related to the feeding activity of insects, AE monitoring may meet these requirements and is expected to be a valuable approach for future analysis.
Conclusions
Bamboo specimens infested with D. minutuslarvae were scanned using a microfocus X-ray CT system intermit-tently. The CT images clearly showed the silhouettes of the larvae and other stages, prepupa, pupa, and adult, and the movement of the larvae was traceable. The length, cross-sectional area, and volume of the tunnels obtained from the CT images were useful for estimating the daily bamboo
Tunne
l cr
oss-se
conal ar
e
a
(
m
m
2)
Time unl end of larval acvity (d) Larva 2
Larva 1 0.5
1.5 2 2.5
1
0
-40 -30 -20 -10 0
Fig. 8 Time courses of tunnel cross-sectional area of all larvae. The abscissa represents the time until the end of larval boring activity
Tunnel volume
(mm
3) Larva 1
Larva 2 Time unl end of larval acvity (d)
-40 -30 -20 -10 0
-40 -20 -10 0
-30
-50
consumption and active larval period of one larva. These findings draw the conclusion that X-ray CT scanning is a highly effective method for non-destructively and quanti-tatively assessing the extent of attack ofD. minutuslarvae in bamboo over time.
Acknowledgments The authors thank Mr. Shinji Ninomiya of Oita Industrial Research Institute, Japan for assistance in collectingD. minutus and providing information regarding the methods for breeding this beetle. This work was supported in part by a Grant-in-Aid for Scientific Research (No. 25242032 and No. 26450229) from the Japan Society for the Promotion of Science.
References
1. Yamano K (1969) Kenchiku-konchu-ki (Insect pests of buildings) (in Japanese). Sagami Shobo, Tokyo
2. The Society of House and Household Pests Science, Japan (1995) Kaoku-gaichu-jiten (Encyclopedia of house and household pests) (in Japanese). Inoue Shoin, Tokyo
3. Nair KSS, Mathew G, Varma RV, Gnanaharan R (1983) Pre-liminary investigations on the biology and control of beetles damaging stored reeds. KFRI Research Report 19, Kerala Forest Research Institute, Peechi
4. Garcia CM, Morrell JJ (2009) Development of the powderpost beetle (Coleoptera: Bostrichidae) at constant temperatures. Environ Entomol 38:478–483
5. Hirano Y, Shida S, Arima T (2003) Effect of cutting season on biodeterioration in Madake (Phyllostachys bambusoides) (in Japanese). Mokuzai Gakkaishi 49:437–445
6. Fuchs A, Schreyer A, Feuerbach S, Korb J (2004) A new tech-nique for termite monitoring using computer tomography and endoscopy. Int J Pest Manag 50:63–66
7. Himmi SK, Yoshimura T, Yanase Y, Oya M, Torigoe T, Imazu S (2014) X-ray tomographic analysis of the initial structure of the royal chamber and the nest-founding behavior of the drywood termiteIncisitermes minor. J Wood Sci. doi: 10.1007/s10086-014-1427-x
8. Sone K, Mori T, Ide M, Setoguchi M, Yamanouchi K (1995) Application of computer tomography to surveys of the galleries of the oak borer,Platypus quercivorus(MARUYAMA) (Cole-optera: Platypodidae) (in Japanese). Jpn J Appl Entomol Zool 39:341–344
9. Cruvinel PE, de Naime Joa˜o M, Borges M, Macedo A´ , Zhang A (2003) Detection of beetle damage in forests by X-ray CT image processing. J Braz For Sci 27:747–752
10. Kigawa R, Torigoe T, Imazu S, Honda M, Harada M, Komine Y, Kawanobe W (2009) Detection of insects in wooden objects by X-ray CT scanner (in Japanese). Sci for Conserv 48:223–231 11. Suzuki K, Kirton LG (1991) An evaluation of some cereal and
tuber based artificial diets for laboratory culture of Dinoderus minutus Fabricius (Coleoptera: Bostrichidae) (in Japanese). House Househ Insect Pests 13:59–65
12. Fujii Y, Noguchi M, Imamura Y, Tokoro M (1990) Using acoustic emission monitoring to detect termite activity in wood. For Prod J 40:34–36