18 | P a g e
Surface Water Quality Assessment of Gomti River Using
Index Analysis
Rupali Pal
1*, J. B. Srivastava
2Department of Civil Engineering, Institute of Engineering and Technology, Lucknow, India
1M. Tech Environment Engineering student,
2Professor Civil Engineering Department
*Corresponding Author
Abstract
This study emphasized on water quality status of River Gomti. Bascaron water quality index were used for
finding quality rating of River Gomti. Bascaron water quality index utilized data of pH, Biochemical oxygen
demand (BOD), dissolved oxygen (DO), Temperature, Total Coliform, Nitrate and Conductivity of 5
monitoring station along Gomti River from 2008 to 2016. Bascaron WQI represents similar trend over the
year but spatial distribution of WQI shows that water quality at Lucknow downstream were very poor. This
may be a reason of direct disposal of sewage and anthropogenic activities into river.The riveradditionally gets
industrial effluent load from different ventures in the catchment extend in Lucknow territory the
neighbourhood channels. Transfer of household and modern squanders in the waterway Gomti has turned into
an intense issue. Although water quality in Sitapur, Varanasi and Jaunpur were remain in acceptable range.
KEY WORDS
:Bascaron WQI, water quality, Gomti River, rating scale
1.
INTRODUCTION
The stream gathers a lot of human and mechanical contaminations as it moves through the exceedingly
prevalent territories (18 million approx.) of Uttar Pradesh. High contamination levels in the waterway
drastically affect the environment of the River Gomati. It gets agricultural runoff from its immense catchment
territory spread more than 10 district straightforwardly or all through is course, gets untreated raw sewage and
industrial effluents through more than 40 narrow ditches in Lucknow. The River Gomati starts from Gomat
Taal which was officially known as Fulhaar Jheel near Madhoganj Tanda town in Pilibhit region (U.P.). It
extends to 940 km through Uttar Pradesh and meets the Ganga River near Saidpur Kaithi in Varanasi. Its water
catchment area is around 22,735 Square Km. The urban communities of Lucknow, Lakhimpurkheri, Sultanpur
and Jaunpur are situated on the banks of the waterway Gomati and are the most noticeable of the 15 towns
situated in its catchment region. Its stream for the most part relies on event of downpour and accordingly the
stream in waterway is extremely permissive during rainstorm.
It’s five noteworthy tributaries and in excess of 40 drains in Lucknow (UPPCB, 2013). Other contamination
sources are washing of garments and creatures in the stream water. The waterway likewise gets industrial
contamination load from different industries in the catchment extends in Lucknow region. The amount of
19 | P a g e
(MLD). At present there is just a single treatment plant situated at Gaughat having capacity of 42 MLD to getthe sewage from Sarkata, Pata, and Nagaria just as from Gaughat itself. The water quality can be influenced
both by the chemical and biological contaminants. The imprudent transfer of waste effluents may taint the
water as a translocation of toxic chemicals and many lead to antagonistic impacts on living beings. The water
contamination has direct association with physio-chemical parameters on the off chance that they are found
above permissible limit.
Water quality index is a valuable and unique tool which is intended to simplify the quality status of a
water body on the basis of physical, chemical and biological parameters. The utilization of water quality index
(WQI) improves the introduction of consequences of an examination identified with a water body, as it
abridges in one worth or idea a progression of parameters broke down. Thus, the lists are extremely valuable to
transmit data concerning water quality to people in general as a rule, giving a smart thought of the
advancement inclination of water quality to advance over some period of time, other than permitting the
examination between various waterways or various areas along a similar course. The index choice decision
relies upon the contamination sources existent at the area and the proposed utilization of the water, and
further.The goal of this study is to exhibit a water quality assessment of Gomti River. The Gomti River was
picked for this study because it represents an environmental degradation situation that is becoming more and
more frequent.
WQI demonstrates the degree of contamination and adequacy of water. A portion of the water quality lists that
are oftentimes utilized in open area with the end goal of water quality appraisal incorporate, NSF Water
Quality Index (NSFWQI), Canadian Water Quality Index (CWQI), Florida Stream Water Quality Index
(FWQI), British Columbia Water Quality Index (BCWQI) and Oregon Water Quality Index (OWQI) (Said et
al., 2004). Regardless of the accessibility of water quality information, numerical device and PC learning,
endeavours are once in a while made to build up a client intelligent device for water quality examination
(Sarkar and Abbasi,2006) endeavoured advancement of a product device, QUALIDEX to create WQIs.
As WQIs are exceptionally abstract in nature, water quality evaluation is affected by the index used, assigned
weight, and adopted arrangement plan. Thus, in perspective on the everyday practice and key water quality
checking ventures in India, an endeavour is made to build up a client intuitive and independent apparatus,
Surface Water Quality Assessment Tool (SWQAT) more on the likelihood of achieving investigation for the
essential parameters.
Since the invention of the first WQI, proposed officially by Horton (1965), a few others have been created. In
1979, Bascaron built up a profoundly adaptable file designated WQIB. This index permits the presentation or
avoidance of parameters in concurrence with the requirements or restrictions for information obtaining
20 | P a g e
2.
METHODOLOGY
Dataset of water quality parameter from 2008 to 2016 were acquired from Central Pollution Control
Board (CPCB, ENVIS). Total of 6 water quality parameter were used for analysis: pH, biochemical oxygen
demand (BOD), dissolved oxygen (DO), electrical conductivity (EC), nitrate, total coliform and temperature.
The water quality data gathered from five collecting station along Gomti River. Selected stations are Sitapur
(S-1), Lucknow upstream (S-2), Lucknow downstream (S-3), Jaunpur (S-4) and Varanasi (S-5).
Bascaron developed a method for determination of water quality index in 1979. Bascaron water quality
index (WQIB) can be easily calculated by following formula (Abrahao, 2007):
WQIB = 𝐾 ∑𝐶𝑖𝑃𝑖
∑𝑃𝑖
Where,
K = adjustment constant on the basis of visual aspect of water body, 1 for clearly visible water with no
significant contamination, 0.75 for water having slight colour and turbidity, 0.5 for polluted water with
moderate to strong odour and 0.25 adopted for water having dark colour with fermentation and strong odour.
Ci = percentage value of different parameter (Table 1)
Pi= parameter weight of different parameter (Table 1)
paramete
r pH BOD DO
TEM
P
Total
Coli.
Nitrat
e
Conductivit
y
percentag
e
Unit mg/l mg/l °C
n°/100m
l mg/l µmhos/cm value
weight
(Pi) 1 3 4 1 3 2 4 (Ci)
1 >15 0 >50 >14.000 >100 >16.000 0
2 12 1 45 10 50 12 10
3 10 2 40 7 20 8 20
analytical 4 8 3 36 5 15 5 30
value 5 6 3.5 32 4 10 3 40
Of 6 5 4 30 3 8 2.5 50
paramete
r 6.5 4 5 28 2 6 2 60
9 3 6 26 1.5 4 1.5 70
8.5 2 6.5 24 1 2 1.25 80
8 1 7 22 500 1 1 90
7 <0.5 7.5 21 <50 0 <750 100
Table 1
21 | P a g e
The results of index analysis are exhibited quantitatively relating to evaluation from 0 to 100 and qualitativeresult corresponding to numerical result of water quality index are presented in rating scale as shown in Table
2.
Index Value Qualitative result
91 - 100 Good
61 - 91 Acceptable
31 - 61 Regular
16 - 31 Bad
0 - 16 Very Bad
Table 2
3.
RESULT AND DISCUSSION
Result of Bascaron water quality index obtained from water quality data of different monitoring station
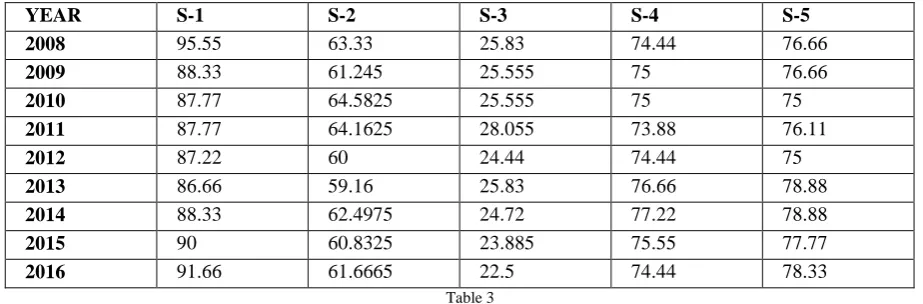
along river Gomti from 2008 to 2016 are shown in Table 3.
YEAR S-1 S-2 S-3 S-4 S-5
2008 95.55 63.33 25.83 74.44 76.66
2009 88.33 61.245 25.555 75 76.66
2010 87.77 64.5825 25.555 75 75
2011 87.77 64.1625 28.055 73.88 76.11
2012 87.22 60 24.44 74.44 75
2013 86.66 59.16 25.83 76.66 78.88
2014 88.33 62.4975 24.72 77.22 78.88
2015 90 60.8325 23.885 75.55 77.77
2016 91.66 61.6665 22.5 74.44 78.33
Table 3
From the outcome it was seen that uncontrolled pollution in Gomti River has brought titanic changes in
the water quality of river. Calculated Bascaron index value demonstrate that water quality of Sitapur (S-1)
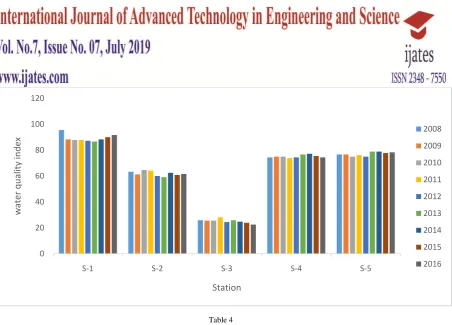
ranges from 86.66 to 91.66 which represent good quality of water. From the graph (Table 4) it was
demonstrated that WQI over the year are approximately alike but WQI of Lucknow downstream monitoring
station (S-3) indicate bad quality of water. This condition should be treated otherwise water quality get worsen
22 | P a g e
Table 4At the origin of Gomti River, water quality was good but as river moves through highly populated cities of
Uttar Pradesh its water quality deteriorates. At Sitapur monitoring station (S-1) water quality were good having
good appearance. As Gomti River enters Lucknow its water quality drops down under acceptable to bad
ranges. All river has self-cleansing tendency, organic matter present in water oxidized and DO content of water
again increased. Due to this again water regains its quality status.
4.
CONCLUSION
Bascaron water quality index is used for determining water quality status of Gomti River. From the result it is
concluded that water quality of Lucknow downstream is a matter of concern. Lucknow upstream station
having regular water quality which is again not good enough.This may be due to abundantly disposal of
untreated sewage into River. Some additional sewage treatment plant should be constructed in Lucknow so
that untreated sewage should be treated properly, and load on Gaughat sewage treatment plant could be
reduced. In Lucknow downstream station Gomti almost turns into a gutter having dark brown colour and
producing highly foul smell. Government and local people should take some initiative to resolve this problem.
REFERENCES
1) R. Abrahao, M. Carvalho, W. Junior, (2007), Use of index analysis to evaluate the water quality of a stream
receiving industrial effluents, Water SA Vol. 33
2) Bascaron GM (1979) Estabelecimiento de una metodologia para conocer la calidad del agua. Boletin
Informativo del Medio Ambiente 1 (1) 30-49.
3) Shukla, C. Ojha, R. Garg, (2017), Surface water quality assessment of Ganga river basin, India using index
mapping, IGARSS
4) A. Tiwari, A. Dwivedi, P. Mayank, (2016), Time scale changes in the water quality of the Ganga river, India
and estimation of suitability for exotic and hardy fishes, Hydrology current research
0 20 40 60 80 100 120
S-1 S-2 S-3 S-4 S-5
w
at
er
q
u
alit
y
in
d
ex
Station
2008
2009
2010
2011
2012
2013
2014
2015
23 | P a g e
5) R. Abrahao, M. Carvalho, W. Junior, (2007), Use of index analysis to evaluate the water quality of a stream
receiving industrial effluents, Water SA Vol. 33
6) A. Mustapha, (2014), Detecting surface water quality trends using Mann Kendall test and Sen’s slope
estimates, IJAIR
7) Singh, R. Srivastava, D. Mohan, (2017), Assessment of spatial and temporal variation in water quality
dynamics of river Ganga in Varanasi, Pollution
8) P. Tirkey, T. Bhattacharya, S. Chakraborty, (2013), Water quality indices- important tools for water quality
assessment: A review, International journal of advances in chemistry, Vol.1
9) A. Sharma, M. Naidu, A. Sargaonkar, (2013), Development of computer automated decision support system
for surface water quality assessment, Computers and geosciences
10) B. Hongmei, T. Xiang, L. Siyue, (2010), Temporal and spatial variation of water quality in the Jinshui river of
the South Qinling Mts., China, Ecotoxicology and environmental safety
11) M. Khan, K. Gani, G. Chajrapani, (2015), Assessment of surface water quality and its spatial variation. A case
study of Ramganga river , Ganga basin, India, Saudi society foe geosciences
12) A. Dunca, (2018), Water pollution and water quality assessment of major trans-boundary rivers from Banat,
Romania, Journal of chemistry
13) K. U. Ahmad, B. K. Nazary, P. Mudoi, (2015), Application of Regression analysis for surface water quality
modelling, IOSR-JMCE
14) M. A. Joarder, F. Raihan, (2008), Regression analysis of ground water quality data for Sunamganj,
Bangladesh, Int. J. Environ. Res. 2(3)
15) I. S. Akoteyon, Akintuyi, A. O., (2013), regression model for predicting water quality parameter: study of
Igando, Lagos- Nigeria, AASRC, vol. 5