Original Research Article
Health seeking behaviour in pulmonary tuberculosis:
a cross sectional study
Jebamalar J.
1, Priya Senthilkumar
2*, Mary Ramola
2INTRODUCTION
Even though tuberculosis is a preventable and curable health problem, it is one of the top 10 causes of death worldwide. India accounts for 20-25% of the global burden of tuberculosis with respect to prevalence, incidence and mortality. The situation is further aggravated by issues like multidrug resistance, HIV/AIDS, diabetes mellitus, prevalence in the pediatric age group, smoking, malnutrition and other immunocompromised states.1
About one-quarter of the world’s population has latent tuberculosis, which means people have been infected with the bacteria but are not (yet) ill with disease and cannot transmit disease. People infected with
Mycobacterium tuberculosis have a 5-15% lifetime risk of falling ill with tuberculosis. The progression from infection to disease is determined by a number of additional factors. But during this progress, the person may not experience obvious symptoms for a long time. This leads to delays in seeking treatment. Furthermore, people with active tuberculosis can infect 10-15 other
ABSTRACT
Background: Health seeking behaviour has been identified as a complex and dynamic process which influences disease burden of tuberculosis. The present study aimed to study health seeking behaviour among pulmonary tuberculosis patients in a metropolitan city and to assess diagnostic and treatment delays and their determinants.
Methods: A cross sectional study was conducted among newly diagnosed pulmonary tuberculosis patients registered for intensive phase of Category 1 ATT during the study period in Zone VIII of Chennai Corporation. The sample size was 197. The study was conducted over a period of one year from September 2015 to August 2016. A standardized WHO interview schedule on diagnostic delay was used for the study.
Results: Patients sought healthcare for more severe symptoms like hemoptysis (delay of 38 days) earlier than for cough (delay o- 8 days). Other reasons for delay in seeking care were hope of self-resolution, financial constraints, fear of what the diagnosis would be, incompatible timings etcetera. The total mean delay from onset of symptoms till start of treatment was around 47 days, out of which the patient delay was 42 days. Factors significantly associated with delay included smoking, age more than 35 years and not approaching healthcare facilities first.
Conclusions: An unacceptably high patient delay is the major contributor to total delay in the diagnosis and treatment of pulmonary tuberculosis patients. There is increased odds of delay among smokers compared to those who have never smoked. So smokers may be added to the high risk group for suspicion of tuberculosis for fast tracking of diagnosis and treatment. Furthermore, methods to curb over the counter medications should be explored.
Keywords: Tuberculosis, Delays, Health seeking
Department ofCommunity Medicine, 1Govt. Villupuram Medical College, 2Govt. Kilpauk Medical College, Chennai, Tamil Nadu, India
Received: 01 March 2018
Revised: 15 March 2018 Accepted: 17 March 2018
*Correspondence:
Dr. Priya Senthilkumar,
E-mail: [email protected]
Copyright: © the author(s), publisher and licensee Medip Academy. This is an open-access article distributed under the terms of the Creative Commons Attribution Non-Commercial License, which permits unrestricted non-commercial use, distribution, and reproduction in any medium, provided the original work is properly cited.
people through close contact over the course of a year. Without proper treatment, 45% of HIV-negative people with TB on average will die.1 In view of the infectivity of untreated cases, it has been recognized that the most effective intervention is early case detection with prompt management to decrease infectivity and the risk of exposure. Thus, health seeking behavior of chest symptomatics and tuberculosis cases, gains importance. This is more so because there is an abundance of evidence that providing education and knowledge at the individual level is not enough in itself to promote a change in behaviour. Good health seeking behaviour is rooted in a more dynamic, collective and interactive system, consisting of geographical, social, economic, cultural and organizational factors.
Health seeking behaviour in tuberculosis patients has been studied previously. The proportion of individuals with symptoms suggestive of tuberculosis who seek healthcare ranged from 13.3% in rural China to 84% in rural Nigeria.2,3 The time duration between onset of symptoms and seeking healthcare varied from 10 days in South India to 30 days in rural Africa and 50-59 days.4–8 Several studies demonstrate that the determinants of not seeking care or delay in doing so, were: less education, poor socio-economic status, increased age (>45 years), social stigma, work pressure, financial constraints, relatively less severity of symptoms, decreased awareness, poor accessibility to facilities, dissatisfaction with available facilities, unemployment etcetera.4,6,3,9–12 The commonly cited reasons for seeking healthcare include good accessibility to facilities, confidence that the condition can be cured, worsening symptoms and previous history of similar illnesses.10 All these issues throw a spanner in the works of the Revised National Tuberculosis Control Program in India. Although India achieved the Millennium Development Goals pertaining to tuberculosis, the challenge continues to be daunting. The present study was conducted in one particular zone within the Chennai Municipal Corporation. It aimed at assessing health seeking behaviour, delay in diagnosis and treatment among pulmonary tuberculosis patients. Very few similar studies have been conducted in the Chennai Metropolitan Region previously.
METHODS
A cross sectional study was conducted among newly diagnosed pulmonary tuberculosis patients above 18 years of age registered for intensive phase of Category 1 ATT during the study period in Zone VIII of Chennai Corporation. Those with HIV/TB co-infection were excluded since they were being screened for chest symptoms during their visits to the ART clinics.
Sample size and sampling technique
Studies have shown that around 69.4% of the patients were not diagnosed at their first point of contact with a
health facility.13 Hence P is taken as 69.4% with 5% alpha error and relative precision (E) of 10%. The following formula was used:
N = (Zα/2) (PQ)2
E2
The sample size was calculated to be 177. Assuming a non-response rate of 10%, the corrected sample size was 197.
Approval was obtained from the Institutional Ethics Committee. Necessary permissions were procured from Corporation of Chennai and the Medical Officers for TB control.
Study tool
A standardized WHO interview schedule on diagnostic delay adapted from a study in the Eastern Mediterranean region was used for this study.14 The questionnaire was translated into the vernacular language, with the help of an expert on Tuberculosis and a language professor. It was then back translated and compared. A pilot tests was conducted to check for discrepancies and modified. The questionnaire was administered by the investigator to the eligible participants after obtaining informed written consent.
Operational definitions
Diagnostic delay: Time interval from onset of symptoms till the diagnosis of tuberculosis.
Treatment delay: Time interval between diagnosis of tuberculosis and initiation of anti-tuberculous treatment.
Patient delay: Time interval between onset of symptoms and presentation to a healthcare provider.
Healthcare system delay: Time interval between the date at which the patient seeks a healthcare provider and the initiation of anti-tuberculous treatment.
Total delay: Time interval between the onset of symptoms and the initiation of anti-tuberculous drugs. It can be seen as the sum of either diagnostic delay and treatment delay or patient delay and healthcare system delay.
Statistical analysis
The collected data was entered in Microsoft Excel and analyzed using the Statistical Package for Social Sciences trial v.22.
Descriptive statistics
means, medians with interquartile ranges are also presented as means are sensitive to outliers.
Inferential statistics
Patients’ satisfaction with care offered at the healthcare facilities are compared across gender using Mann Whitney U test, since the responses are not normally distributed and hence non-parametric tests are to be applied. The median value for each type of delay is used as the cut-off value in order to transform the numerical variable into a dichotomous categorical variable. Bivariate analysis was performed to assess relationship between the independent variables and the dependent variable (delay). The unadjusted odds ratios are expressed along with 95% confidence intervals. Significant predictor variables thus identified were included in a multiple logistic regression model for determining relationship between the predictor variables and the outcome variable. The adjusted odds ratio (prevalence odds) is given with 95% confidence intervals.
RESULTS
A total of 197 patients were interviewed.
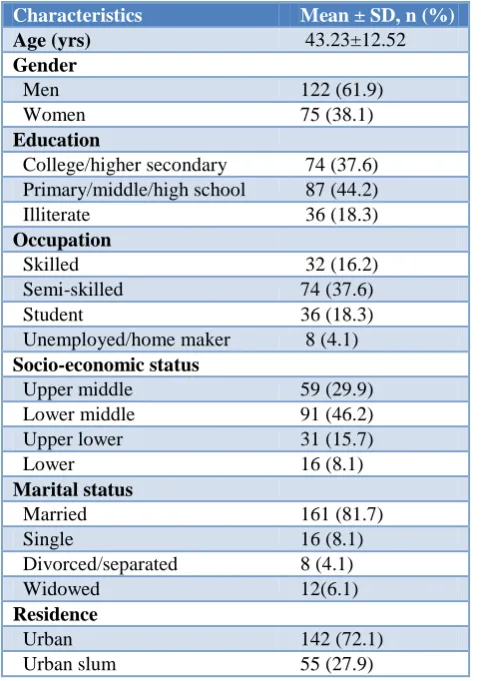
Table 1: Socio-demographic profile of the study population.
Characteristics Mean ± SD, n (%)
Age (yrs) 43.23±12.52
Gender
Men 122 (61.9)
Women 75 (38.1)
Education
College/higher secondary 74 (37.6) Primary/middle/high school 87 (44.2) Illiterate 36 (18.3)
Occupation
Skilled 32 (16.2)
Semi-skilled 74 (37.6)
Student 36 (18.3)
Unemployed/home maker 8 (4.1)
Socio-economic status
Upper middle 59 (29.9) Lower middle 91 (46.2) Upper lower 31 (15.7)
Lower 16 (8.1)
Marital status
Married 161 (81.7)
Single 16 (8.1)
Divorced/separated 8 (4.1)
Widowed 12(6.1)
Residence
Urban 142 (72.1)
Urban slum 55 (27.9)
The socio-demographic profile of the study population is given in Table 1. With respect to co-morbidities, around 36% and 26% of the patients were suffering from diabetes mellitus and hypertension respectively. 4% of the sample had chronic obstructive pulmonary disease. History of smoking, alcoholism and contact with an active case of tuberculosis is mentioned in Table 2.
Table 2: History of substance abuse and contact with active tuberculosis.
Variables n (%)
Smoking
Never 112 (56.9)
Current 66 (33.5)
Ex-smoking 19 (9.6)
Daily consumption of cigarettes
Median (IQR) 5 (3- 5)
Range 2- 20
Smoking duration in years
Median (IQR) 15.5 (10- 20.75)
Range 2 - 40
Alcohol use 47 (23.9)
Known exposure to TB patient 44 (22.3)
The most common symptom for which the patients initially sought healthcare were cough in 72.1% of the patients, with a mean duration of 38.25 days. Hemoptysis was associated with shorter delay in seeking care (Table 3).
Table 3: Common symptoms and the duration between their onset and seeking healthcare.
Symptoms N (%) Mean±SD
(days)
Median (IQR)
Cough 142 (72.1) 38.25±21.38 30 (21-45)
Fever 19 (9.6) 10.8±3.66 10 (7-14)
Loss of weight 11 (5.6) 1.77±1.09 2 (1-2)
Hemoptysis 62 (31.5) 8.36±3.74 7 (5-10)
Chest pain 44 (22.3) 5.16±2.55 5 (3-7)
Patients were enquired regarding their first course of action after onset of symptoms. Almost three-fifths of the patients sought healthcare providers. Among the patients who sought pharmacies for treatment, easy accessibility and availability of over-the-counter medications were cited as reasons. Self-medicated with drugs already present at home, which were bought for previous similar illnesses, traditional medicines were other measures undertaken by the patients (Figure 1).
Figure 2: Reasons for delaying consultation-from a health system perspective.
The patients were asked what made them delay seeking healthcare from their own perspective. The most common reason given was that they hoped for self-resolution of symptoms (46.7%). The reasons provided by the patients are mentioned in Figure 2.
Among the study participants, 58.4% had sought a healthcare provider as the first course of action for their symptoms. The remaining participants (41.6%) were asked what factors in the health system led them to delay seeking care.
Table 4: Satisfaction with care provided-comparison across genders.
Variable P value
Availability of services <0.01
Prompt action from Health care
provider 0.09
Well-equipped facility 0.04*
Free medicines 0.01*
Accessibility 0.55
Optimal workload 0.52
Waiting time 0.92
Satisfaction with the care offered by healthcare providers was measured on a Likert scale. There was no significant difference in satisfaction with care between men and women (Table 4).
At times, more than one healthcare provider needed to be consulted, before the final diagnosis of Tuberculosis was made. But in most cases (64.5%), the first healthcare providers themselves were able to diagnose with around 35.5% missing out.
During their visits to the healthcare provider who made the diagnosis, they sometimes required more than one visit to diagnose. 43.7% were diagnosed in their first visit, and 98% were diagnosed by the second visit. Only 2% required a third visit before diagnosis.
Majority of the patients (57.9%) were diagnosed at tuberculosis centers while around one-third (32%) were diagnosed at primary health centers. Only 10% of the patients were diagnosed at private clinics or hospitals before being referred to the DOTS centers for management.
When asked about geographical access to nearest healthcare facility, 74.1% reported that it was within 15 minutes’ reach. The rest reported that it took them around 16-30 minutes to reach the nearest healthcare facility. This was because walking was predominantly the mode of travel to healthcare facilities.
Table 5: Delays in diagnosis and treatment of tuberculosis.
Delay (days) Mean (95% C.I)
Median (Interquartile range)
Patient delay 42 (38.69, 45.31) 35 (25, 50)
Health system
delay 4.72 (4.41, 5.03) 4 (3,6)
Diagnosis delay 42.82 (39.38,
46.36) 36 (26,51)
Treatment
delay 3.9 (3.67, 4.13) 3 (3,5)
Total delay 46.72 39 (28,55)
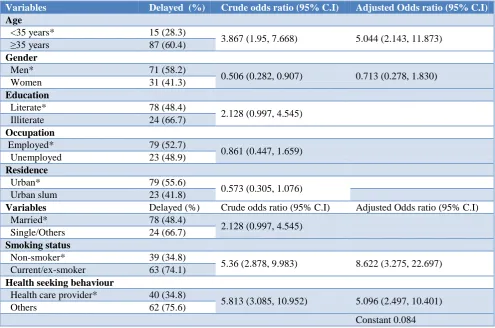
The duration of delays in diagnosis and treatment of tuberculosis were measured. The mean delay in days with 95% confidence intervals and the median duration with interquartile ranges have been presented in Table 5. For the bivariate analysis, total delay was classified according to the median cut off as <39 days and ≥39 days (longer delay). The results of the bivariate and multivariate analysis demonstrate that age more than 35 years, smoking and first point of contact not being healthcare providers are associated with increased odds of delay. Females had lesser odds of delay compared with males (Table 6).
with an increased odds of delay. Comparing the results of the bivariate and multivariate analysis, it is inferred that smoking has been a confounding factor. Most of the smokers are men, and smoking is significantly associated with longer delay in seeking health care. Hence, gender, which was a significant predictor variable in the bivariate
analysis, is not statistically significant in the multivariate analysis after adjusting for smoking (Table 6). Neither the time taken by the patients to reach the facility or the satisfaction with the care offered there were significantly associated with delays (Table 7 and 8).
Table 6: Patient-related variables and their association with delay.
Variables Delayed (%) Crude odds ratio (95% C.I) Adjusted Odds ratio (95% C.I)
Age
<35 years* 15 (28.3)
3.867 (1.95, 7.668) 5.044 (2.143, 11.873) ≥35 years 87 (60.4)
Gender
Men* 71 (58.2)
0.506 (0.282, 0.907) 0.713 (0.278, 1.830)
Women 31 (41.3)
Education
Literate* 78 (48.4)
2.128 (0.997, 4.545) Illiterate 24 (66.7)
Occupation
Employed* 79 (52.7)
0.861 (0.447, 1.659) Unemployed 23 (48.9)
Residence
Urban* 79 (55.6)
0.573 (0.305, 1.076)
Urban slum 23 (41.8)
Variables Delayed (%) Crude odds ratio (95% C.I) Adjusted Odds ratio (95% C.I)
Married* 78 (48.4)
2.128 (0.997, 4.545) Single/Others 24 (66.7)
Smoking status
Non-smoker* 39 (34.8)
5.36 (2.878, 9.983) 8.622 (3.275, 22.697) Current/ex-smoker 63 (74.1)
Health seeking behaviour
Health care provider* 40 (34.8)
5.813 (3.085, 10.952) 5.096 (2.497, 10.401)
Others 62 (75.6)
Constant 0.084
*indicates reference variable.
Table 7: Association of time to reach facility and delay.
Predictor variable Crude Odds ratio (95% C.I)
Time taken to reach health facility
<15 min*
0.841 (0.444, 1.593)
>15 min
Table 8: Association of satisfaction with care and delay.
Variable P value
Availability of services 0.62
Prompt action from Health care provider 0.3
Free medicines 0.86
Accessibility 0.6
Optimal workload 0.49
Waiting time 0.056
To summarize, patient delay was the major contributor to the total delay in the diagnosis and treatment of tuberculosis. Age >35 years, smoking and not seeking a health care provider as the first point of contact were the
DISCUSSION
Regarding socio-demographic profile of the population under study, it is to be noted that the population was more educated and literate, had a higher rate of employment and a higher proportion of married individuals, compared to the WHO 2006 study conducted in the Eastern Mediterranean which provided the basis for the interview schedule used in the present study.14
It was observed that the more acute symptoms like hemoptysis and chest pain led to more prompt efforts on the patients to seek healthcare, compared to perceived ‘minor’ symptoms like cough and loss of weight. The study estimated that 58.4% of the patients sought a healthcare provider as the first course of action for their symptoms. This is in contrast to previous studies which estimated this proportion to be 23% and 13.3%. Similar to some other studies, self-medication and traditional medications were also cited as first course of action for symptoms.10,15–18 Self-medication with over-the-counter (OTC) drugs may have provided the temporary relief of symptoms, leading to a delay in seeking healthcare. Among those who did not seek a healthcare facility first for their symptoms, 39% mentioned inconvenient timings as the major reason. They were unable to take a day off or avail permission from their workplace. This finding was in accordance with the study by Ghosh et al in slums of West Bengal.11 In the case of older women, difficulty in walking to the healthcare facility was stated as one of the major reasons. Both genders cited waiting times as an additional reason for not consulting a facility. Ukwaja et al reported longer walking distances and waiting times to be associated with delay in rural Nigeria.3
The present study determined that both men and women consulting a healthcare provider were satisfied with the quality of care. There was no significant difference in the satisfaction with healthcare between patients who had sought care earlier and those who delayed. In contrast, the study by Charles et al, dissatisfaction with the quality of care was one of the major reasons for not seeking healthcare.4
It was estimated that 35.5% of the patients missed being diagnosed in their first visit to the healthcare facility. In the study by Ananthakrishnan et al, 69.4% were missed in their first visit in 2007.13 This indicates that over the years, the proportion of patients who are not diagnosed accurately in their first visits has declined considerably. In the present study, there was a mean patient delay of 42 days and a median delay of 35 days. This finding was higher than in other studies, in which the median delay was usually less than three weeks, but Hamza et al reported a median patient delay of 30 days, which was closer to the present findings.4,13,17–23 Some studies
reported longer median patient delay of 50 and 59 days respectively.7,8
The median health system delay was 4 days, which was less than the values reported by most other studies.7,8,18–
20,22 The median total delay in this study was 39 days,
which is similar to the study by Hamza et al which reported a median delay of 40 days.23 Other studies report a much longer delay.7,8,3,18,19,21,24,25 Overall, the median patient delay in the present study is longer than most other studies, while the health system delay and total delay were lesser.
The significant factors associated with total delay in this study were age >35 years, smoking, stigma and not consulting a health care provider as the first point of contact. Older age groups were significantly associated with delay in the studies by Ukwaja et al, Godfrey-Faussett et al, Storla et al and Ngangro et al.3,16,26,27 Gender was associated with longer delays in some studies which was not the case in the present study, after adjusting for other factors.14,26
Smoking was strongly associated with longer patient delays. Compared to non-smokers, current or ex-smokers had 8.622 times the odds of longer delays. The 95% confidence interval ranges from 3.275 to 22.697. Smoking is significantly associated with delays in some other studies as well.7,16,20,25 In the present study, smokers reported that they tended to perceive cough symptoms as due to smoking and hence delay seeking health care. This might be a contributing factor to prolonged patient delay in smokers.
Health care provider related factors such as time to reach health facility and timings were significant factors in other studies, but were not significantly associated with increased total delay in the present study.3,14,19,20 The probable reason might be that the study setting was an urban area and the time taken to reach health care facilities was less than 30 minutes. Hence, even though some participants reported difficulty in walking to health care facilities, it was not significantly associated with delay in getting diagnosed and treated.
In spite of the current recommendations stating that cough for more than 2 weeks is an indication for sputum AFB testing, an unacceptably high patient delay is the major contributor to total delay in the diagnosis and treatment of pulmonary tuberculosis patients. Many of the patients sought healthcare only after the onset of more severe symptoms like chest pain and hemoptysis. Factors such as easy availability of over-the-counter (OTC) medications add to the delay.
people are exposed to an increased risk of acquiring the infection from smokers who have TB.
Based on the present findings, smokers may be added to the high-risk group of HIV-positives, diabetics, contacts of active tuberculosis etcetera, for increased suspicion of tuberculosis when they experience chest symptoms. In addition to anti-smoking efforts, awareness about the increased risk needs to be developed.
Furthermore, the necessary changes in the health systems for reduction in over-the-counter supply of drugs through stringent monitoring may need to be implemented to facilitate better health seeking behaviour among chest symptomatics. More aggressive campaigns to increase the awareness about cough more than 2 weeks as suggestive of suspected tuberculosis.
As the world moves from the era of ‘Stop TB’ into the era of era of ‘End TB’, India which has achieved major milestones in prevention and control, needs to consolidate the gains and launch a multi-pronged assault on tuberculosis.
ACKNOWLEDGEMENTS
The authors wish to thank the Programme managers and staff of the Revised National Tuberculosis Control Programme of Chennai Corporation in providing permission to conduct the study and their support.
Funding: No funding sources Conflict of interest: None declared
Ethical approval: The study was approved by the Institutional Ethics Committee of Government Kilpauk Medical College, Chennai, India
REFERENCES
1. WHO. Tuberculosis. WHO. Available from: http://www.who.int/mediacentre/factsheets/fs104/en /. Accessed on 10 March 2018.
2. Wang WB, Jiang QW, Chen Y, Xu B. Pathways from first health care seeking to diagnosis: obstacles to tuberculosis care in rural China. Int J Tuberc Lung Dis Off J Int Union Tuberc Lung Dis. 2007;11(4):386–91.
3. Ukwaja KN, Alobu I, Nweke CO, Onyenwe EC. Healthcare-seeking behavior, treatment delays and its determinants among pulmonary tuberculosis patients in rural Nigeria: a cross-sectional study. BMC Health Serv Res. 2013 Jan 17;13:25.
4. Charles N, Thomas B, Watson B, Raja Sakthivel M, Chandrasekeran V, Wares F. Care seeking behavior of chest symptomatics: a community based study done in South India after the implementation of the RNTCP. PloS One. 2010;5(9):e12379.
5. Yimer S, Holm-Hansen C, Yimaldu T, Bjune G. Evaluating an active case-finding strategy to identify smear-positive tuberculosis in rural
Ethiopia. Int J Tuberc Lung Dis Off J Int Union Tuberc Lung Dis. 2009;13(11):1399–404.
6. Mesfin MM, Newell JN, Walley JD, Gessessew A, Madeley RJ. Delayed consultation among pulmonary tuberculosis patients: a cross sectional study of 10 DOTS districts of Ethiopia. BMC Public Health. 2009;9:53.
7. Basnet R, Hinderaker SG, Enarson D, Malla P, Mørkve O. Delay in the diagnosis of tuberculosis in Nepal. BMC Public Health. 2009;;9:236.
8. Osei E, Akweongo P, Binka F. Factors associated with DELAY in diagnosis among tuberculosis patients in Hohoe Municipality, Ghana. BMC Public Health. 2015;15:721.
9. Kasse Y, Jasseh M, Corrah T, Donkor SA, Antonnio M, Jallow A, et al. Health seeking behaviour, health system experience and tuberculosis case finding in Gambians with cough. BMC Public Health. 2006;6:143.
10. Rumman KA, Sabra NA, Bakri F, Seita A, Bassili A. Prevalence of tuberculosis suspects and their healthcare-seeking behavior in urban and rural Jordan. Am J Trop Med Hyg. 2008;79(4):545–51. 11. Ghosh S, Sinhababu A, Taraphdar P,
Mukhopadhyay DK, Mahapatra BS, Biswas AB. A study on care seeking behavior of chest symptomatics in a slum of Bankura, West Bengal. Indian J Public Health. 2010;54(1):42–4.
12. EH, Dachew BA, Kassa Woreta H, Mekonnen Kelkay M, Ashenafie TD. Health Seeking Behaviour and Associated Factors among Pulmonary Tuberculosis Suspects in Lay Armachiho District, Northwest Ethiopia: A Community-Based Study. Tuberc Res Treat. 2016;2016:7892701.
13. JCDR - Care Seeking Behavior of the TB Patients who were Registered in an Urban Government Tuberculosis Control in Chennai, Tamilnadu, India.
Available from:
http://www.jcdr.net/article_abstract.asp?id=2312 14. dsa710.pdf. Available at:
http://applications.emro.who.int/dsaf/dsa710.pdf. Accessed on 10 March 2018.
15. Fochsen G, Deshpande K, Diwan V, Mishra A, Diwan VK, Thorson A. Health care seeking among individuals with cough and tuberculosis: a population-based study from rural India. Int J Tuberc Lung Dis Off J Int Union Tuberc Lung Dis. 2006;10(9):995–1000.
16. Storla DG, Yimer S, Bjune GA. A systematic review of delay in the diagnosis and treatment of tuberculosis. BMC Public Health. 2008 ;8:15. 17. Lock WA, Ahmad RA, Ruiter RAC, van der Werf
Afar Region, Ethiopia: a cross-sectional study. BMC Public Health. 2012;12:369.
19. Rajeswari R, Chandrasekaran V, Suhadev M, Sivasubramaniam S, Sudha G, Renu G. Factors associated with patient and health system delays in the diagnosis of tuberculosis in South India. Int J Tuberc Lung Dis Off J Int Union Tuberc Lung Dis. 2002;6(9):789–95.
20. Selvam JM, Wares F, Perumal M, Gopi PG, Sudha G, Chandrasekaran V, et al. Health-seeking behaviour of new smear-positive TB patients under a DOTS programme in Tamil Nadu, India, 2003. Int J Tuberc Lung Dis Off J Int Union Tuberc Lung Dis. 2007;11(2):161–7.
21. Odusanya OO, Babafemi JO. Patterns of delays amongst pulmonary tuberculosis patients in Lagos, Nigeria. BMC Public Health. 2004;4:18.
22. Tobgay KJ, Sarma PS, Thankappan KR. Predictors of treatment delays for tuberculosis in Sikkim. Natl Med J India. 2006;19(2):60–3.
23. SSMJ_5_4_TB_case_detection.pdf.Available from: http://www.southsudanmedicaljournal.com/assets/fil es/Journals/vol_5_iss_4_nov_12/SSMJ_5_4_TB_ca se_detection.pdf. Accessed on 10 March 2018.
24. Lawn SD, Afful B, Acheampong JW. Pulmonary tuberculosis: diagnostic delay in Ghanaian adults. Int J Tuberc Lung Dis Off J Int Union Tuberc Lung Dis. 1998;2(8):635–40.
25. Kiwuwa MS, Charles K, Harriet MK. Patient and health service delay in pulmonary tuberculosis patients attending a referral hospital: a cross-sectional study. BMC Public Health. 2005;5:122. 26. Godfrey-Faussett P, Kaunda H, Kamanga J, van
Beers S, van Cleeff M, Kumwenda-Phiri R, et al. Why do patients with a cough delay seeking care at Lusaka urban health centres? A health systems research approach. Int J Tuberc Lung Dis Off J Int Union Tuberc Lung Dis. 2002;6(9):796–805. 27. Ndeikoundam Ngangro N, Chauvin P, Halley des
Fontaines V. [Determinants of tuberculosis diagnosis delay in limited resources countries]. Rev Epidemiol Sante Publique. 2012;60(1):47–57.