Prediction of phosphorylation sites based on
the integration of multiple classifiers
R.Z. Han1,2, D. Wang1,2, Y.H. Chen1,2, L.K. Dong1 and Y.L. Fan1
1School of Information Science and Engineering, University of Jinan, Jinan, Shandong, China
2Shandong Provincial Key Laboratory of Network Based Intelligent Computing, Jinan, Shandong, China
Corresponding authors: D. Wang / Y.H. Chen E-mail: [email protected] / [email protected]
Genet. Mol. Res. 16 (1): gmr16019354 Received September 21, 2016
Accepted September 21, 2016 Published February 23, 2017
DOI http://dx.doi.org/10.4238/gmr16019354
Copyright © 2017 The Authors. This is an open-access article distributed under the terms of the Creative Commons Attribution ShareAlike (CC BY-SA) 4.0 License.
ABSTRACT. Phosphorylation is an important part of post-translational
of the FNT was the best. The three classifiers were then integrated in the form of a minority subordinate to the majority vote to obtain the results. The performance of the integrated model showed improvement in sensitivity (87.41%), specificity (87.60%), and accuracy (87.50%).
Key words: Flexible Neural Tree; Support vector machine;
Particle swarm optimization-artificial neural network; Phosphorylation sites prediction; Integration
INTRODUCTION
Post-translational modifications (PTMs) are essential for regulating the functions of proteins, and PTMs impact almost all cellular processes and pathways (Blom et al., 2004). PTM activities can coordinate and control the vast majority of proteins; consequently, there is not a one-to-one relationship between genes and proteins, leading to increased complexity in human life processes. Therefore, the process of protein annotation is highly important for gaining a clear understanding of human life (Qiu et al., 2014). Indeed, protein phosphorylation is generally involved in most of the signal transductions occurring in the human body (Lee et al., 2016).
Phosphorylation to amino acid side chains by a covalent bond connecting to a phosphate group usually occurs on serine (S), threonine (T), and tyrosine (Y) residues, which are known as phosphorylation sites. The process of phosphorylation regulates almost all life activities, including cell proliferation, differentiation and development, neural activity, muscle contraction, cancer development, and new tissues supersede the old ones. In particular, protein phosphorylation is the main signal involved in the cellular response to external stimuli, known as the transfer mode (Huang et al., 2003).
In 2004, researchers in South Korea (Kim et al., 2004) introduced the use of a support vector machine (SVM) model to predict kinase-specific phosphorylation sites. Subsequently, Li et al. (2005) used the k-nearest neighbor (k-NN) model to predict kinase-specific phosphorylation sites. Tang et al. (2007) used a genetic algorithm integrated neural network (GANN) to develop a non-specific phosphorylation sites prediction method, which showed a prediction accuracy of 81.1% (S), 76.7% (T), and 73.3% (Y). Wu et al. (2014) developed a new k-NN algorithm based on the phosphatase recognition site for phosphorylation site prediction.
In the present study, we expanded upon these previous results and methods, and added information on the physicochemical properties in the feature extraction. Therefore, the feature extraction for prediction has more biological significance, rather than simply considering the position of the amino acids when taking into account only the amino acid sequence information. Furthermore, we used a new neural network model, flexible neural tree (FNT), for the integration of multiple classifiers, which get higher prediction accuracy. We expect that the present method should be useful for accurately predicting the phosphorylation sites in amino acid sequences and provide credible support for the diagnosis and treatment of certain diseases.
MATERIAL AND METHODS
Concept
sequence is mainly influenced by the sequences adjacent to the site (Trost and Kusalik, 2011). Therefore, a sample usually consists of m amino acid residues behind the site and m amino acid residues in front of the site, so that each micro-amino acid sequence contains 2m + 1 amino acid residues. In previous studies, researchers have considered the sequences adjacent to the modified sites as positive samples, and those adjacent to non-modified sites as negative samples. In this study, the value of m was determined to be 11; therefore, each sequence covered 23 amino acid residues, including the modified and non-modified sites as well as the 11 amino acid residues before and after the site of interest.
Protein phosphorylation is particularly common in signal transduction (Blom et al., 2004). Therefore, for constructing the datasets, 32 proteins related to signal transduction (Wang et al., 2002) were extracted from a phosphorylation site database (www.phosphosite. org). These 32 proteins contained 596 amino acid residues that have been clearly identified as modification sites, including 305 S, 167 T, and 124 Y residues. At the same time, unidentified sites were extracted as negative samples from these 32 protein sequences for a total of 1945 residues, including 929 S, 634 T, and 382 Y residues. To ensure that the dataset was balanced for positive and negative sequences, 596 non-modified sites were extracted randomly as a negative sample dataset among the 1945 unidentified sites.
For prediction, all data sets could be regarded as common input vector classification models, rather than for the specific prediction of individual amino acid residues. That is to say, it could input features of three kinds of amino acid residues, such as S, T, and Y to the classification model at the same time. Then, the classification model can distinguish whether or not the amino acid residues are modified sites based on the prior extracted vector features.
Model
Encoding based on attribute grouping
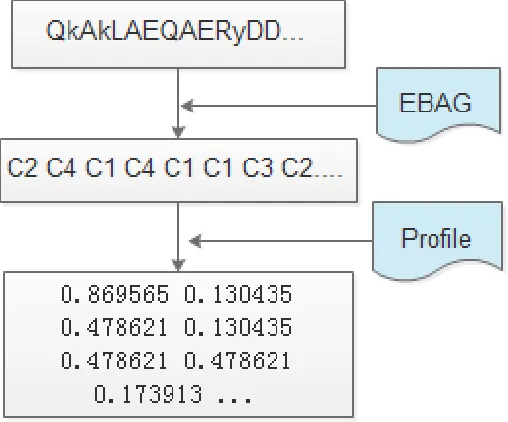
In this study, we applied an encoding scheme named encoding based on attribute grouping (EBAG) considering the hydrophobicity and charged character of the amino acid (Fan and Zhang, 2005; Huang et al., 2015). The EBAG divides amino acid residues (20 + 1) into four groups according to the physicochemical property of amino acid, and we divided gaps into the gaps group C5 = [X] as the fifth group (Zhang et al., 2006; Nanni and Lumini, 2009) . Given a protein sequence fragment P with 2L + 1 amino acid residues, and the above mentioned groups can be used to convert the protein sequence fragments into an encodable form, as shown in Table 1.
Table 1. Groups of amino acid residues.
Groups Amino acid residues Label
C1 A, F, G, I, L, M, P, V, W Hydrophobic group
C2 C, N, Q, S, T, Y Polar group
C3 D, E Acidic group
C4 H, K, R Basic group
C5 X Gaps group
Profile encoding
in each protein sequences to encode. And the formula for calculating the frequency of every amino acid (FA) is:
A A
F CL
=
(Equation 1)where CA is the number of occurrences of each amino acid residue and L is the total number of
amino acids in each sequence. And the value of A ranges from 1 to 20. In this way, a protein sequence can be put into a characteristic vector, with each amino acid residue in a certain order. Trace protein sequences are represented as PV according to the following formula:
1 2 3 20
, , ,
PV
F F F
F
=
…
(Equation 2)A collection of all protein sequences is the PV vector (Liu, 2011).
EBAG and profile encoding
Initially, we used EBAG data encoding. The protein sequence fragment P can be divided into five categories, and the frequencies of the five types in the same sequence fragment P can be used for secondary encoding. The recoded protein sequence fragment is obtained depending on the frequency of the five types, as shown in Figure 1.
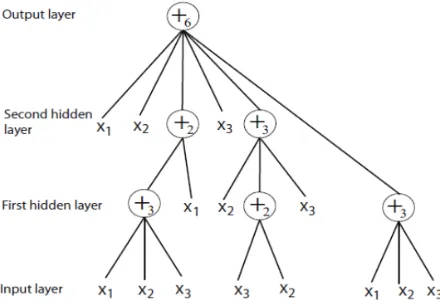
FNT
The FNT was put forward by Chen et al. (2005) as a special kind of artificial neural network (ANN) with flexible tree structures (Yang et al., 2013). Here, we employed FNT as one of three predictors. Flexible neuron instructors then use the function set F and terminal instruction set T to generate the FNT model and they were shown as below.
1
{ 2, 3
} {
n}
S F T
= ∪ = + + ⋅⋅⋅+
N
∪
x x
⋅⋅⋅
(Equation 3)where
+ =
i i
( 1,2
⋅⋅⋅
N
)
indicates the instructions on the non-leaf nodes and has i arguments; 1, ,
2 nx x
⋅⋅⋅
x
are the instructions on the leaf nodes with no arguments.The output of a non-leaf node was calculated using an FNT model, as shown in Figure 2.
Figure 2. Non-leaf nodes of a flexible neural tree with a terminal instruction set T = {x1, x2, …, xn}.
A typical FNT model is shown in Figure 3.
Model evaluation
In this paper, sensitivity (Sn), specificity (Sp), accuracy (Acc), and Matthew’s correlation coefficient (MCC) were applied to evaluate the overall performance of different prediction models, as shown below:
TP
Sn
TP FN
=
+
(Equation 4)where FP, FN, TP, and TN denote the number of false positives, false negatives, true positives, and true negatives, respectively. Sn and Sp represent the correct prediction ratios that the models distinguish positive and negative samples in total data sets.
RESULTS
In this study, the method was tested with sequence data of 32 proteins using 10-fold cross validation. Acc, Sn, Sp, and MCC were simultaneously used to assess the performance of different models.
Performance of the three classification models
First, the EBAG+Profile characteristics method was conducted to extract the features of the data set. Then, using a 10-fold cross validation method, the data sets was classified according to three kinds of model predictions separately, and the average of the ten experimental results was obtained as shown in Table 2.
TN
Sp
TN FP
=
+
(Equation 5)TN TP Acc
TN FP FN TP
+ =
+ + + (Equation 6)
( ) ( ) ( ) ( )
TP TN FP FN MCC
TN FP TN FN TP FP TP FN
× − ×
=
+ × + × + × + (Equation 7)
Table 2. Performance of SVM, PSO-ANNs, and FNT.
Models Features Performance
Acc Sn Sp MCC
SVM Profile 51.67% 54.90% 48.47% 0.03
PSO-ANNs 61.92% 56.67% 77.50% 0.32
FNT 58.47% 62.71% 54.23% 0.17
SVM EBAG+Profile 83.47% 84.21% 82.72% 0.671
PSO-ANNs 85.91% 86.40% 85.42% 0.719
FNT 86.16% 86.07% 86.25% 0.724
As shown in Table 2, three kinds of classification models were tested, which all use the same feature extraction method. Comparison of the performance of the three classification models showed that the prediction results of all three models were very poor without the addition of amino acid groups. For example, the highest Acc value of the three models was 61.92%, which is almost biologically meaningless. However, after adding the packet information, the prediction results were significantly improved. In predicting whether a site is modified, FNT showed certain advantages with respect to Acc and Sp compared with the other two models, SVM and PSO-ANNs. Specifically, the Acc of FNT was 2.69% higher than the Acc of the SVM. Furthermore, the MCC value for the FNT also showed a certain level of improvement compared to that of the other two models. The Sp of FNT was only slightly higher than that of the PSO-ANNs and was 3.53% higher than that of the SVM, indicating that the FNT has higher accuracy for finding true non-phosphorylation sites.
Integration of the three classification models
The three separate model prediction results were then taken as the basis to vote on whether or not a given site is modified, using the same site with the same test set. That is, a site was considered to be modified when at least two models among SVM, PSO-ANNs, and FNT predicted it as a modification site. By contrast, when only one model predicted a site to be modified, the site was not considered to be a modification site, and was classified as a non-modification site. The integrated data from the three models are shown in Table 3. We calculated the average Acc, Sn, Sp, and MCC values of the three classifiers to verify the effect of integration of the three classifiers, and the FNT was selected to show the best performance when predicting independently.
Table 3. Performance of three models’ integration compared with FNT and average of three kinds of models.
Models Performance (%)
Acc Sn Sp MCC
FNT 86.16 86.07 86.25 0.724
Average 85.18 85.56 84.80 0.705
SVM + ANNs + FNT 87.50 87.41 87.60 0.751
Numbers in bold are optimal values under the same index.
The integrated model was clearly better than the other two with respect to all four indices. When predicting with FNT alone, the performance of FNT was slightly lower than that of PSO-ANNs but higher than that of the SVM with respect to Sn. However, when the three classifiers were integrated, the indicators of the integrated model significantly improved. The prediction Acc was improved to 87.5% and the Sp increased to 87.6%. Thus, the advantage of the integrated model was clear when comparing the indices of the integrated model to those of each of the three classification models.
DISCUSSION
prediction of phosphorylated modification sites under certain circumstances. These results are based on the non-kinase specificity of amino acid sites, and do not take the kinase information of a site into account, which directly predicts the site in the sequence. This approach can help to simplify data preprocessing and improve the generalization of this prediction model. Moreover, under the premise of the continuous improvement of prediction accuracy, this approach can provide a more reliable basis for disease prevention and treatment.
Nevertheless, there are some limitations of this study. First, with respect to the original data set, 32 proteins related to signal transduction were selected instead of predicting and analyzing modification sites corresponding to a specific disease. Therefore, for future research, the data set can be structured according to known proteins associated with a specific disease, so that the assessment of accuracy of prediction would have more direct biological and medical significance. Second, from the aspect of feature extraction, in this study, we simply grouped the amino acids according to their physical and chemical properties. However, when that of amino acids were added to sequence information, the prediction accuracy was clearly improved. Therefore, future work would benefit from analyzing the mechanism of PTM to obtain more information that can be integrated into the feature extraction for further improving the prediction accuracy or ameliorating the algorithm models.
ACKNOWLEDGMENTS
Research was partially supported by the Program for Scientific Research Innovation team at the Colleges and Universities of Shandong Province 2012-2015, the Key Project of the Natural Science Foundation of Shandong Province (#ZR2011FZ001), the Natural Science Foundation of Shandong Province (#ZR2011FL022, #ZR2013FL002), the Youth Science and Technology Star Program of Jinan City (#201406003), and the Shandong Provincial Key Laboratory of Network Based Intelligent Computing. Research also supported by the National Natural Science Foundation of China (Grant #61302128) and by the Scientific Research Foundation of University of Jinan (#XKY1410, #XKY1411).
REFERENCES
Blom N, Sicheritz-Pontén T, Gupta R, Gammeltoft S, et al. (2004). Prediction of post-translational glycosylation and phosphorylation of proteins from the amino acid sequence. Proteomics 4: 1633-1649. http://dx.doi.org/10.1002/ pmic.200300771
Chen Y, Yang B, Dong J and Abraham A (2005). Time-series forecasting using flexible neural tree model. Inf. Sci. 174: 219-235. http://dx.doi.org/10.1016/j.ins.2004.10.005
Fan SC and Zhang XG (2005). Characterizing the microenvironment surrounding phosphorylated protein sites. Genomics
Proteomics Bioinformatics 3: 213-217. http://dx.doi.org/10.1016/S1672-0229(05)03029-9
Huang SY, Shi SP, Qiu JD and Liu MC (2015). Using support vector machines to identify protein phosphorylation sites in viruses. J. Mol. Graph. Model. 56: 84-90. http://dx.doi.org/10.1016/j.jmgm.2014.12.005
Huang ZY, Yu YL, Fang CY and Yang FY (2003). Progress of Identification of Phosphorylated Proteins with Mass Spec-trometry. Journal of Chinese Mass Spectrometry Society 24: 490-500.
Kim JH, Lee J, Oh B, Kimm K, et al. (2004). Prediction of phosphorylation sites using SVMs. Bioinformatics 20: 3179-3184. http://dx.doi.org/10.1093/bioinformatics/bth382
Lee A, Oh JG, Gorski PA, Hajjar RJ, et al. (2016). Post-translational Modifications in Heart Failure: Small Changes, Big Impact. Heart Lung Circ. 25: 319-324. http://dx.doi.org/10.1016/j.hlc.2015.11.008
Li A, Wang L, Shi Y, Wang M, et al. (2005). Phosphorylation site prediction with a modified k-nearest neighbor algorithm and BLOSUM62 matrix. Conf. Proc. IEEE Eng. Med. Biol. Soc. 6: 6075-6078.
Nanni L and Lumini A (2009). An ensemble of reduced alphabets with protein encoding based on grouped weight for predicting DNA-binding proteins. Amino Acids 36: 167-175. http://dx.doi.org/10.1007/s00726-008-0044-7
Qiu W, Zou G, Zha J and Huo L (2014). Protein post-translational modification research overview. J. JingDeZhen Univ. 29: 43-45.
Tang YR, Chen YZ, Canchaya CA and Zhang Z (2007). GANNPhos: a new phosphorylation site predictor based on a genetic algorithm integrated neural network. Protein Eng. Des. Sel. 20: 405-412. http://dx.doi.org/10.1093/protein/ gzm035
Trost B and Kusalik A (2011). Computational prediction of eukaryotic phosphorylation sites. Bioinformatics 27: 2927-2935. http://dx.doi.org/10.1093/bioinformatics/btr525
Wang JY, Zhu SG and Xu CF (2002). Biochemistry[M].-3.Peking: Higher Education Press.
Wu Z, Lu M and Li T (2014). Prediction of substrate sites for protein phosphatases 1B, SHP-1, and SHP-2 based on sequence features. Amino Acids 46: 1919-1928. http://dx.doi.org/10.1007/s00726-014-1739-6
Yang B, Chen Y and Jiang MY (2013). Reverse engineering of gene regulatory net-works using flexible neural tree models. Neurocomputing 99: 458-466. http://dx.doi.org/10.1016/j.neucom.2012.07.015
Zhang ZH, Wang ZH, Zhang ZR and Wang YX (2006). A novel method for apoptosis protein subcellular localization prediction combining encoding based on grouped weight and support vector machine. FEBS Lett. 580: 6169-6174.