An Improved Agglomerative Clustering Method
Omar Kettani
Scientific Institute, Physics of the Earth Laboratory Mohamed V- University
Rabat, Morocco
Faical Ramdani
Scientific Institute, Physics of the Earth Laboratory Mohamed V- University
Rabat, Morocco
ABSTRACT
Clustering is a common and useful exploratory task widely used in Data mining. Among the many existing clustering algorithms, the Agglomerative Clustering Method (ACM) introduced by the authors suffers from an obvious drawback: its sensitivity to data ordering. To overcome this issue, we propose in this paper to initialize the ACM by using the KKZ seed algorithm. The proposed approach (called KKZ_ACM) has a lower computational time complexity than the famous k-means algorithm. We evaluated its performance by applying on various benchmark datasets and compare with ACM, k-means++ and KKZ_ k-means. Our performance studies have demonstrated that the proposed approach is effective in producing consistent clustering results in term of average Silhouette index.
General Terms
Data mining, Algorithms
Keywords
Clustering, k-means, k-means++, KKZ
1.
INTRODUCTION
Cluster analysis is the most widely used technique in pattern recognition, artificial intelligence, machine learning and knowledge discovery. Clustering consists of grouping a given dataset into a predefined number of disjoint sets, called clusters, so that the elements in the same cluster are more similar to each other and more different from the elements in the other cluster. This optimization problem is known to be NP-hard, even when the clustering process deals with only two clusters [3]. Therefore, many heuristics and approximation algorithms have been proposed, in order to find near optimal clustering solution in reasonable computational time.
In the next section, some related work are briefly discussed. Then the proposed algorithm and its computational complexity are described in Section 3. Section 4 applies this clustering approach to some standard data sets and reports its performance. Finally, conclusion of the paper is summarized in Section 5.
2.
RELATED WORK
Given a set of n data points (objects) X = {x1 , . . . , xn } in Rd
and an integer k, the clustering problem consists to determine a set of k centroids C = {m1 , . . . , mk } in Rd , so as to
minimize the following Sum of Square Error (SSE) function:
k
SSE=Σ || x − mi || 2
i=1 x∈D
where || . || 2 denotes the Euclidean norm.
Since the problem of finding a globally optimal initial clustering has been shown to be NP-hard [4], a study on the initialization methods towards a suboptimal clustering solution is more realistic. Many initialization methods have been proposed aiming to optimize this phase, which could be classified as: (a) random methods [5][6]; (b) distance optimization methods, that aim to minimimize the SSE [2]; and (c) density estimation methods, that are based on the assumption that the input data follow a Gaussian mixture distribution [7]. More generally, the initialization techniques can be classified simply as random or deterministic.
The most prominent clustering algorithm k-means is a greedy algorithm which has two stages: Initialization, in which we set the seed set of centroids, and an iterative stage, called Lloyd’s algorithm [8]. Additionally, Lloyd’s algorithm has two steps: The assignment step, in which each object is assigned to its closest centroid, and the centroid’s update step. The time required for the assignment step is O(nkd), while the centroid’s update step and the computation of the error function is O(nd). The main advantage of k-means is its fast convergence to a local minimum.
The greedy k-means++ method [9] probabilistically selects log(K) centers in each round and then greedily selects the center that most reduces the SSE. It chooses the first center randomly and the i-th (i ∈ {2, 3, . . . , k}) center is chosen to be x′ ∈ X with a probability of
n
md(x′ )2
/
md(x j)2j=1
where md(x) denotes the minimum-distance from a point x to the previously selected centers.
Among the deterministic initialization methods, KKZ was proposed by [2] which consists to find the data points that are most far apart from each other, since those data points are more likely to belong to different clusters. The pseudo-code for KKZ is as follows:
1. Choose the point with the maximum L2-norm as the first centroid.
2. For j = 2, . . . , k, each centroid mj is set in the following
way: For any remaining data xi , its distance di to the existing
centroids is computed. di is calculated as the distance between
xi to its closest existing centroid. Then, the point with the
largest di is selected as mj. The computational complexity of
KKZ is O(nkd).
paper, we propose to initialize the ACM by using the KKZ seed algorithm aiming to overcome this issue.
3.
PROPOSED APPROACH
This section reminds the ACM [1] and then analyzes the computational time and space complexities of the proposed approach.
The main idea of the proposed KKZ_ACM method, is to choose k initial Ki points of the KKZ initialization procedure.
Then, X is scanned once, the distance between each non assigned point Xi and the nearest centroid mj is compared with
the minimum of the inter-cluster distances stored in a kxk D matrix. If it is lower, then Xi is assigned to cluster Cj, else the
two clusters with closest centroids are merged together into one cluster and a singleton cluster is created with centroid Xi,
seeking to minimize the SSE criterion. Then centroids and D matrix are updated. This process is repeated until all points in X are assigned. More details are presented in the following pseudo-code:
3.1
Pseudo-code of the Proposed Method
Input: A data set X whose cardinality is n and an integer k Output: k cluster Cj
1 Run KKZ 2 for i=1:k do
Ci
mii
end for
3 D(d(mi,mj))1 ≤ i ≠ j ≤ k
muMin(D) and (a,b)Arg(Min(D))
i,j i,j i1
4while i≤n do
diMin(d(Xi,mj))
j
cArg(Min d(Xi,mj))
j if di<mu then
Cc CcXi
mc(Ccmc+Xi)/(Cc+1)
D(c,:)d(mc,mj)) 1 ≤ j ≤ k
D(:,c)D(c,:)' else
Ca CaCb
ma(Cama+Cbmb)/(Ca+Cb)
CbXi
mbXi
D(a,:)d(ma,mj)) 1 ≤ j ≤ k
D(:,a)D(a,:)'
D(b,:)d(mb,mj)) 1 ≤ j ≤ k
D(:,b)D(b,:)' end if
ii+1
muMin(D) and (a,b)Arg(Min(D)) h,j h,j
end while.
3.2
Complexity
As shown in pseudo-code, at step 3, O(dk2) operations are required to compute D matrix, and O(dk2) space are required to store D matrix.
At step 4, the while loop is repeated n-k times, and updating D matrix, require only O(dk) operations at each iteration. Since step 1 required O(nkd) operations , the overall running time complexity of ACM is O(nkd) which corresponds to the complexity of one iteration of the k-means algorithm.
4.
EXPERIMENTAL RESULTS
Algorithm validation is conducted using different data sets from the UCI Machine Learning Repository [10]. We evaluated its performance by applying on several benchmark datasets and compare with ACM, means++ and KKZ_ k-means.
Silhouette index[7] which measures the cohesion based on the distance between all the points in the same cluster and the separation based on the nearest neighbor distance, was used in these experiments in order to evaluate clustering accuracy. ( bigger average silhouette value indicates a higher clustering accuracy ). Silhouette index is based on distances between observations in the same cluster and in different clusters [10]. Given observation i , let ai be the average distance from point
the average distance from point i to all points in any other cluster j . Finally, let bi denotes the minimum of these average
i i i , bi
The average silhouette width can be find by averaging silh(i ) over all observations:
1 n
The silhouette width silh(i ) ranges from -1 to 1. If an observation has a value close to 1, then the data point is closer to its own cluster than a neighboring one. If it has a silhouette width close to -1, then it is not very well clustered. A silhouette width close to zero indicates that the observation could just belong to current cluster or one that is near to it. Kaufman and Rousseeuw [7] use the average silhouette width to estimate the number of clusters in a data set by using the partition with two or more clusters that yields the largest average silhouette width.
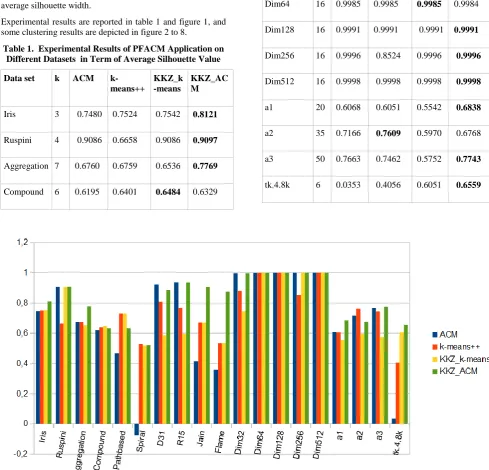
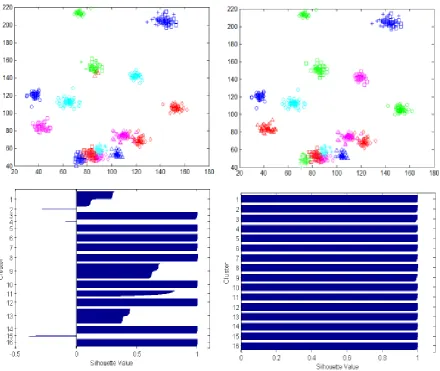
Experimental results are reported in table 1 and figure 1, and some clustering results are depicted in figure 2 to 8.
Table 1. Experimental Results of PFACM Application on Different Datasets in Term of Average Silhouette Value
Data set k ACM
k-means++
KKZ_k -means
KKZ_AC M
Iris 3 0.7480 0.7524 0.7542 0.8121
Ruspini 4 0.9086 0.6658 0.9086 0.9097
Aggregation 7 0.6760 0.6759 0.6536 0.7769
Compound 6 0.6195 0.6401 0.6484 0.6329
Pathbased 3 0.4666 0.7310 0.7316 0.6332
Spiral 3 -0.0763 0.5278 0.5206 0.5234
D31 31 0.9218 0.8087 0.5881 0.8872
R15 15 0.9361 0.7669 0.5966 0.9356
Jain 2 0.4149 0.6722 0.6719 0.9078
Flame 2 0.3593 0.5336 0.5347 0.8760
Dim32 16 0.9962 0.8813 0.7472 0.9961
Dim64 16 0.9985 0.9985 0.9985 0.9984
Dim128 16 0.9991 0.9991 0.9991 0.9991
Dim256 16 0.9996 0.8524 0.9996 0.9996
Dim512 16 0.9998 0.9998 0.9998 0.9998
a1 20 0.6068 0.6051 0.5542 0.6838
a2 35 0.7166 0.7609 0.5970 0.6768
a3 50 0.7663 0.7462 0.5752 0.7743
tk.4.8k 6 0.0353 0.4056 0.6051 0.6559
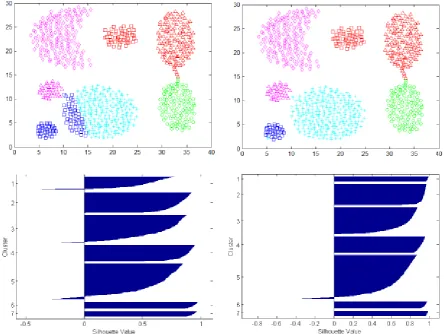
19 Fig 2: Clustering results of Aggregation dataset using KKZ_k-means (on left) and KKZ_ACM (on right)
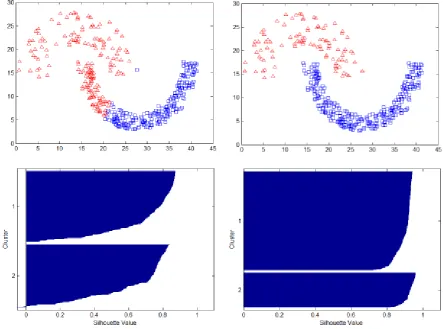
20 Fig 4: Clustering results of Jain dataset using KKZ_k-means (on left) and KKZ_ACM (on right)
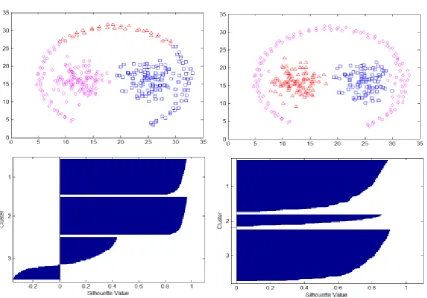
21 Fig 6: Clustering results of Unbalance dataset using KKZ_k-means (on left) and KKZ_ACM (on right)
22 Fig 8: Clustering results of Dim32 dataset using KKZ_k-means (on left) and KKZ_ACM (on right)
5.
CONCLUSION
In this paper, an improvement of the Agglomerative Clustering Method was suggested. It consists to use the KKZ procedure as its initialization phase, aiming to overcome its sensitivity to data ordering. The proposed approach has a lower computational time complexity than the famous k-means algorithm, and our experimental study have demonstrated that it is effective in producing consistent clustering results.
In future work, we will use this algorithm after removing outliers from the input dataset as a preprocessing step, in order to improve its clustering performance. Another possible enhancement will consist to choose a more appropriate similarity measure instead of Euclidian distance aiming to produce more accurate clustering results.
6.
ACKNOWLEDGMENTS
Our thanks to the anonymous reviewers for their helpful comments
7.
REFERENCES
[1] Kettani, O. ; Ramdani, F. & Tadili, B. An Agglomerative Clustering Method for Large Data Sets.International
Journal of Computer Applications 92(14):1-7, April 2014. DOI:10.5120/16074-4952
[2] I. Katsavounidis, C.-C. J. Kuo, Z. Zhang, A New Initialization Technique for Generalized Lloyd Iteration, IEEE Signal Processing Letters 1 (10) (1994) 144–146. [3] Aloise, D.; Deshpande, A.; Hansen, P.; Popat, P. (2009).
"NP-hardness of Euclidean sum-of-squares clustering". Machine Learning 75: 245–249. doi:10.1007/s10994-009-5103-0.
[4] Garey M.R., Johnson D.S. “Computers and Intractability: A Guide to the Theory of NP-Completeness”W. H. Freeman & Co. New York, NY, USA ©1979
[5] E. Forgy, Cluster Analysis of Multivariate Data: Efficiency vs. Interpretability of Classification, Biometrics 21 (1965) 768.
[7] L. Kaufman and P. J. Rousseeuw. Finding groups in Data: “an Introduction to Cluster Analysis”. Wiley, 1990. [8] Lloyd., S. P. (1982). "Least squares quantization in PCM". IEEE Transactions on Information Theory 28 (2): 129–137. doi:10.1109/TIT.1982.1056489.
[9] D. Arthur, S. Vassilvitskii, k-means++: The Advantages of Careful Seeding, in: Proc. of the 18th Annual
ACM-SIAM Symposium on Discrete Algorithms, 2007, pp. 1027–1035.
[10]Asuncion, A. and Newman, D.J. (2007). UCI Machine LearningRepository