Improving The Air Tightness Of An Early 20th
Century House
Rosanne Walker, Sara Pavía
Dept of Civil Engineering Trinity College Dublin 2, Ireland [email protected] [email protected]
Abstract—Reducing unnecessary heat loss
caused by air infiltration and exfiltration (draughts) can decrease heating energy requirements in houses. Traditional buildings (built pre 1944) have the potential for substantial improvement as they were constructed before the introduction of energy building regulations. However, energy saving interventions should not undermine their special architectural and historic character.
This paper investigates several draught reduction measures suitable for a traditional house. The success of the interventions was investigated by measuring air permeability rates (air blower), thermal imaging and monitoring room temperature.
In a typical Edwardian room, the suspended timber floor was the largest contributor to air leakage. Floor underlay and draught stripping between the boards reduced air flow by 50% and 62.5% respectively and also increased the floor surface temperature. The chimney contributed to 13.8% air leakage and a reduction of 5.4% and 8% was achieved using a chimney balloon and dampner respectively. Thermal blinds reduced heat transfer through the sash window but only reduced air leakage by 4.5%. Retrofit measures to the front door and attic hatch cover had little effect at improving air tightness.
Although limited to one building, this study measures the potential success of a range of draught reduction measures suitable for historic buildings.
Keywords— draught reduction; historic
building; air leakage; thermal images
I. INTRODUCTION
Climate change is widely considered as the most serious environmental challenge of this century. The Intergovernmental Panel on Climate Change (2014) states that limiting climate change would require substantial and sustained reductions in greenhouse gas emissions [1]. Globally many governments are taking this threat seriously and committing to reducing their emissions.
Building operation energy is a large contributor towards such emissions. In Ireland, the residential sector is the second largest consumer of energy and
accounted for 27% of all primary energy use in 2011 [2]. It is responsible for 10.5 million tonnes of energy related CO2 emissions in the same year [2]. Heating accounts for approximately 67% of all fuel use [2]. In light of the large heating energy consumption in Ireland, it is important to eliminate unnecessary heat loss. 44% of the Irish building stock was built prior to the introduction of energy specific building requirements [2]. There is consequently large scope to improve their thermal performance and thermal retrofitting is becoming increasing popular. At least 12% of the housing stock undertook energy efficiency upgrades between 2006 and 2011 and it is estimated that grant supported schemes saved over 900 GWh in 2011 alone [2]. Ahern et al. (2013) calculated that the greatest energy saving can be achieved by concentrating on the pre-building regulations housing stock (pre 1979) [3].
The DoEHLG (2011) estimates that easily avoidable air leakage is responsible for 5-10% of heat loss [4]. Additionally building air tightness becomes proportionally more important as thermal insulation standards improve [5] and there is significant scope for improving it [3]. However adequate levels of ventilation should be maintained to ensure the wellbeing of the building and its occupants.
Draughts are air currents caused by air movement into and out of a building. Warm internal air is displaced by cool external air lowering room temperatures. This air leakage is caused by air pressure differences between the interior and exterior of the building. Air pressure difference is attributed to wind, the stack effect or ventilation systems. Many factors are responsible for draughts in buildings and consequently, it is not easy to categorise air leakage in building according to building typology, composition, age or condition [6].
Vol. 2 Issue 3, March - 2016 There are over a quarter of a million houses in
Ireland built before 1944 (approximately 16% of building stock – [7]) that can largely be considered to be of traditional construction. These buildings are typically of architectural and historic interest and it is essential that any thermal upgrading does not undermine their special character. The Irish building regulations relating to conservation of fuel and energy for buildings (Technical Guidance Document - Part L 2011) acknowledge that minimising energy requirements for the operation of existing dwellings can affect the character of buildings of architectural or historic interest and that proposed works should be carefully assessed [8]. In relation to air tightness, the standard identifies a performance level of 7 m3/hm2 as an upper limit for air permeability for new builds although there is currently no minimum airtightness standard when upgrading existing dwellings.
Air tightness has a large effect on heat energy consumption; Kalamees (2007 referring to Kurnitski et al. 2005) measured that as the air change rate varied between 1-10 h-1, the energy consumption increased from 4-21% for a detached house in a cold climate [9,10]. Furthermore, air leakage can cause moisture transfer through the building envelope and increased moisture levels in the building fabric. Consequently, this can undermine the thermal resistance of insulation and cause material deterioration. In addition, air tightness is often linked to thermal comfort. Occupant discomfort relating to fluctuating room temperature and cold floors is higher in houses with an air change rate (n50) over 6 h-1 [9 referring to 10]. In addition, Toftum (2004) found that air movement can be perceived as unacceptable at temperatures below 22–23 °C for occupants with sedentary activity levels [11]. However, increasing air temperatures, thermal sensation and activity level improves occupant perception. The direction of air flow is also important as it influences discomfort, with airflow from below perceived as the most uncomfortable at 20 and 23 °C [12].
There is a widespread preconception that old buildings are draughty. Ahern et al. (2013) estimated the air permeability of detached, Irish buildings, pre 1919 and dating between 1919 and 1940 at c.11.5 m3/hm2, lower than buildings constructed between 1940 and 1990 [3]. Houses were difficult to heat in previous centuries and consequently their design often took advantage of their local environment to maximise thermal comfort. Traditionally houses would consider their orientation- gable facing the direction of the prevailing wind; topography- houses sited on leeward side of hills; and setting- belts of trees often planted to screen the house in order to minimise heat loss and draughts.
Previous research has not been able to link building age to air-tightness. A US survey by Chan et al. (2005) showed that air-tightness of newer dwellings (constructed post 2000) has increased compared with older dwellings (categorised as pre 1960 and the following four decades) [13]. Conversely Sinnott and Dyer (2012) studied a sample of 28 houses in Ireland
and found that the older buildings were more air-tight than the new dwellings [14]. They reported 1944-1975 dwellings, 1980’s dwellings and 2008 dwellings as having a mean air permeability of 7.5 m3/hm2, 9.4 m3/hm2 and 10.4 m3/hm2 respectively. Considering buildings predating 1940, Stephens (1998) showed that the oldest buildings (pre 1919) were more airtight than mid century buildings for the UK building stock [15].
There are no fixed proportions of air leakage that can be attributed to different building components such as walls, floors or roofs on account of the variety of building types, ages, building components and finishes that produce varying results in different buildings. Stephens (1998) investigated the average component leakage rates in 35 buildings and observed average leakages of 16% for windows and doors, 9% for permanent ventilators, 2% for loft hatches, 2% for window and door surrounds and 71% from the remainder [15]. Alfano et al. (2012) attributed air leakage to chimney flues (12%), windows and doors (15%), ventilation systems (18%), fans (5%), ceilings (18%) and joints between walls, floor and ceiling (35%) [6]. Other studies found measured air leakage and determined losses of 6-22% through doors and windows, 18- 50% through walls, 3-30% through ceilings, 3-28% through heating systems and 0-30% through fireplaces [16 referring to 17,18].
Ahern et al. (2013) observed that airtightness is a low cost retrofit measure that can have a high impact [3]. However, there is a paucity of information in relation to the effectiveness of draught reduction measures at minimising draughts. Manufacturers quote extravagant statements on their advertising and packaging but it is difficult to substantiate such claims without published test results. Furthermore, the success of draught reduction measures is highly subjective depending on the building type, condition of the building elements and installation of the draught reduction measures.
2.5-3 times improvement in airtightness following building works including: new windows and doors with draught proofing, sealing of suspended timber ground floors and repair to plaster defects around window frames in a scheme of 1930-1950s houses in the UK [21]. Hong et al. (2004) using a model methodology indicates that cavity wall insulation, loft insulation and draught stripping reduces infiltration rates by 24% and the reduction increases to 37% and 47% if the suspended floor and chimney are sealed [22]. Hall et al. (2013), also using a modelling methodology to investigate retrofit improvements in a replica of 1930’s-1960’s semi-detached houses in the UK, observed that enhanced draught-proofing gave a small reduction in air change hours (ACH) from 0.68-0.47; sealing around service penetration, closing vents and insulating the void beneath the suspended floor resulted in a further reduction to 0.41ACH and sealing the suspended timber floor to 0.25ACH [23].
II. MATERIALS AND METHODS
A. Description of case study
Testing was undertaken on an Edwardian terrace house built c.1910 located in Dublin, Ireland. The floor plans as shown in fig 1 and are typical of the typology. The walls of the house are constructed of solid red bricks with internal lime plaster in the traditional manner. Draught reduction measures were investigated in 3 rooms. Room 1- sitting room, room 2 – hall and room 3- landing.
Fig. 1.Photograph of house and floor plan. Front elevation is north facing.
Room 1 – The sitting room is located to the front of the house (north elevation). It has a plan floor area of 16 m2 and a ceiling height of 2.9 m. It has suspended timber floors, plastered walls with no insulation, a fireplace with open flue and original sash windows upgraded with draught stripping. The main sources of air leakage places to the exterior are through the suspended timber floor, fireplace with open flue, sash windows and external front wall.
Room 2- The hall provides access to the two reception rooms and stairs. It has a plan floor area of 9.3 m2 (2.9 m width and 1.1 m length) and ceiling height of 2.9 m and it is open to the stairs and the landing. It has suspended timber floors, plastered walls with no insulation, original timber door (with glazed upper panels) and a large rectangular overlight. The main source of air leakage places to the exterior is
through the suspended timber floor, front door and overlight.
Room 3 – The (first floor) landing is an open area having open access to the stairs, hall and attic and to the doors to four rooms with a combined area of approximately 31 m2 and average ceiling height of 2.5 m. It has carpeted timber floors and plastered walls with no insulation. The main source of air leakage to the exterior is through the ceiling (insulated in attic with 250mm of mineral wool) and attic hatch.
B. Draught reduction measures
A number of draught reduction measures were investigated as listed in table 1. The retrofit measures were measured individually in room 1 and in combination as shown in the table for room 2.
TABLE I. DETAILS OF DRAUGHT REDUCTION MEASURES
Room Product Description Opening and size
Room 1: sitting room Sealing
the chimney
Chimney balloon
an inflatable balloon inserted into the chimney
flue that blocks the flue.
Size of flue= between 0.09 m2 and 0.18 m2 (not
measured)
Chimney dampner
a steel plate that closes across the chimney opening sealing the chimney flue closed. The plate can be opened when
a fire is lit (Fire Genie).
Size of flue (as above)
Coverin g the suspend
ed timber
floor
Carpet underlay
10mm polyurethane foam underlay
Floor area = 16 m2 . (length of openings * approx width of opening) ,
3% of floor area
Rug polypropylene rug covering 25% of the floor
Rug area =3.68 m2.
Draught stripping
Foam tubes inserted between the floor boards
Spacing between boards (as above) Window Blinds Foil-lined cellular blinds Size of windows =5.3 m2.
Size of opening around window= 0.349 m2. (length of opening around window
* approx width) Room 2 :Hall
Door Door curtain 70% Polyester 30% cotton thermal lining fabric
Size of door = 1.89 m2 Size of overlight =0.6 m2 L-K-C Letter flap,
keyhole cover and draught
cushion
Long fabric cushion along door threshold
Letter opening = 0.006 m2 Key hole opening =
0.000125 m2 Threshold= 0.027 m2 (length *approx width)
DLF-K-C
As above with draught excluding letterbox cover
Letter box flap designed to ensure the letter box opening remains closed
As above
DS-
DLF-K-C
As above with door draught stripping and threshold brush strip
E-shaped EPDM rubber draught strip applied to door surround and polypropylene bristle brush
strip to threshold
As above
Room 3: Landing Attic hatch
Foil coated tent that sits over attic hatch.
Size of hatch =0.6 m2 Size of opening around
hatch (length *approx width) =0.034m
C. Thermal images
Vol. 2 Issue 3, March - 2016 without draught reduction measures) were taken within
a small time frame to reduce the impact of external factors influencing the image. The temperature scale was fixed for comparable images (with and without draught reduction measures) so that they could be readily compared.
Thermal imaging is qualitative and allows an approximation of surface temperatures of an object. The image depicts infrared radiation not the true temperature of the pictured object. The emmisivity coefficient (ε) was fixed at 0.93, to accommodate the widest range of building materials. Differences in emissivity of materials can influence the colours of the thermal images. For this reason, the emissivity of materials in the images was kept as close as possible. The ironmongery (knocker, letterbox and keyhole) and door have varying emmisivity therefore the ironmongery was covered in masking tape so that emmisivity of the ironmongery was closer to that of the painted timber door as shown in Fig 2. The timber floor and underlay also have varying emmisivity and the underlay was therefore placed beneath the floor surface so that only the floor surface is captured in the thermal image.
Fig. 2. Brass door knocker and thermal image of knocker uncovered (centre) and covered with masking tape (rhs) with smaller emmisivity difference between knocker and door
TABLE II. INTERNAL AND EXTERNAL TEMPERATURE FOR THERMAL IMAGING
Thermal Images
Internal temperature (°C)
External temperature (°C)
Thermal Images
Room 1: sitting room
15-16 1.5 Room 1: sitting room
Room 2: hall 15-16 1.5 Room 2: hall
Room 3: landing
17.5-18 4.5-5 Room 3: landing
D. Air permeability
Airtightness testing (air permeability) was undertaken using the fan pressurization method in accordance with EN13829:2001 [24]. It provides for the determination of air leakage reduction as a result of retrofit measures applied to a building. The principle of the test is that a fan is installed in the room/building envelope (fig 3) to pressurize/depressurise the space. Air is blown through the fan into the space to create a static pressure resulting in a differential pressure between inside and outside the room. The quantity of air flow through the fan to maintain this pressure is related to the air permeability across the room envelope (walls, ceilings and floor) i.e. at each air pressure, the rate of air flow through the fan is equal to
the rate of air flow through the building envelope. When the room is depressurised, air flows into the room through breaches in the envelope such as cracks and gaps, and conversely when the room is pressurised.
The relationship between pressure and air flow rate is set out in equation 1.
(1)
VL = Air leakage rate (m3/hr) CL = Air leakage coefficient
dP = Induced pressure difference between interior and exterior (Pa)
n= Air flow exponent (function of the shape of the openings typically ranging between 0.5 to 1 for turbulent and laminar flow respectively)
The results are expressed as the air permeability rate (q50) @ 50Pa as set out in equation 2.
(2)
Q50 =Air permeability @ 50Pa V50 = Mean air leakage rate @ 50Pa
AE = Envelope area (internal and external walls) A Retrotec 2000 fan and DM2 Mark II gauge micromanometer were used to carry out the testing. Data was manually logged and analysed using Fantestic software. A multipoint test (pressurisation and depressurisation) was undertaken, the pressure inside the room was increased to 70Pa and reduced gradually at c.10Pa intervals by altering the fan speed. The indoor air temperature varied between 12.1-14.8 °C and the external temperature 2.7-7.7 °C. The wind speed was >1 m/s and barometric pressure varied between 100.9-101.6kPa. The fan was installed in the internal door opening for room 1 (sitting room), in a frame at the bottom of the stairs for room 2 (hall) and the front door for room 3 (landing)
Fig. 3. Image of air blower fan inserted in internal door opening (room 1) and in frame at bottom of stairs (room 2).
It was initially intended to measure each of the interventions individually as for room1: sitting room and room 3: landing. However, as testing progressed in room 2: hall, it was evident that a single intervention would not yield results that significantly differed from another. Therefore, the interventions were combined, in an attempt to measure greater differences between the effect of using no retrofit measures and a combination of retrofit measures.
In order to give an estimate of the air leakage under typical environmental conditions it has been empirically determined to be equivalent to the air flow rate @50 Pa divided by 20 [25].
TABLE III. AIR BLOWER TEST INFORMATION
Room Envelope Area (m2)
Room volume(m3)
Position of air blower fan
Notes
Room 1: sitting room
79 46.4 Internal door
Room 2: hall 28.7 9.3 Front door
Screen inserted in hall to close hall from stairs and landing
Room 3: landing
160 approx 76.8 approx
Front door
Internal doors closed
E. Monitoring temperature
The purpose of monitoring the temperature was to determine the success of the different draught interventions by comparing changes in the room temperature during a heating cycle with and without each draught reduction measure.
The external and internal room temperatures were logged at half hour intervals using a Lascar EL-USB 2+ temperature and a humidity logger. Logging was undertaken for each room on consecutive nights between 22.00 and 2.30. The heating was turned on each night at 23.00 for 1 hour. The heating included two radiators (total heat output 3.5kW). The external temperature and the initial room temperature varied between nights and this information is included in the figures and tables below.
III. RESULTS
A. Room 1: sitting room
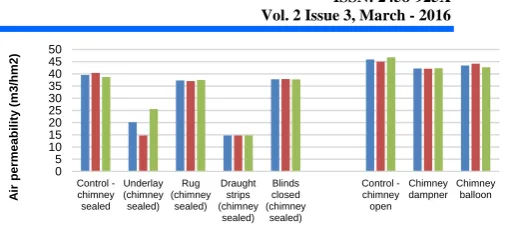
The air permeability and room temperature results for room 1 are shown in figs 4 and 5 and table 4. The air permeability of the room (with chimney sealed) of 39.55 m3/hm2 is very high compared to typical dwellings. The air flow exponent (n) of the air blower tests ranged between 0.53 and 0.57 with an average of 0.55 (excluding underlay test, n=0.73). This is a low figure that indicates a turbulent flow regime through large openings and is suggestive of a leaky building.
Fig. 4. Air permeability (m3/hrm2) of room 1 (originally) and room 1 following various draught interventions. Description of draught reduction measures in Table 1. The chimney was sealed (left bar of graph) with plastic sheeting taped to the fireplace to stop all draughts through the flue.
Fig. 5. Internal and external temperature logging for room 1 following various draught interventions. Control – no intervention and chimney open. Description of draught reduction measures in Table 1.
TABLE IV. NUMBERICAL DATA FOR INFORMATION SHOWN IN FIGURE 4 AND 5
Intervention Air blower Monitoring temperature Average air
permeability m3/hm2 @50Pa Room temperature prior to heating Max room temperature during heating cycle Outside temperature
Control - no intervention
45.89 15.5 18 9.5
Chimney sealed
39.55 n/a n/a n/a
Chimney dampner
42.21 15.5 18.5 9.5
Chimney balloon
43.42 n/a n/a n/a
Underlay 20.19 15 18.5 7
Draught stripping
14.75 13 17.5 9.5
Rug 37.28 n/a n/a n/a
Blinds 37.78 17 20 6.5
Sealing the chimney
The air blower results comparing the sealed (with plastic sheeting) and unsealed chimney indicate that the chimney is responsible for air permeability of 6.3 m3/hrm2 @50Pa (45.9-39.6 m3/hrm2) which accounts for 13.8% of the air flow from the room. The air flow
0 5 10 15 20 25 30 35 40 45 50 Control -chimney sealed Underlay (chimney sealed) Rug (chimney sealed) Draught strips (chimney sealed) Blinds closed (chimney sealed) Control -chimney open Chimney dampner Chimney balloon A ir pe rme a bili ty (m3 /hm2 )
Average Pressurise Depressurise
4 6 8 10 12 14 16 18 6 8 10 12 14 16 18 20 22
22 23 24 1 2
Ex tern al tempera tu re oC In tern al t empera tu re oC Time
Control blinds closed
chimney dampner closed underlay
draught stripping Control (outside)
blinds closed (outside) Chimney dampner closed (outside)
Vol. 2 Issue 3, March - 2016 rate through the chimney is 637 m3/h @50Pa which is
larger than the 400 m3/h and 432 m3/h values measured by Stephens (1998) and referring to Basset (1986) respectively [15, 26]. This is likely on account of this being an old property with a large chimney flue.
Neither the chimney balloon nor the chimney damper are completely effective at eliminating air flow through the chimney as the reduction in air permeability for the chimney balloon and chimney dampner compared to the open chimney are 2.5 and 3.7 m3/hm2 respectively which account for 5.4% and 8% of the air flow from the room. However, it is inadvisable to fully seal a chimney as it can result in condensation and damp in the chimney flue.
Thermal imaging and room temperature monitoring was only undertaken on the chimney dampner which proved most successful at reducing draughts according to the air blower testing. The room temperature monitoring showed that closing the chimney dampner during a heating cycle allowed the room to increase in temperature by 0.5°C. The thermal images (fig 6.) showed no difference in the temperature surrounding the fireplace whether the dampner is open or closed. This suggests that the cooling effect can be attributed to warm air escaping by the chimney and being replaced by cool air drawn in through other openings in the room such as the windows and floor rather than to a localised colder area near the fireplace.
Fig. 6. Fireplace and thermal image of the fireplace with the chimney dampner open (centre) and closed (right) showing no difference in temperature in the localised area surrounding the fireplace.
Covering the suspended timber floor
The suspended timber floor contributes significantly to the thermal performance of the room. The thermal underlay results in a 0.5 °C temperature increase during the heating cycle when compared to no intervention, despite the colder night (average 7 °C vs 9.5 °C). Draught stripping results in a 2 °C greater increase in room temperature during the heating cycle compared to no intervention (on nights of similar outside temperature). Considering the air blower results, it is clear that both thermal underlay and draught stripping dramatically reduce air leakage through the floor by 19.4 m3/hrm2 (39.56-20.19 m3/hrm2) and 24.8 m3/hrm2 (39.56-14.75 m3/hrm2) respectively @50Pa. This is equivalent to a 50% and 62.7% improvement in air leakage from the room. The underlay is less effective than the draught strips at reducing draughts and this suggests that it is somewhat air permeable. This is confirmed by the air flow exponent (n) of the air blower tests which typically
ranged between 0.53 and 0.57 for the interventions in Room 1 with the exception of the underlay which is 0.73. This indicates a transition from a prevalently turbulent flow through large gaps towards a more laminar flow through smaller openings in the underlay. A small rug (covering 25% of the floor area) was found to have a modest effect of 5.8% improvement in the reduction of air leakage from the room.
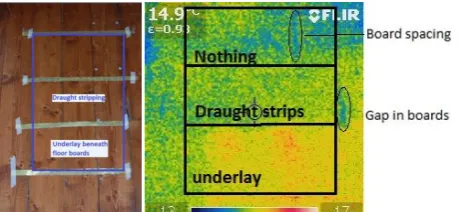
The thermal image in figure 7 shows a section of timber floor subdivided into three sections using metallic tape. The floor boards remain unchanged in the upper section of the photograph, draught strips are inserted between the boards in the middle section and underlay positioned beneath the floor in the lower section as marked on figure 7. The underlay has a different emmisivity coefficient than the floor boards and therefore thermal images could not accurately compare the performance of the two materials. However, by placing the underlay beneath the floor boards, the image only captures the floor surface and therefore a temperature comparison can be made between the floor with and without the underlay. The unchanged floor boards show blue areas indicating cold air coming from beneath the floor through the gap between the floor boards. It is likely that this cold air escaping from between the boards is slightly cooling the surface of the boards resulting in their lower temperature compared to the boards with draught stripping (slightly warmer - less blue sections). The thermal images show that the section of floor boards with the underlay beneath is warmer (yellow-red, approximately 15-16°C) than the section of floorboards without it (blue-green approximately 13.5-14°C) indicating that the underlay is reducing the heat transfer through the floor.
Considering both the air blower results and thermal images, it is evident that the draught strips largely reduce heat loss through minimising air leakage between the boards and slightly increases the surface temperature of the floor. The underlay both reduces the thermal conductivity of the floor and also reduces air movement between the boards.
Fig. 7. Left: Photograph of section of floor tested
subdivided into three sections: top – unchanged; middle –
draught stripping between floor boards and lower section –
underlay beneath floor boards. Right: thermal image of the floor section showing the varying thermal performance.
Thermal Blinds
blinds were tested compared to the night having no intervention (6.5 °C compared to 9.5 °C), the room achieves a 0.5 °C higher temperature during the heating cycle. Only a mediocre proportion of this is attributed to draught reduction 1.77 m3/hrm2 (39.56-37.78 m3/hrm2) @50Pa, a reduction of only 4.5% of the total air flow rate from the room.
More significantly, the blind reduces heat transfer through the window as shown in figure 8. Thermal images of the sash window were taken from the exterior with the blind covering the top sash. The thermal image shows an approximate surface glass temperature of 1 °C and 6 °C for the upper sash and lower sash respectively. These temperatures show a temperature differential rather than actual temperatures as glass is a poor emitter of infrared energy and measured temperature are likely below actual temperatures. The upper sash is cooler as the blind prevents warm air from warming the glass and leading to heat loss. This image clearly indicates the positive effect of the blinds on reducing heat transfer through the window. This agrees with Baker (2008) who measured a reduction in heat loss through the window of 36% in a single glazed sash with and without a thermal honeycomb blind [19].
Fig. 8. Sash window and thermal image of exterior of window with reduced heat loss through the upper sash
B. Room 2: hall
The air permeability and room temperature results for room 2 are shown in figures 9 and 10 and table 5. External doors are a significant source of air leakage [21]. In the air blower tests, it was evidenced that the pressurisation air permeability was lower than the depressurisation air permeability. Stephens (1998) observed that differences in pressurisation and depressurisation tests can vary by up to 20% as aerodynamic effects differ depending on the direction of air flow [15]. In this instance and considering the similarity of the pressurisation results (varying by only 5% from the average) and depressurisation results (varying only 4% from the average), it is likely that door components are sealing tightly when the interior is pressurised (reducing air permeability) but releasing when the pressure is reversed.
Fig. 9. Air permeability (m3/hm2) of room 2 (unchanged) and of the room following various draught
interventions. Control – no intervention, description of
abbreviation of retrofit measures in table 1.
Fig. 10. Internal and external temperature logging for room 2 (unchanged) and of the room following various draught interventions
TABLE V. DATA FOR INFORMATION SHOWN IN FIGURE 8 AND 9
Intervention Air blower Monitoring temperature Average air
permeability m3/hm2 @50Pa
Room temperature
prior to heating
Max room temperature during heating
cycle
Outside temperature
Control - no intervention
33.9 14 16 4.5-5.5
Curtain 33.7 14 16.5 4-5.5 Letterbox,
keyhole and draught cushion
(L-K-C)
34.4 14 16.5 4-6.5
Draught excluder letter flap, keyhole and draught cushion
(DLF-K-C)
32.5 14.5 16 3.5-5.5
Draught stripping, draught excluder
letter flap, keyhole, keyhole
and draught cushion (DS-DLF-K-C)
33 14 16.5 6-6.5
Curtain
The door curtain did not reduce draughts through the door (figure 9- result within the estimated 5% measurement error) but allowed the hallway to achieve a slightly higher temperature (0.5 °C increase) during the heating cycle. The thermal images suggest that the curtain reduces heat loss. As shown in fig 11, the door with no intervention (centre) is slightly lighter in shading than the door with curtains. This indicates that it is slightly warmer and consequently, more heat is transferring through it. The greater heat loss through the door with no curtain can be seen when comparing features of the two images: at the no intervention door in the centre, white predominates at the overlight while the letter box is yellow rather than purple and the door
0.00 10.00 20.00 30.00 40.00 50.00
Control Curtain L-K-C EF-K-C DS-EF-K-C
Ai
r
p
erme
abi
lit
y
(m3/
h
m2) Average
Pressurise
Depressurise
2 4 6 8 10 12 14
12 12.5 13 13.5 14 14.5 15 15.5 16 16.5 17
22 23 24 1 2
E
x
terna
l
tempe
ra
tu
re
Inter
na
l
tempe
ra
tu
re
Time No intervention Curtain
L-K-C EF-K-C
Vol. 2 Issue 3, March - 2016 panels are more yellow than orange. Conversely, the
brick wall to the side of the porch is darker as the image was taken later at night and the brick work was colder due to longer exposure to the cold night air. This further highlights the loss through the door with no curtain.
The curtain comprised of thin thermal lining with very low thermal mass. It appears to have little influence on air leakage and reducing heat transfer is likely on account of trapping an insulation layer of still air between the curtain and door.
Fig. 11.Door and external thermal image of door with no intervention (centre) and door with curtain (right)
Keyhole
The effect of using a keyhole cover for draughts and room temperature variations was not measured due to the very small size of the aperture and likely negligible results. The thermal image however clearly shows reduced air leakage through the keyhole when using a keyhole cover (Fig 12 – right) compared to without (Fig. 12 –centre).
Fig. 12.Door and external thermal image of door with no intervention (centre) and door with curtain (right)
Letterbox
Neither the conventional letterbox flap nor the draught excluder letterbox flap showed a definitive draught reduction through the door as both results are within the estimated 5% measurements error. The room temperature results suggest an improvement of 0.5 °C for both the letter box flap and draught excluding letter flap compared to the open letter box, but this may be influenced by variations in the initial room temperature and external temperature. The thermal images (fig 13) show reduced heat loss through the letter box opening when it is closed. It is likely that the small size of the opening (0.006 m2- considerably smaller than a typical letter box opening) has only a small effect on reducing draughts and heat loss through the door.
Fig.13. Keyhole and external thermal image of key hole open (centre) and closed (right) showing no observable difference in performance
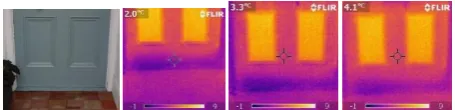
Draught stripping the door surround and threshold Unexpectedly, draught stripping had no influence on reducing draughts through the door. There is a small draught reduction of 1.45% when comparing the door with and without draught stripping (DLF-L-K and DS-DLF-L-K) which is within the estimated 5% measurements error. This result is further confirmed by the thermal images which show no difference in air leakage through the door following draught stripping (fig. 14). Thermal images of the lower section of the door show dark purple shading at the threshold with no draught stripping (fig 14 – second image from left) suggesting that little warm air is escaping from the house at this junction. The room achieved a higher temperature (1 °C increase) on the night when the draught stripping was applied (DS-DLF-L-K compared to DLF-L-K) although this is likely on account of the higher external temperature that night.
Fig. 14. Letterbox and external thermal of letterbox open (second image from left), conventional letter box flap (second image from right), draught excluding letter flap (right) showing more heat loss through the letter box with no draught intervention.
C. Room 3: landing
The air permeability and room temperature results for room 3 are shown in figures 15 and 16 and table 6. Only depressurisation results are shown for the air permeability on account of an error occurring (sealed door opening) during pressurisation.
Fig. 15.Air permeability (m3/hrm2) of room 3 with and without the attic hatch cover and Fig 16. Internal and external temperature logging for room 3, with and without
0.00 5.00 10.00 15.00 20.00 25.00 30.00
Control Attic hatch
A
ir
pe
rme
a
bili
ty
(m3
/hm2
)
the attic hatch cover.
Fig. 16.Internal and external temperature logging for room 3, with and without the attic hatch cover.
TABLE VI. DATA FOR INFORMATION SHOWN IN FIGURE 14 AND 15
Intervention Air blower
Monitoring temperature
Flow rate
m3/hr temperature Room prior to heating
Max room temperature during heating
cycle
Outside temperature
No intervention 4122.4 14.5 15.5 4-5.5 Attic hatch 4059.8 14.5 15.5 4-5.5
Attic hatch cover
Monitoring the temperature on the landing suggest that the attic hatch cover does not significantly impact the interior temperature. This may be partly due to the small size of the attic hatch cover (0.6 m2) when compared to the large volume of the hall, stairs and landing (approximately 77 m3). This is further confirmed by the air blower results and thermal imaging. The air blower tests showed a reduction in air flow rate of 62.6 m3/hr @50Pa (only 1.5% reduction). This figure is in keeping with Stephans (1998) who attributed only 2% air infiltration to the loft hatch [15]. The thermal image of the loft hatch without the cover (fig 16- centre) suggests some cold air infiltration around the seal from the attic above. Comparing the thermal images with and without the attic hatch cover (fig 17) suggests little difference in the temperature surrounding the hatch.
Fig. 17. Interior of attic hatch with thermal image without attic hatch cover (centre) and with attic hatch cover in roof above
IV. CONCLUSION
This paper investigates several draught reduction measures suitable for a typical Edwardian house that are in keeping with the important conservation
principles of minimum intervention and reversibility. The success of the interventions was investigated by measuring air permeability rates (air blower testing), thermal imaging and monitoring room temperature.
The research concludes that draught reduction measures can be highly successful in minimising the air permeability of the building envelope. The type of draughts and the success of intervention measures are highly building specific. However this case study of an Edwardian building is of a typology that is very common in Ireland and the UK and it is likely that many interventions discussed in this paper will provide similar successes in comparable buildings. The suspended timber floor was found to be the largest contributor to air leakage. Floor underlay and draught stripping between the boards reduced air flow by 50% and 62.5% respectively along with increasing floor surface temperature. The chimney contributed to 13.8% air leakage and a reduction in air leakage of 5.4% and 8% was achieved using a chimney balloon and a dampner respectively. Thermal window blinds reduced heat transfer through the glass but had only a small effect at minimising draughts (4.5% reduction). Measures to the front door (door curtain, letter flap and draught stripping) were found to have a small effect at reducing heat loss while the attic hatch cover had a negligible impact.
ACKNOWLEDGMENT
The authors wish to thank the Irish Research Council and Office of Public Works for funding this research. The authors also wish to thank Mr Gavin O’Se, GreenBuild Energy Rating and Building Information Services Ltd for undertaking the air blower testing and providing advice. Site support was provided by the Dept. of Civil Engineering, Trinity College Dublin and the authors thank Dr. Kevin Ryan, Michael Grimes and Michael Harris.
REFERENCES
[1] IPCC, “Climate Change 2014: Synthesis Report. Contribution of Working Groups I, II and III to the Fifth Assessment. Report of the Intergovernmental Panel on Climate Change,” Edited by Core Writing Team, R.K. Pachauri and L.A. Meyer, Geneva, Switzerland, 2014.
[2] E. Dennehy, M. Howley, “Energy in the Residential Sector,” Sustainable Authority of Ireland Report, 2013.
[3] C. Ahern, P. Griffiths and M. O’Flaherty, “State of the Irish housing stock—Modelling the heat losses of Ireland’s existing detached rural housing stock & estimating the benefit of thermal of thermal retrofit measures on this stock” Energy Policy, vol. 55 pp. 139- 151, 2013.
[4] DoEHLG, “Limiting Thermal Bridging and Air Infiltration - Acceptable Construction Details,” 0
2 4 6 8 10 12
12 12.5 13 13.5 14 14.5 15 15.5 16
22 23 24 1 2
E
x
terna
l
tempe
ra
tu
re
Inter
na
l
tempe
ra
tu
re
)
Time
Vol. 2 Issue 3, March - 2016 Department of Environment, Heritage and Local
Government. Dublin, 2011.
[5] D. Sinnott and M. Dyer, “Airtightness of Dwellings in Ireland: Design, Workmanship and Control,” in: Proceedings of the RICS Foundation Construction and Building Research Conference, Manchester, UK, 2011.
[6] FRd’A. Alfano, M. Dell’Isola, G. Ficco and F. Tassini, “Experimental analysis of air tightness in Mediterranean buildings using the fan pressurization method,” Building and Environment, vol. 53 pp. 16-25, 2012.
[7] Central Statistics Office, Census 2011, “Profile 4: The roof over our heads,” Report, Central Statistics Office, Dublin, Ireland, 2012.
[8] Building Regulations, “Technical Guidance Document, Part L- Conservation of Fuel and Energy – Dwellings,” Department of Environment, Community and Local Government, Dublin, Ireland, 2011.
[9] T. Kalamees “Air tightness and air leakages of new lightweight single-family detached houses in Estonia,” Building and Environment, vol. 42 pp. 2369–
2377, 2007.
[10] J. Kurnitski, J. Eskola, J. Palonen and O. Seppanen, “Ventilation in Finnish single-family houses,” in: Proceedings of the eighth REHVA world congress clima, Lausanne, Switzerland, 2005.
[11] J. Toftum, “Air movement--good or bad?” Indoor Air, vol. 14 Suppl 7 pp. 40-5, 2004.
[12] J. Toftum, G. Zhou and A. Melikov, “Effect of airflow direction on human perception of draught,” in: Proceedings of Clima 2000 Conference, Brussels, 1997.
[13] W.R. Chan, W.W. Nazaroff, P.N. Price, M.D. Sohn and A.J. Gadgil, “Analyzing a database of residential air leakage in the United States,” Atmospheric Environment, vol. 39, pp. 3445-3455, 2005.
[14] D. Sinnott and M. Dyer, “Air-tightness field data for dwellings in Ireland,” Building and Environment, vol. 51 pp. 269-275, 2012 .
[15] R. K. Stephen, “Airtightness in UK dwellings: BRE’s test results and their significance,” Report 359, Building Research Establishment, United Kingdom, 1998.
[16] ASHRAE Handbook, “Fundamentals, American Society of Heating,” Refrigerating, and Air-Conditioning Engineers, 1997; Ch 25.
[17] D.J. Dickerhoff, D.T. Grimsrud and R. D. Lipschutz, “Component leakage testing in residential buildings,” in: Proceedings of the American Council for an Energy-Efficient Economy, 1982 Summer Study, Santa Cruz, CA. Report LBL 14735. Lawrence Berkeley National Laboratory, Berkeley, CA, 1982.
[18] D.T. Harrje and G.J. Born, “Cataloguing air leakage components in houses,” in: Proceedings of the ACEEE Summer Study, Santa Cruz, CA. American Council for an Energy-Efficient Economy, Washington, D.C., 1982.
[19] P. Baker, “Improving the thermal performance of traditional windows,” Historic Scotland Report, 2008.
[20] D. Sinnott and M. Dyer, “Airtightness and Ventilation of Social Housing in Ireland – A Review Of Field Measurements and Occupant Perspectives Pre- And Post- Retrofit,” in: Proceedings of the 34th AIVC annual conference, Athens, 2013.
[21] M. Bell and R. Lowe, “Energy efficient modernisation of housing: a UK case study,” Energy and Buildings, vol. 32, pp. 267–280, 2002.
[22] M.R. Hall, S.P. Casey, D.L. Loveday and M. Gillott, “Analysis of UK domestic building retrofit scenarios based on the E.ON Retrofit Research House using energetic hygrothermics simulation - Energy efficiency, indoor air quality, occupant comfort, and mould growth potential,” Building and Environment, vol. 70, pp.48-59, 2013.
[23] S. Hong, I. Ridley and T. Oreszczyn, “The impact of energy efficient refurbishment on the airtightness in English dwellings,” in: Proceedings of the 25th AVIC Conference, 2004.
[24] EN 13829:2001, “Thermal performance of buildings – Determination of air permeability of buildings – Fan pressurization method”, 2001.
[25] J. Kronvall, “Testing of houses for air-leakage using a pressure method,” ASHRAE Transactions, vol. 84 pp. 72–9, 1978.