Volume-7 Issue-2
International Journal of Intellectual Advancements
and Research in Engineering Computations
A study report on safety performance in road construction
G. Arvindh
1, Dr. R. Loganathan
21,2
Department of Civil Engineering, Builders Engineering College
,
Tiruppur, India
ABSTRACT
Indian society and economy have suffered human and financial losses as a result of poor safety record in construction industry. In general accidents occur due to lack of knowledge about nature of work, lack of supervision and carelessness. Study of safety performance in road construction aims at assessing healthy and safe work environment in road sector for employees to conduct their roles and responsibilities and thus by minimizing impacts of accidents. Practices adopted on training to employees, hazards assessment and control measures of road industry will be studied.
Keywords:
Safety performance, Road construction, Training.INTRODUCTION
The road construction industry is one of the oldest and one of the most dangerous industries worldwide from the ancient. It is unskilled labour intensive and requires movement of materials and machinery within a confined area. On-road safety in India is amongst the poorest in the world. As per some rough estimate conducted few years back, more than 90,000 lives are lost on Indian roads every year. Rough assessment suggests that road accidents cause financial loss to the country to an extent of 2% to 3% of GDP, besides causing loss to the victims, their families and leaving behind a lingering agony to the society at large.
The reasons for considering safety include Humanitarian concern
Economic reasons Laws and regulations
Safety Culture
Accidents cause several damages in terms of materials loss, injury and damage to men and machinery. Apart from being expensive accidents lower the rate and result in lower production rates. As a group companies with excellent safety records probably have more satisfied workers than
the companies with high accident occurrence and frequency. Thus, accident prevention becomes paramount concern the modern industries. Safety culture is very lenient and the people in the safety department they do not have basic engineering qualification. Company must take action to put only qualified staff not like safety stewards. Most of the people in the safety are non-engineering background.
Causes of Accidents
The main causes for accidents proneness due to differences in physiological and psychological in individuals are responsible for a certain mode of behavior of people. The demographic factors of workers like Age – Young and old get involved more frequently, Experience, mental ability, Emotional factors – emotionally depressed, fear, nervousness, worry, impulsiveness, etc., Vision, Health - diseases like T.B, diabetes, sleeping, Physically impaired etc. On the occurrence of any accident, impartial analysis of what had actually triggered the accident, extent of damage, people who were injured, compensation, work damage, safety lapses and then the report to contain safeguards to be adhered to records.
It is estimated that about 8.5 million workers in the country are engaged in road and other construction works.
Need for study
In road construction all accidents are preventable, unless it’s thought and executed proactively. Reactive measures are followed and adopted once if accident occurs but proactive thinking can eliminate the accidents well ahead of its occurrence. Hence, a proactive EHS management system can be developed by doing this study to clearly define roles, responsibilities, actions to be taken to maintain Environment, Health and Safety effectively in a project.
OBJECTIVE
a) To identify safety aspects of employees to be improved.
b) To identify activity that cause permanent disabling injuries and fatalities.
c) To suggest measures to avoid safety hazard at site.
d) To study safety implementation at site.
METHODOLOGY
Methods of data collection
There are two types of data collection namely primary and secondary data to ensure the values to some extent.
Primary data is the data collected for the first time through field survey. Such data are collected with specific set of objectives to assess the current status of any variable studied. This has been used to collect the data for the purpose of this study.
Secondary data are the data, which are collected by the questionnaire survey. The following flowchart indicates methodology adopted for the project
Study of present safety management in the site
Collection of field particulars of the site
Questionnaire design
Data collection by questionnaire survey Selection of construction
Journal collection Title selection
Fig 1. Methodology used
QUESTIONNAIRE DESIGN, DATA
COLLECTION AND SPSS ANALYSIS
There are twenty seven questions where prepared based on likert scale for departments of
safety, highway, quality control, quarry and to the labour. The response obtained from five members of each department.
Table 1 Likert Scale STATEMENT SD D NA/ND A SA
MARKS 1 2 3 4 5
Where, SD - Strongly Disagree, D - Disagree, NA/ND - Neither Agree/Nor Disagree, A -Agree, SA - Strongly Agree
SPSS Analysis
SPSS Statistics is a software package used for statistical analysis. The current versions (20) are officially named "IBM SPSS Statistics" is used to analyse the data.
Safety Department
Table 2 Safety Department personal protective
equipment
sp66
implemented
fire
extinguisher
near miss reports
labours trained
Mean 3.0000 3.0000 4.0000 3.0000 3.6667
N 3 3 3 3 3
Std. Deviation
1.00000 1.00000 1.00000 1.00000 1.52753
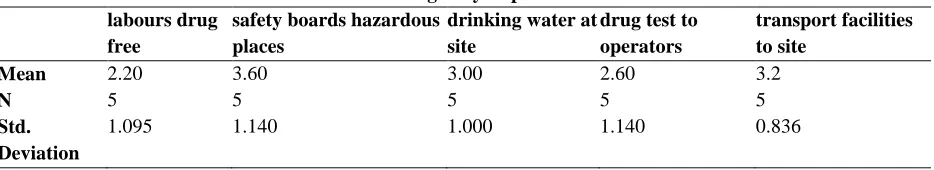
Highway Department
Table 3 Highway Department labours drug
free
safety boards hazardous places
drinking water at site
drug test to operators
transport facilities to site
Mean 2.20 3.60 3.00 2.60 3.2
N 5 5 5 5 5
Std. Deviation
1.095 1.140 1.000 1.140 0.836
Suggestive measures and conclusion
Quality Control Department
Table 4 Quality Control Department hazardous
chemicals labeled
first aid during testing
labours using ppe
risks from electrical equipments
inpection of chemicals
chemical wastes disposed Mean 3.60 3.40 3.40 2.80 3.60 3.80
N 5 5 5 5 5 5
Std. Deviation
1.148 1.140 1.140 1.303 0.894 0.836
Quarry
Table 5 Quarry pollution
monitoring system
quarry safe zone
reuse recycle waste
sirens before blasting
workers ear muffs
vehicles speed limit Mean 3.800 3.60 3.20 4.40 2.60 2.40
N 5 5 5 5 5 5
Std. Deviation
0.836 1.140 0.836 0.894 1.140 1.140
F. Labours
Table 6 Labours working hours
satisfied
food and shelter satisfied
health insurance
proper medical facilities
extra wages for overtime
Mean 3.20 2.40 3.40 2.40 2.40
N 5 5 5 5 5
Std. Deviation
0.836 1.140 1.140 1.140 1.140
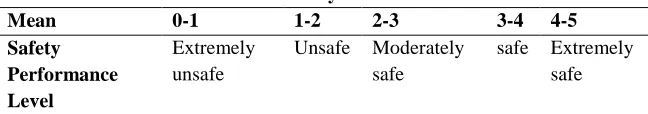
RESULTS AND DISCUSSION
From the analysed data it is found that the mean values lie between 2.20 to 4.40. The safety
performance in road construction is measured with the help of safety performance index table.
Table 7 Safety Performance Index
Mean 0-1 1-2 2-3 3-4 4-5
Safety Performance Level
Extremely unsafe
Unsafe Moderately safe
safe Extremely safe
Table 8 Safety Performance Analysis
Sl.no Departments mean Safety performance level
1 Safety 3.33 Safe
2 Highway 2.92 Moderately safe
3 Quality control 3.43 Safe
4 Quarry 3.33 Safe
CONCLUSION
This project is helpful in understanding about engineering works, process involved in road construction, preliminary surveys to be taken, difficulties during the work, present safety management at site and need for safety management in construction. After completion of project the information obtained from this study might be useful to many construction companies, particularly for companies where construction safety awareness is not high.
SUGGESTIVE MEASURES
From the findings of work it was observed that the sites have their own merits and demerits. Few
measures are given based on the factors of details gathered
a. Proper supply of water to the sites should be established.
b. Nearest hospital address should be displayed in notice board.
c. The Fire extinguishers should be checked properly every week
d. All the workers on the construction site should be provided with appropriate safety training. e. Minimum requirements and needs for Healthy
living of workers should be provided.
f. Companies should ensure proper PPE provisions to workers . Workers should be explained about the hazardous nature of work environment
REFERENCE
[1]. Subramani, Lordsonmillar, ’Safety management analysis in construction industry’, International journal of Engineering Research and Applications, 4, 2014, 117-120.
[2]. Pradeep Kumar, Sachin Agrawal, Pammikumari, ’Ergonomics methods to improve safety in construction’, International Research Journal of Engineering and Technology (IRJET), 6, 2016, 680-683.
[3]. Jasmin, Sayyad, Milind M Darade, ’A Review Of Health Risk On Construction Site’, International Research Journal of Engineering and Technology (IRJET), 4, 2017, 2082-2084.
[4]. Roopashree, RoshanPandey, Vaishnavi, ’RoadSign Detection and Recognition System’, International Research Journal of Engineering and Technology (IRJET), 5, 2018, 69-71.
[5]. Nicole S. N. Yiu, Daniel W. M. Chan, ‘A taxonomic review of applicatins of safety management systems in construction’, Journal of International Scientific Publications, 10, 2016, 394-408.
[6]. .MohanaPriya, Kothai, Kohilambal, ‘Analysis of safety management system in construction’, International Journal of Recent Trends in Engineering & Research (IJRTER), 2, 2016, 198-203.
[7]. Dhivaagar, Raja, MuthuMariappan, ‘A Study on Proactive EHS Management System and Its Implementation in Construction Industry’, International Journal of Latest Technology in Engineering, Management & Applied Science (IJLTEMAS), 4, 2015, 79-82.
[8]. AkhileshYadav, RuchiChandrakar, ‘Construction of plastic roads: An effective way to utilize wastes’ International Research Journal of Engineering and Technology (IRJET), 4, 2017, 650-652.
[9]. SachinKaloniya, ‘Occupational hazards and safety assessment of construction workers’ International Journal For Innovative Research in Multidisciplinary Field, 2, 2016, 191-195.