Stewart, Craig (2012) A cultural education model: design
and implementation of adaptive multimedia interfaces in
eLearning. PhD thesis, University of Nottingham.
Access from the University of Nottingham repository: http://eprints.nottingham.ac.uk/12587/1/PhD_thesis.pdf Copyright and reuse:
The Nottingham ePrints service makes this work by researchers of the University of Nottingham available open access under the following conditions.
· Copyright and all moral rights to the version of the paper presented here belong to the individual author(s) and/or other copyright owners.
· To the extent reasonable and practicable the material made available in Nottingham ePrints has been checked for eligibility before being made available.
· Copies of full items can be used for personal research or study, educational, or not-for-profit purposes without prior permission or charge provided that the authors, title and full bibliographic details are credited, a hyperlink and/or URL is given for the original metadata page and the content is not changed in any way.
· Quotations or similar reproductions must be sufficiently acknowledged.
Please see our full end user licence at:
http://eprints.nottingham.ac.uk/end_user_agreement.pdf A note on versions:
The version presented here may differ from the published version or from the version of record. If you wish to cite this item you are advised to consult the publisher’s version. Please see the repository url above for details on accessing the published version and note that access may require a subscription.
A
CULTURAL
EDUCATION
MODEL:
DESIGN
AND
IMPLEMENTATION
OF
ADAPTIVE
MULTIMEDIA
INTERFACES
IN
eLEARNING
CRAIG
D.
STEWART,
BSc,
MSc.
Thesis submitted to the University of Nottingham
for the degree of Doctor of Philosophy
July 2012
ABSTRACT
This thesis presents research performed over the span of 9 years in the area of adaptive multimedia interfaces (specifically Adaptive Hypermedia in eLearning), with special focus on a cultural education model.
In particular, the thesis looks at how the adaptive interfaces can cater for cultural diversity in education, instead of presenting a homogenous delivery for the whole student population, regardless of their cultural background. Specifically, this research provides a framework for cultural adaptation, CAE (Cultural Artefacts in Education), based on Marcus & Gould’s web model, as well as its source, Hofstede’s indexes. This framework is supported by a questionnaire, the CAE questionnaire, a key product of this research, which has been shown to map on Hofstede’s indexes, and which has been used to model features for personalised adaptive interfaces for different cultures. The questionnaire is in English language, but this work also presents a study showing to what extent the results obtained are similar to native language questionnaire results.
The CAE Framework is further extended by providing two ontologies, a full scale ontology, called the CAE F ontology, and a light weight ontology, called the CAE L ontology. These ontologies detail the HCI (Human Computer Interaction) features that need to be integrated into an adaptive system in order to cater for cultural adaptation. These features can be used for all types of adaptation, as defined in adaptive hypermedia. The latter ontology is then illustrated in a study of eleven countries, for the specific cultural adaptation case of interface adaptation, of which current research is extremely sparse.
These illustrations are further used in a formative evaluation, which establishes to what extent the cultural adaptation ontologies can be applied. This is followed by a summative, real life evaluation of cultural adaptation for Romanian students, and the results are reported and discussed. This study validates the proof of concept for using CAE in a real world setting.
Finally, the overall achievements of this work are summarised, conclusions are drawn, and recommendation for further research are done.
PUBLISHED PAPERS LIST
These are the papers I’ve published during my thesis work, in direct relation to the thesis:
JOURNAL PAPERS
C. Stewart, “Authoring & Culture in Online Education”, Journal of Universal Computer Science, special issue on Authoring of Adaptive and Adaptable Hypermedia (http://www.jucs.org/jucs_14_17), vol 14, issue 17, pp 2877, 2009.
Contribution: 100%
CONFERENCE PAPERS
M L. Bourguet, C. Stewart, B. Cox and D. Lefevre, “Adaptive learning environments to overcome cultural and language barriers to learning”, in the IADIS conference on Cognition and Exploratory Learning in Digital Age (CELDA) 2006, pp462 463, ISBN 972 8924 22 4, Barcelona, Spain, December 8 10, 2006.
Contribution: 30%
C. Stewart, “The Role of Culture in Online Education: as an input for the authoring process”, in the User Modelling (UM) 2007 conference, A3H workshop, Corfu, Greece, June 25 29, 2007.
Contribution: 100%
C. Stewart, K. Chandramouli, A. Cristea, T. Brailsford and E. Izquierdo, “Cultural Artefacts in Education: Analysis, Ontologies and Implementation”, in the IEEE International Conference on Information Technology in Education, (CITE 2008), Wuhan, China, IEEE, ISBN: 978 0 7695 3336 0, pp. 706 709, 2008.
Contribution: 95%
K. Chandramouli, C. Stewart, T. Brailsford and E. Izquierdo, “CAE L: An Ontology Modelling Cultural Behaviour in Adaptive Education”, in the IEEE 3rd International Workshop on Semantic Media Adaptation and Personalization, IEEE ISBN: 978 0 7695 3444 2, pp 183 188, 2008,
Contribution: 95%
C. Stewart, T. Brailsford, K. Chandramouli and A.I. Cristea, “The CAE L Cultural Framework: Definition, Instances and Web Service”, accepted for IEEE International Conference on Advanced Learning Technologies (ICALT) 2010, July, Tunisia, 2010
Contribution: 95%
ACKNOWLEDGEMENTS
First, I would like to thank my PhD supervisors, Dr. Helen Ashman and Dr Tim Brailsford for their mentorship, guidance, support, and positive criticism throughout. I am also grateful for their organization of funding for my research throughout the early years of this work, without it this work would not have been possible.
Furthermore I wish to thank all collaborators in the ADAPT and K Space projects. The work in these projects has helped me gain valuable skills and has been very rewarding.
I also wish to thank the members of the Web Technologies Group at the University of Nottingham and the Multimedia and Vision lab at Queen Mary, University of London, for their interest in and valuable feedback on my research. I would like to specifically mention Krishna Chandramouli and Susan Scarborough, who very kindly helped.
I am also thankful to my friends and family, specifically Neil and Richard who were very helpful in pestering me and proof reading my thesis.
Special thanks to Alexandra for her support, boundless patience and proof reading of this thesis.
TABLE OF CONTENTS 1 Introduction 2 1.1 Motivation 2 1.2 Research Goals 3 1.2.1 Aims 4 1.2.2 Objectives 4 1.2.3 Assumptions 5 1.3 Background 6 1.3.1 21st Century Education 6 1.3.1.1 Traditional Education 6 1.3.1.2 Schools 6 1.3.1.3 Universities 7
1.3.1.4 The last 20 years: eLearning waxing 8
1.3.2 Adaptive Hypermedia Systems 10
1.3.3 Culture and Education 11
1.3.4 Culture and AHS 12
1.4 Thesis Contributions 12 1.5 Thesis Outline 12 2 Related Research 16 2.1 Introduction 16 2.2 Adaptive Hypermedia 16 2.2.1 Adaptive methods 16 2.2.2 Adapt to what? 17 2.2.3 AEH Systems 18 2.2.3.1 WHURLE 18 2.2.3.2 MOT 18 2.2.3.3 AHA! 18 2.2.3.4 ISIS Tutor 19 2.2.3.5 TANGOW/WOTAN 19 2.2.3.6 ALE 20 2.2.3.7 APelS 20 2.2.3.8 Adaptive VIBE 20 2.2.3.9 GALE 20 2.2.3.10 ADE 21 2.2.3.11 Which AEH? 21
2.3 Culture and eLearning 22
2.4 Cultural Indices 23
2.4.1 Hofstede’s Value Survey Module 23
2.4.2 Schwartz’s Value Inventory 25
2.4.3 Inglehart’s World Values Survey 26
2.4.4 Survey Choice Why Hofstede? 26
2.5 Hofstede and Marcus, Cultural Indices and Web Design 27
2.5.1 Culture? 27
2.5.2 Hofstede on the Web: The Marcus [marcus & Gould, 2000a] interpretation 28
2.5.2.1 Power Distance Index: 28
2.5.2.2 Collectivism vs. individualism index 29 2.5.2.3 Femininity vs. masculinity index 29
2.5.2.4 Uncertainty avoidance index 30
2.5.2.5 Long vs. short term orientation 30
2.6 Ontologies in Education 31
2.7 Ontology Engineering 31
2.7.1 Semantic Languages and Expressiveness 31 2.7.2 Resource Description Framework (RDF) 31
2.7.3 Web Ontology Language (OWL) 32
2.7.4 Protégé and OWL 33
2.7.5 Sesame 34
2.8 Summary 34
2.9 Next 34
3 The CAE Questionnaire 36
3.1 Introduction 36
3.2 Design 36
3.2.1 Recap Hofstede indices 38
3.2.2 The CAE Indices 39
3.3 Hypothesis 1: Hofstede’s cultural dimensions apply to the educational domain. 40 3.4 Hypothesis 2: Students desire to be taught in the manner that they have been brought up
with. 42
3.5 Hypothesis 3: There is a cultural bias in the acceptance of openly acknowledged Adaptive
Educational systems. 43
3.6 Survey Results 43
3.6.1 Results: no statistical difference between countries (p>0.05) 46 3.6.2 Results: statistical difference between countries (p<=0.05) 55 3.6.2.1 Question 5: “Teachers / trainers should act as friends not gurus” 56 3.6.2.2 Question 7: “When given educational information I prefer it to be presented in a tightly structured and regulated manner” 58 3.6.2.3 Question 10: “There should be as much structure and directions in a lesson as possible to ensure that there is no ambiguity” 59 3.6.2.4 Question 11: “I prefer to reduce complexity by using smaller, limited amounts of
information” 61
3.6.2.5 Question 12: “I think that ‘understanding’ should be the goal of education, not the completion of ‘learning tasks’ and ‘exams’” 62 3.6.2.6 Question 13: “I prefer lessons that emphasise practice and practical values rather
than abstract theories and ‘truth’” 64
3.6.2.7 Question 14: “Separation of the genders in education enables more effective teaching, with a teacher better able to target each group” 66 3.6.2.8 Question 15: “I concentrate on each educational task separately and require immediate results to gauge my success” 67 3.6.2.9 Question 19: “I would prefer to be educated in my own language” 69 3.6.2.10 Question 20: “Given the chance, I would prefer to be educated in another
country” 70
3.6.2.11 Question 21: “In choosing a university, the ability to practice languages other
than my own is important” 72
3.6.2.12 Question 22: “I respect the manner in which my teachers have taught me” 74
3.6.3 Results: Further Analyses 75
3.6.3.1 Gender Differences 75
3.6.3.2 Age Differences 76
3.6.4.1 CAE Results: Hofstede Indices 80 3.6.5 CAE results: the CEI and AEI 84
3.7 Summary 86 3.7.1 Hypothesis 1 86 3.7.1.1 Hypothesis 1.1 86 3.7.1.2 Hypothesis 1.2 87 3.7.1.3 Hypothesis 1.3 87 3.7.1.4 Hypothesis 1.4 87 3.7.1.5 Hypothesis 1.5 87 3.7.2 Hypothesis 2 87 3.7.3 Hypothesis 3 88 3.8 Next 88 4 CAE Framework 90 4.1 1. Introduction 90
4.2 The CAE Ontologies 90
4.3 Ontology Concept Description 93
4.4 CAE F User Model Instances 101
4.4.1 Austria 102 4.4.2 China 103 4.4.3 France 104 4.4.4 Germany 104 4.4.5 Greece 105 4.4.6 India 106 4.4.7 Ireland 107 4.4.8 Netherlands 107 4.4.9 Romania 108 4.4.10 Saudi Arabia 109 4.4.11 United Kingdom 110
4.5 CAE L, XML and Xschema 111
4.5.1 CAE L ontology: 111
4.5.2 CAE L XML 115
4.5.3 XML schema for CAE L 116
4.6 Summary 118
4.7 Next 118
5 CAE Software 120
5.1 Introduction 120
5.2 CAE L Process 120
5.2.1 Protégé and OWL 121
5.2.2 Sesame Interface 124
5.3 CAE L service application 126
5.4 CAE L web service 128
5.5 CAE L in Adaptive Educational Hypermedia systems 129
5.5.1 Example CAE L webpage: China 135
5.6 Summary 137
5.7 Next 137
6 CAE L Formative evaluation 139
6.2 Countries (Students) selected 139
6.3 Questionnaire 140
6.3.1 Questionnaire Introduction 141
6.3.2 Questionnaire Screenshots & description 141
6.3.3 Question page 142
6.4 Results & Analysis 143
6.5 Summary 147
6.6 Next 147
7 Summative Evaluation in ADE 149
7.1 Introduction 149
7.2 ADE MODIFICATIONS 149
7.3 CAE L Summative Experimental Design 149
7.3.1 Student Cohort 149
7.3.2 Experimental Proceedure 150
7.3.2.1 Quantitative Experiment for the GBR vs. ROU groups (Experiment 1) 150 7.3.2.2 Qualitative Study examining the validity of the ROU Stereotype (Experiment 2) 152
7.3.3 Analysis Procedure 153
7.3.3.1 Quantitative analyses for the GBR vs. ROU groups (Experiment 1) 153 7.3.3.2 Qualitative analyses examining the validity of the ROU Stereotype (Study 2) 154
7.4 Results 154
7.4.1 Experiment 1: ROU vs. GBR (does stereotype matter?) 154
7.4.1.1 Question 6 155
7.4.1.2 Question 7 156
7.4.1.3 Degree of Change 157
7.4.2 Study 2: ROU stereotype, match or mismatch with Romanian Students 158
7.4.2.1 Question 2 159
7.4.2.2 Question 3i and Question 3ii 159
7.4.2.3 Question 4ii 159 7.4.2.4 Question 6 160 7.4.2.5 Question 10 160 7.5 Summary 160 7.6 Next 161 8 Localised CAE 163 8.1 Introduction 163
8.2 CAE – Chinese version 164
8.2.1 Question 21 167
8.2.2 Question 28 168
8.3 CAE – Hindi version 169
8.3.1 Question 2 171
8.3.2 Question 24 172
8.3.3 Question 32 173
8.4 Summary 174
8.5 Next 174
9 Discussion and Conclusions 176
9.1 Research Aims Revisited 176
9.1.1 (1) Investigate culture based personalisation techniques for education 176 9.1.2 (2) Identify the effect that culture has on a student’s education 176
9.1.3 (3) Create a test system that will allow for interface personalisation of educational materials according to the cultural stereotypes 179 9.1.4 (4) The evaluation of this new layer of adaptation and personalisation will be
undertaken 180
9.1.4.1 Formative Evaluation 180
9.1.4.2 Summative Evaluation 181
9.1.5 (5) Investigate if there is a bias in the cultural questionnaire due to language 181
9.2 Contributions of the Thesis 182
9.3 Overall Summary 182
9.4 Future Work 183
10 References 187
11 Appendix A: CAE Questionnaires 196
11.1 CAE Questionnaire GBR 196
11.2 CAE Questionnaire CHN 201
11.3 CAE Questionnaire IND 207
12 Appendix B: CAE L XML instances 213
12.1 CAE L – AUT 213 12.2 CAE L – CHN 213 12.3 CAE L – DEU 213 12.4 CAE L – FRA 214 12.5 CAE L – GBR 214 12.6 CAE L – GRC 214 12.7 CAE L – IND 215 12.8 CAE L – IRL 215 12.9 CAE L – NLD 215 12.10 CAE L – ROU 216 12.11 CAE L – SAU 216
13 Appendix C: CAE L XSchema 217
14 Appendix D: CAEL WSDL 221
15 Appendix E: Structured Interview Questionnaire 224 16 Appendix F: Structured Interview Questionnaire Responses 225 16.1 Student 1 (S1) / Interviewer (I) 225 16.2 Student 2 (S2) / Interviewer (I) 226 16.3 Student 3 (S3) / Interviewer (I) 228 17 Appendix G: Full text of PHP and Perl Quizes 231
17.1 PHP Quiz 231
17.2 Perl Quiz 235
18 Appendix H: Full text of CAE Evaluation Questionnaire (v 2.0) 241
LIST OF FIGURES
Figure 1.1: diagram showing the three major domains investigated within this thesis, along with their
traditional cross over sub domains. ... 2
Figure 1.2: thesis structure diagram, linking research themes with the Chapter it can be found in (e.g. 'Research Question and Background' in 'C 1', chapter 1) ... 14
Figure 3.1: histogram of data for Q26, when examining the effect gender has on the CAE response .. 76
Figure 3.2: histogram of data for Q22, when examining the effect gender has on the CAE response .. 77
Figure 3.3: histogram of data for Q25, when examining the effect gender has on the CAE response .. 78
Figure 3.4: distribution of data (boxplot) for Q25, when examining the effect age has on CAE response ... 78 Figure 3.5: histogram of data for Q29, when examining the effect gender has on the CAE response .. 79 Figure 3.6: distribution of data (boxplot) for Q29, when examining the effect age has on CAE response ... 79 Figure 4.1: The CAE F ontology outlining the relationship between the concepts and Hofstede’s indices. ... 91 Figure 4.2: Model of CAE F Ontology Framework ... 92 Figure 4.3: Model of CAE L Ontology Framework ... 92 Figure 4.4: key for CAE Ontology for Figure 4.2 and Figure 4.3 ... 93
Figure 4.5: Instance Diagram of the CAE F Ontology for Austria (AUT) ... 102
Figure 4.6: Instance Diagram of the CAE F Ontology for China (CHN) ... 103
Figure 4.7: Instance Diagram of the CAE F Ontology for France (FRA) ... 104
Figure 4.8: Instance Diagram of the CAE F Ontology for Germany (DEU) ... 105
Figure 4.9: Instance Diagram of the CAE F Ontology for Greece (GRC) ... 106
Figure 4.10: Instance Diagram of the CAE F Ontology for India (IND) ... 106
Figure 4.11: Instance Diagram of the CAE F Ontology for Ireland (IRL) ... 107
Figure 4.12: Instance Diagram of the CAE F Ontology for Netherlands (NLD) ... 108
Figure 4.13: Instance Diagram of the CAE F Ontology for Romania (ROU) ... 109
Figure 4.14: Instance Diagram of the CAE F Ontology for Saudi Arabia (SAU) ... 109
Figure 4.15: Instance Diagram of the CAE F Ontology for United Kingdom (GBR) ... 110
Figure 4.16: the CAE L XML structure (cael.xml). ... 115
Figure 4.17: the CAE L XML instance for Austria (cael aut.xml). ... 116
Figure 4.18: the CAE L XSchema structure (caels.xsd), the full XSD file is given in Appendix D. ... 117
Figure 5.1: CAE Light Ontology editor ... 121
Figure 5.2: Screenshot for “Classes” definition ... 122
Figure 5.3: Screenshot for the “Property” definition ... 122
Figure 5.4: The Sesame repository for CAE Light Ontology ... 124
Figure 5.5: Instantiation of CAE L Class from CAE L Ontology ... 125
Figure 5.6: Sesame workbench query results. ... 125
Figure 5.7: The CAE L web service overview. ... 128
Figure 5.8: The CAE L web service message detail. ... 129
Figure 5.9: An example website designed to showcase the CAE L adaptation features. ... 130
Figure 5.10: The example webpage, showing the interaction between CAE L concepts and the site sections/functions. ... 131
Figure 5.11: the example AEH webpage using the cultural stereotype for China. ... 135
Figure 6.1: An example of one of the screenshot & description pages from the evaluation questionnaire. ... 142
Figure 7.1: A screenshot of the PHP pre test in ADE. ... 151 Figure 7.2: A screenshot of the PHP course in ADE – adapted using the ROU CAE L stereotype. ... 151 Figure 7.3: A screenshot of the PHP course in ADE – adapted using the GBR CAE L stereotype. ... 152 Figure 7.4: A screenshot of the CAE Evaluation questionnaire given after the ADE PHP course (See Appendix H for full text). ... 154 Figure 7.5: The results of the Mann Whitney U analysis for evaluation Q6. ... 156 Figure 7.6: The results of the Mann Whitney U analysis for evaluation Q7. ... 157 Figure 7.7: The results of the Mann Whitney U analysis for the degree of change in scores for the ROU vs. GBR evaluation. ... 158 Figure 8.1: a screenshot of the English language version of the CAE questionnaire (http://138.37.35.159:8080/CAEQuestionnaire/). ... 164 Figure 8.2: a screenshot of the Chinese language script of the CAE questionnaire (http://138.37.35.159:8080/CAEQuestionnaire cn/). ... 165 Figure 8.3: a boxplot showing the spread of the responses for Q21 (note CHNORI, is the label for the English questionnaire respondents and CHN is the label for the Chinese questionnaire respondents).
... 167 Figure 8.4: a boxplot showing the spread of the responses for Q28 (note CHNORI, is the label for the English questionnaire respondents and CHN is the label for the Chinese questionnaire respondents).
... 168 Figure 8.5: a screenshot of the Hindi language script of the CAE questionnaire (http://138.37.35.159:8080/CAEQuestionnaire Hn/index.jsp). ... 169 Figure 8.6: a boxplot showing the spread of the responses for Q2 (note, INDORI is the label for the English CAE respondents and IND is the label for the Hindi CAE respondents). ... 172 Figure 8.7: a boxplot showing the spread of the responses for Q24 (note INDORI, is the label for the English CAE respondents and IND is the label for the Hindi CAE respondents). ... 173 Figure 8.8: a boxplot showing the spread of the responses for Q32 (note INDORI, is the label for the English CAE respondents and IND is the label for the Hindi CAE respondents). ... 173 Figure 9.1: Instance Diagram of the ‘estimated’ CAE F Ontology for Mexico (MEX) ... 178
LIST OF TABLES
Table 2.1: Colour meaning tables from [Barber and Badre, 1998] ... 22
Table 2.2: The effect of the PDI on web interfaces ... 29
Table 2.3: The effect of the IDV on web interfaces ... 29
Table 2.4: The effect of the MAS on web interfaces ... 29
Table 2.5: The effect of the UAI on web interfaces ... 30
Table 2.6: The effect of the LTO on web interfaces ... 30
Table 3.1: the Likert scale used by respondents to the CAE questionnaire and the score assigned ... 38
Table 3.2: The 18 questions used to investigate hypothesis 1 (HI, Hofstede’s Index). ... 41
Table 3.3: The questions used to investigate hypothesis 1 (HI, Hofstede’s Index) along Hofstede’s Power Distance Index. ... 41
Table 3.4: The questions used to investigate hypothesis 1 (HI, Hofstede’s Index) along Hofstede’s Uncertainty Avoidance Index. ... 41
Table 3.5: The questions used to investigate hypothesis 1 (HI, Hofstede’s Index) along Hofstede’s Individualism Index. ... 41
Table 3.6: The questions used to investigate hypothesis 1 (HI, Hofstede’s Index) along Hofstede’s Masculinity Index.... 42
Table 3.7: The questions used to investigate hypothesis 1 (HI, Hofstede’s Index) along Hofstede’s Long Term Orientation Index. ... 42
Table 3.8: The questions used to investigate hypothesis 2 (CAEI, CAE Index, in this case CEI, or Cultural Education Index). ... 42
Table 3.9: The questions used to investigate hypothesis 3 (CAEI, CAE Index, in this case AEI, or Adaptive Education Index). ... 43
Table 3.10: the number of respondents (‘n’) from the eleven countries examined in this chapter ... 44
Table 3.11: the Hofstede scores for the countries under investigation (*, the scores given here are gathered by [Neculaesei and Tatarusanu, 2008] using Hofstede's VSM 08). ... 44
Table 3.12: the CAE questions and the ‘p’ value (significance) determined from the null hypothesis when using a Kruskal Wallis test ... 46
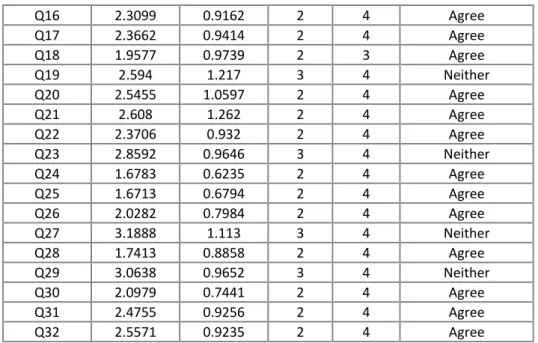
Table 3.13: median scores and interpretation for all other questions not previously examined ... 47
Table 3.14: median scores and interpretation for Q1 ... 47
Table 3.15: median scores and interpretation for Q2 ... 48
Table 3.16: median scores and interpretation for Q3 ... 48
Table 3.17: median scores and interpretation for Q4 ... 48
Table 3.18: median scores and interpretation for Q6 ... 49
Table 3.19: median scores and interpretation for Q8 ... 49
Table 3.20: median scores and interpretation for Q9 ... 50
Table 3.21: median scores and interpretation for Q16 ... 50
Table 3.22: median scores and interpretation for Q17 ... 51
Table 3.23: median scores and interpretation for Q18 ... 51
Table 3.24: median scores and interpretation for Q23 ... 51
Table 3.25: median scores and interpretation for Q24 ... 52
Table 3.26: median scores and interpretation for Q25 ... 52
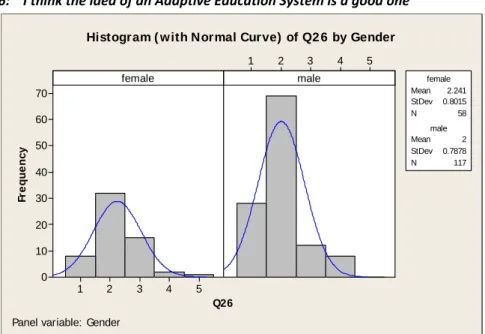
Table 3.27: median scores and interpretation for Q26 ... 53
Table 3.28: median scores and interpretation for Q27 ... 53
Table 3.29: median scores and interpretation for Q28 ... 53
Table 3.30: median scores and interpretation for Q29 ... 54
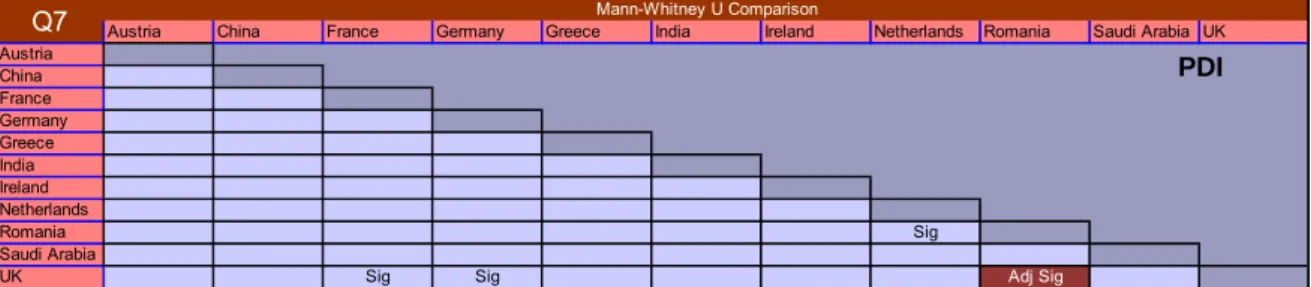
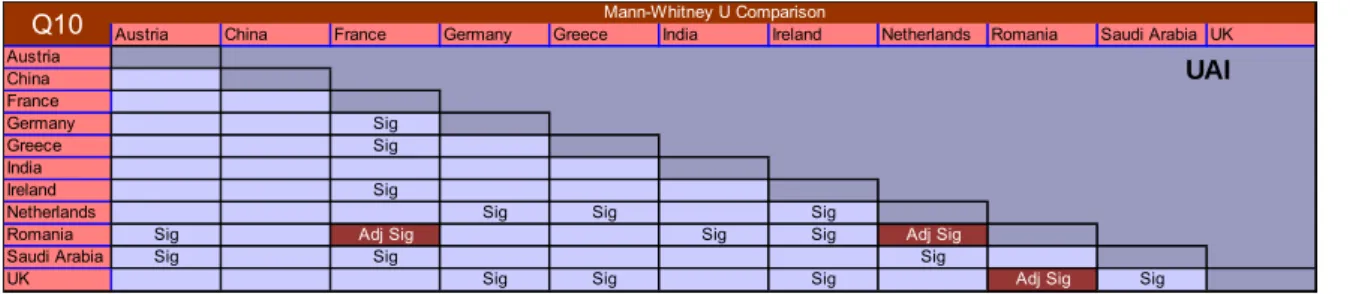
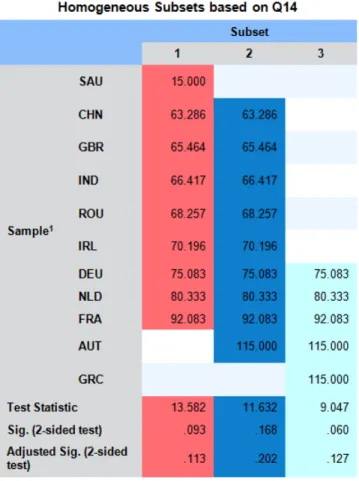
Table 3.32: median scores and interpretation for Q31 ... 55 Table 3.33: median scores and interpretation for Q32 ... 55 Table 3.34: the median scores and interpretation for Q5 ... 56 Table 3.35: significant differences between countries for Q5, as determined by a Mann Whitney U pairwise comparison (p<0.05){Sig = non adjusted values, Adj Sig = Bonferroni corrected) ... 56 Table 3.36: results of the homogenous subset comparison analysis for Q5 (p<0.05) ... 57 Table 3.37: median scores and interpretation for Q7 ... 58 Table 3.38: significant differences between countries for Q7, as determined by a Mann Whitney U pairwise comparison (p<0.05){Sig = non adjusted values, Adj Sig = Bonferroni corrected) ... 58 Table 3.39: results of the homogenous subset comparison analysis for Q7 (p<0.05) ... 59 Table 3.40: the median scores and interpretation for Q10 ... 59 Table 3.41: significant differences between countries for Q10, as determined by a Mann Whitney U pairwise comparison (p<0.05){Sig = non adjusted values, Adj Sig = Bonferroni corrected) ... 60 Table 3.42: results of the homogenous subset comparison analysis for Q10 (p<0.05) ... 60 Table 3.43: the median scores and interpretation for Q11 ... 61 Table 3.44: significant differences between countries for Q11, as determined by a Mann Whitney U pairwise comparison (p<0.05){Sig = non adjusted values, Adj Sig = Bonferroni corrected) ... 61 Table 3.45: results of the homogenous subset comparison analysis for Q11 (p<0.05) ... 62 Table 3.46: the median scores and interpretation for Q12 ... 62 Table 3.47: significant differences between countries for Q12, as determined by a Mann Whitney U pairwise comparison (p<0.05){Sig = non adjusted values, Adj Sig = Bonferroni corrected) ... 63 Table 3.48: results of the homogenous subset comparison analysis for Q12 (p<0.05) ... 63 Table 3.49: the median scores and interpretation for Q13 ... 64 Table 3.50: significant differences between countries for Q13, as determined by a Mann Whitney U pairwise comparison (p<0.05){Sig = non adjusted values, Adj Sig = Bonferroni corrected) ... 64 Table 3.51: results of the homogenous subset comparison analysis for Q13 (p<0.05) ... 65 Table 3.52: the median scores and interpretation for Q14 ... 66 Table 3.53: significant differences between countries for Q14, as determined by a Mann Whitney U pairwise comparison (p<0.05){Sig = non adjusted values, Adj Sig = Bonferroni corrected) ... 66 Table 3.54: results of the homogenous subset comparison analysis for Q14 (p<0.05) ... 67 Table 3.55: the median scores and interpretation for Q15 ... 67 Table 3.56: significant differences between countries for Q15, as determined by a Mann Whitney U pairwise comparison (p<0.05){Sig = non adjusted values, Adj Sig = Bonferroni corrected) ... 68 Table 3.57: results of the homogenous subset comparison analysis for Q15 (p<0.05) ... 68 Table 3.58: median scores and interpretation for Q19 ... 69 Table 3.59: significant differences between countries for Q19, as determined by a Mann Whitney U pairwise comparison (p<0.05){Sig = non adjusted values, Adj Sig = Bonferroni corrected) ... 69 Table 3.60: results of the homogenous subset comparison analysis for Q19 (p<0.05) ... 70 Table 3.61: scores and interpretation for home students vs. those who have studied in more than one country, for Q20 ... 71 Table 3.62: median scores and interpretation for Q20 ... 71 Table 3.63: significant differences between countries for Q20, as determined by a Mann Whitney U pairwise comparison (p<0.05){Sig = non adjusted values, Adj Sig = Bonferroni corrected) ... 71 Table 3.64: results of the homogenous subset comparison analysis for Q20 (p<0.05) ... 72 Table 3.65: median scores and interpretation for Q21 ... 73 Table 3.66: significant differences between countries for Q21, as determined by a Mann Whitney U pairwise comparison (p<0.05){Sig = non adjusted values, Adj Sig = Bonferroni corrected) ... 73 Table 3.67: results of the homogenous subset comparison analysis for Q21 (p<0.05) ... 73
Table 3.68: median scores and interpretation for Q22 ... 74
Table 3.69: significant differences between countries for Q22, as determined by a Mann Whitney U pairwise comparison (p<0.05){Sig = non adjusted values, Adj Sig = Bonferroni corrected) ... 74
Table 3.70: results of the homogenous subset comparison analysis for Q22 (p<0.05) ... 75
Table 3.71: gender groups (and ‘n’ values) used when examining Q19 32 ... 75
Table 3.72: age groups (and ‘n’ values) used when examining Q19 32 ... 76
Table 3.73: median scores and interpretation for the effect of age in answering Q22 ... 76
Table 3.74: median scores and interpretation for the effect of age in answering Q25 ... 77
Table 3.75: median scores and interpretation for the effect of age in answering Q29 ... 78
Table 3.76: the collective question results interpretations for the CAE results investigating the PDI, UAI, IDV, MAS and LTO indices ... 81
Table 3.77: showing the CAE question scores and the p value (‘Wilcoxon’ column) result from comparing these with the PDI score ... 82
Table 3.78: showing the CAE question scores and the p value (‘Wilcoxon’ column) result from comparing these with the UAI score ... 82
Table 3.79: showing the CAE question scores and the p value (‘Wilcoxon’ column) result from comparing these with the IDV score ... 83
Table 3.80: showing the CAE question scores and the p value (Wilcoxon’ column) result from comparing these with the MAS score ... 83
Table 3.81: showing the CAE question scores and the p value (‘Wilcoxon’ column) result from comparing these with the LTO score ... 84
Table 3.82: the collective question results interpretations for the CAE results for the CEI and AEI indices ... 85
Table 3.83: showing the CAE question scores and the final CEI score ... 85
Table 3.84: showing the CAE question scores and the final AEI score ... 85
Table 3.85: summarises the results of the Hofstede vs. CAE results comparison. ‘Y’ indicates that the two results agree and ‘N’ that there is a significant difference between the two. ... 86
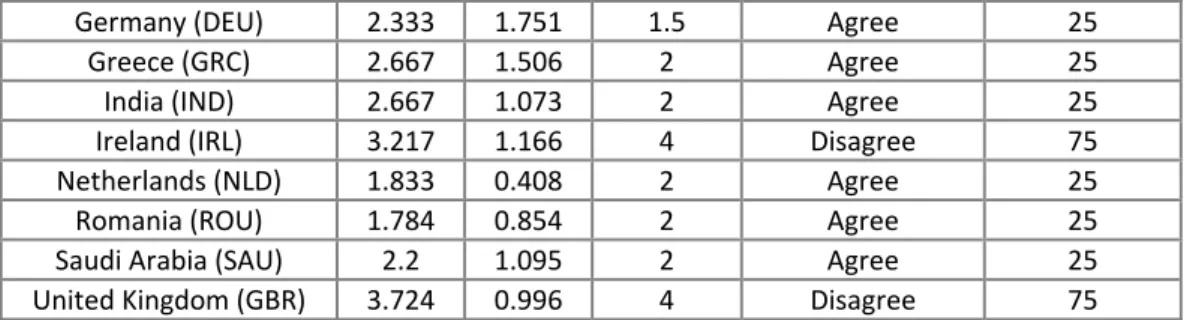
Table 4.1: summary of the CAE results for the eleven countries under investigation. incon = inconclusive value. This data is derived from the findings of Chapter 3. ... 100
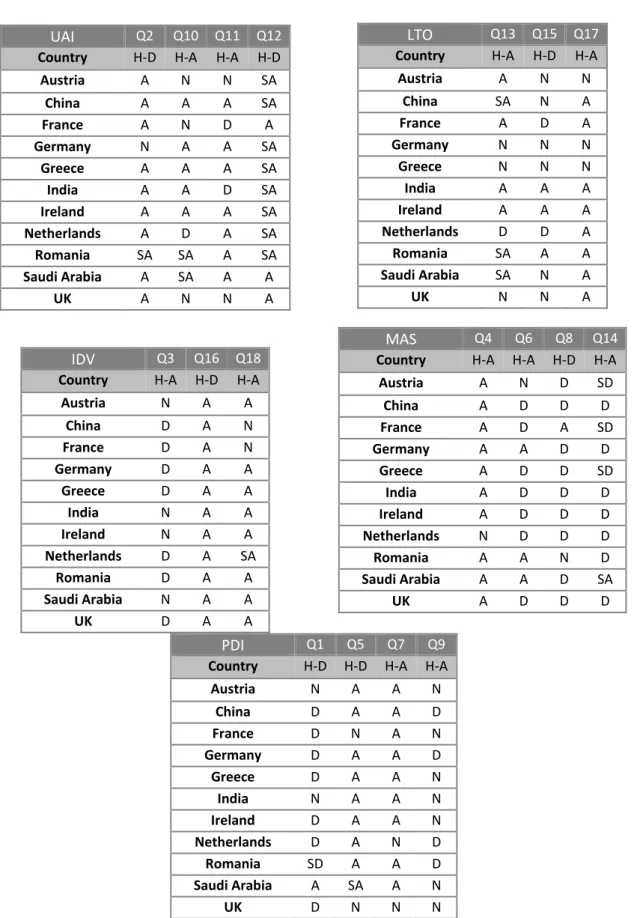
Table 4.2: The CAE L instance descriptions for the eleven countries under investigation. ... 111
Table 5.1: detailing the country identification information for each of the CAE countries ... 120
Table 6.1: this table lists the countries chosen to take part in this evaluation and the number of student responses. ... 139
Table 6.2: shows which countries CAE L stereotypes were used to create the questionnaires for each country taking part. ... 141
Table 6.3: shows the responses from the evaluation questionnaire respondents. ... 144
Table 6.4: showing the results of the analysis for each country’s evaluation responses ... 145
Table 6.5: showing the results of the analysis for each question’s evaluation responses ... 146
Table 7.1: the numbers of respondents for the two types of interfaces (note: ‘country refers to the interface used not the nationality of the respondant – all of whom were Romanian) ... 155
Table 7.2: showing the results of the Kruskal Wallis analysis for each question’s evaluation responses ... 155
Table 7.3: the results for the binary questions from the structured interviews (in the ‘Match’ column ‘Y’ indicates an exact match with the expected response, and ‘N’ indicates a complete mis match, those questions with a mix of match/mis match responses have no value here). ... 158
Table 8.1: the numbers of respondents (given by ‘n’) from the two questionnaire language versions 164 Table 8.2: the CAE questions and the ‘p’ value (significance) determined from the null hypothesis when using a one way ANOVA test on the Chinese respondents using the English and Chinese language questionnaires. ... 167
Table 8.3: median scores and interpretation for Q21 ... 167
Table 8.4: median scores and interpretation for Q21 ... 168
Table 8.5: the numbers of respondents (given by ‘n’) from the two questionnaire language versions 169 Table 8.6: the CAE questions and the ‘p’ value (significance) determined from the null hypothesis when using a one way ANOVA test on the Indian respondents using the Hindi and English language questionnaires. ... 171
Table 8.7: median scores and interpretation for Q2 ... 171
Table 8.8: median scores and interpretation for Q24 ... 172
Table 8.9: median scores and interpretation for Q32 ... 173
Table 9.1: the interpretation of Hofstede’s indices for use in the CAE ontologies ... 177
Table 9.2: the CAE ontology for Mexico, with the insertion of the estimated CEI setting ... 177
Table 9.3: the CAE ontology for Mexico, with the insertion of the unconfirmed AEI setting ... 178
LIST OF ABBREVIATIONS AND ACRONYMS
Acronym Expansion
AEH Adaptive Educational Hypermedia AEI Adaptive Education Index
AH Adaptive Hypermedia
AHS Adaptive Hypermedia Systems AI Artificial Intelligence
ANOVA ANalysis Of VAriance
API Application Programming Interface CAE Cultural Artefacts in Education
CAE F Cultural Artefacts in Education Full scale CAEI Cultural Artefacts in Education Indices CAE L Cultural Artefacts in Education Lightweight CAF Common Adaptation Format
CATS Culturally Aware Tutoring Systems CEI Cultural Education Index
CSCL Computer Supported Collaborative Learning CSCW Computer Supported Collaborative Work DAML S DARPA Agent Markup Language Services
DB DataBase
DC Dublin Core
EH Educational Hypermedia
FTP File Transfer Protocol GAT GRAPPLE Authoring Tools
GUMF GRAPPLE User Model Framework HCI Human Computer Interaction HTML HyperText Markup Language HTTP HyperText Transfer Protocol
ICT Information and Communication Technologies IDV Collectivism vs. individualism index
IMS Instructional Management Systems IMS QTI IMS Question & Test Interoperability
Specification
IT Information Technology
ITS Intelligent Tutoring Systems
K W Kruskal Wallis one way analysis of variance by ranks
LAG Layer adaptation model
LAOS Layered WWW AHS Authoring Model LMS Learning Management System
LTO Long vs. short term orientation index MAS Femininity vs. masculinity index MCP Multiple comparison procedures
NRS Next Recommended Step OWL Web Ontology Language
PC Personal Computer
PDI Power Distance Index
RDF Resource Description Framework
RDFS RDF Schema
SCORM Sharable Content Object Reference Model SGML Standard Generalized Markup Language SOAP Simple Object Access Protocol
SPARQL SPARQL Protocol and RDF Query Language SQL Structured Query Language
UAI Uncertainty avoidance index UDDI Universal Description, Discovery and
Integration
UM User Model
URI Uniform Resource Identifier URL Uniform Resource Locator UTF Unicode Transcription Factor VOIP Voice Over Internet Protocol VSM Values Survey Module
WSDL Web Services Description Language WWW World Wide Web
XHTML eXtensible Hypertext Markup Language XML eXtensible Markup Language
XSD Xschema Document
CHAPTER
1:
INTRODUCTION
1 INTRODUCTION
1.1 MOTIVATION
The main motivation for this research lies in the interface between ‘Education’, ‘Information and Communication Technologies’ and ‘Culture’. With the globalization of education through the use of ICT (Information and Communication Technologies), the creation of cross border online courses and lessons has taken vast leaps forward. However, the cultural background of a student population is often overlooked when authors create these online lessons, which can lead to an unintentional form of cultural imperialism. Students from around the world find themselves needing to adapt themselves, rather than having the lesson adapt to them.
The work presented in this thesis addresses this inequitable balance between the nature of the learning content and the student.
Figure 1.1: diagram showing the three major domains investigated within this thesis, along with their traditional cross over sub domains.
Traditionally (i.e., over the last 20 years) the interface between these domains can be categorised as seen in Figure 1.1.
eLearning: with the rise of the new technologies broadly categorised as ‘ICT’, the teachers and researchers within education were some of the first to investigate how these could be used to enhance the teaching and learning processes. This use of new technologies, of course, goes back much further than modern ICT (e.g. the Hyalotype [Websters, 2011]) but has taken on a much greater dominance and penetration into the educational domain in recent years. The resultant field of ‘eLearning’ includes a great number of sub disciplines, such as Computer Aided Learning, Computer Based Training, Computer Aided Assessment, mobile learning, virtual learning, etc… Of these, the research presented in this thesis focuses in (but could also be applied beyond) the area of Computer Aided Learning.
Language Learning: the most common cross domain interaction between ‘Education’ and ‘Culture’ is that of language learning. Culture is often used to enhance the teaching of a given language, e.g. through the use of audio tapes, videos, exchange trips and meeting native language speakers. However, the research presented in this thesis takes a different approach; rather than using culture as an aid to learn another language the goal here is to determine what effect a student’s culture may have on their learning.
Cultural Heritage Preservation: in recent years, it has become more popular for ‘ICT’ to be used as a means to preserve cultural heritage. The world’s growing population, increased rate of pollution and environmental destruction has amplified the rate of loss of cultural heritage
sites and artefacts. In an attempt to save these for future generations, technology is being used to not only record them, but also to make them more available to the population at large. The ‘X’ identified in Figure 1.1 marks the location of the research described within this thesis. In targeting this cross disciplinary focus, the research question addressed in this thesis is:
With the rapid spread of technologies whose development has been rooted in Western (US English) culture, how can the globalisation of education through eLearning be best brought back into a more cross cultural balance, so that learners receive appropriately personalised online lessons?
It is this question that motivates the research as outlined in this thesis. By bringing a more balanced and personal approach to eLearning through the application of cultural variables to a user model, the learner should receive a lesson that minimises (ideally even eliminates) cultural bias.
Imagine the following user case:
Sha Menghai (Chinese: ) is a male Chinese literature student from Ningbo, accepted by a British university for a distance learning course. He can log into the system (which is prepared in English for a variety of students) and access the English materials. Whilst his English comprehension is adequate, his previous exposure to British culture is however almost non existent. He is therefore surprised when working in a group that his peers often express their opinions in a loud and argumentative manner, even disagreeing with the teacher. Menghai’s own upbringing has encouraged him to work towards group goals by calmly acknowledging disagreement and working with patience towards an understanding or compromise. As a result, his opinion is often lost in any open forum, due to his reticence to vocally disagree with his peers in a similar manner. He feels isolated and misunderstood, and his learning motivation drops.
Or in an example more directly addressed within this thesis:
Marcela Dragomir, is a female Romanian engineering student from Bucharest accepted into a distance learning course from an Irish university. Marcela is technically accomplished but is used to a high degree of support from her course tutor as well as a significant degree of ‘Help’ being available from the Learning management Systems that she has used in the past. However she is unused to the Irish educational cultural focus of being left to find her own way through the course materials. As a result, unlike her Irish colleagues, getting lost or diverted in her coursework undermines her confidence in her ability, which could potentially have a significantly detrimental effect on her final course mark.
Here are just two examples of how a student’s learning efficiency can be reduced by being placed in non ideal circumstances. Cultural barriers are only one aspect of cross cultural eLearning that may happen to affect the student’s final grade.
In adapting to a student’s cultural background, it should be possible to reduce these barriers and increase learning efficiency and the learner’s satisfaction within the adapted course.
The overall motivation and goals behind this research involve many other research fields, these goals are introduced in Section 1.2 below.
1.2 RESEARCH GOALS
The research presented in this thesis focuses on the problem of bringing the eLearning paradigm to a multicultural classroom. With the advent of the World Wide Web (WWW), the spread of internet access and the commoditization of learning and lifelong learning, the modern classroom is dramatically different from the traditional one and these factors have yet to be fully integrated together. There are many possibilities for research to advance our understanding of how the classroom of the future will look.
The research presented here addresses one aspect of this confusion of variables, namely if one is to have a classroom where each learner is presented with the materials that are best suited to their
learning preferences and styles, how best should these materials be created and presented to reflect the learners’ cultural background?
To this end, the research presented in this thesis covers many high level aims which generate a specific list of target objectives. Those research aims and objectives are described here.
1.2.1 AIMS
(1) Investigate culture based personalisation techniques for education. In any research into adaptive eLearning there will be feedback into the overall field of education and ICT (Information and Communication Technologies) theory and praxis. In this thesis this feedback will be of the nature of how best to use ICT in global education taking into account the learner’s cultural background. These findings will be applicable to any level of education where there is a mix of cultures (be this amongst the students or the teachers).
An example can be observed in most distance learning classrooms where there is a growing mix of students from many different cultural backgrounds [HESA, 2005] (or even many traditional physically located classrooms; indeed the growing penetration of eLearning into traditional classrooms is blurring the distinction between the two).
Therefore there is a distinct and growing need for research into how a student’s cultural background can and should be used in the learning process.
(2) Identify the effect that culture has on a student’s education. In parallel to the growth of eLearning, the internationalisation of the student body is now firmly established at all levels of education. Previous research has shown that a student’s home culture, particularly language, can interfere in an overseas learning environment [Xu, 1991]. These factors have been shown to affect performance at the Higher Education level [Morrison et al, 2005]. Therefore culture must be considered as an important user attribute in any comprehensive adaptive system. However, before adopting this new factor, several other research aims need to be addressed.
(3) Create a test system that will allow for interface personalisation of educational materials according to the cultural stereotypes. Once the user model variables defining cultural aspects have been identified, then an AEH system interface must either be created or modified, so that content can be delivered to a student that reflects this new layer of adaptation.
(4) Evaluation of this new layer of adaptation and personalisation will be undertaken. It is vital that students are able to access and learn using the culturally sensitive AEH system described above. Therefore, the research in this thesis will also undertake an initial evaluation into how a culturally adapted interface is perceived by the students and make recommendations for the future.
(5) Investigate if there is a bias in the cultural questionnaire due to language. Specifically if there is a bias if a student’s first language is not English. Hence, this research investigates if there is a bias in the response to the CAE questionnaire when it is administered in English to non native English speakers, compared to students from the same culture, who answer the same questionnaire administered instead in their mother tongue?
The next section 1.2.2 will detail the objectives identified within these areas in more detail.
1.2.2 OBJECTIVES
Using the more generic research aims outlined above, the specific objectives of the research presented in this thesis are listed here.
1. Investigate the current state of the art in eLearning, specifically focusing on adaptive systems. This is done in order to establish what mechanisms are applicable to cultural adaptation.
2. Investigate the current state of the art of cultural learning, in this case focussing on how a student’s culture has been used to influence the delivery of a lesson.
3. Examine extant cultural indices for applicability in the educational domain. What previous research exists beyond the domain of education and how best can this be used in this research?
4. Investigate cultural groupings and effects through user examination. To investigate this the research presented here involved the creation of a questionnaire to gather the responses from students as to how their cultural background may affect their (e)learning.
a. Are the extant cultural indices able to be mapped to the domain of education (this is required, as those indices will not have been created using the student population as a source)?
b. Do students desire to be taught in the manner that they have been brought up with? Is there a cultural bias to education? Do students recognize this? Would they desire a different cultural bias to their own?
c. Is a student’s educational cultural bias resistant to change?
d. Is there a cultural bias in the acceptance of openly acknowledged Adaptive Educational systems? For example: is there a cultural bias in the desire for AEH – do some cultures accept the teacher’s viewpoint, no matter how it is presented, and would therefore resent it being ‘changed’? Can this adaptation be hidden and therefore accepted? Do students want to conform or not?
5. Analyse the questionnaire responses and determine a list of cultural stereotypes (through the creation of a cultural modelling framework / ontology). The final goal of this aspect of the research is a list of user variables that can be used to define a student’s cultural stereotype that can be used as a template for further adaptation in AEH systems.
6. Create or modify an AEH system interface so that the cultural templates can be used to create a new layer of adaptation that will personalise the delivery of educational content to a learner’s cultural background.
7. Evaluate the usage of this adaptive cultural interface with learners. Use the findings of this evaluation to create a series of recommendations for future work.
8. Perform a small scale focused evaluation using qualitative techniques (such as structured interviews) to back up the findings presented in previous chapters.
9. Create one or two questionnaires based on the original English language version but written and delivered in the mother tongue of the respondents from the first version. Specifically:
a. Identify one or two countries from the respondents of the first English questionnaire.
b. Create questionnaires for each of these countries in their native language.
c. Collate questionnaire responses and examine them against the findings of the English version of the questionnaire.
10. Discuss the results of the thesis and draw conclusions, including addressing future research efforts.
In section 1.3, the research directions within this thesis are placed into their overall background.
1.2.3 ASSUMPTIONS
Over the course of the research presented here in this thesis several assumptions are made and discussed. Here they are explicitly stated:
1) In any study of 'culture' the definition of culture must be made explicit, in the case of this thesis that definition is focused in the domain of education, hence The CAE definition of ‘educational culture’ is:
Educational Culture should be regarded as the set of distinctive intellectual features of society applied at the national level, and that it encompasses, in addition to traditional educational values, a learner’s aims, goals, background knowledge, social preferences, and their location on Hofstede’s VSM Indices.
This is a more restrictive definition than normally used in cultural studies; with the alterations here such as to focus on the intellectual, academic and educational aspects of society, specifically those of the learner. To this end the most notable addition is the inclusion of Hofstede’s VSM indices, as these indices play a major role in the creation of the CAE learner model. This definition, as well as a more generic definition of 'culture' is included and expanded on in Chapter 2.
2) As the CAE questionnaire was written and delivered in English, that there is no significant difference between students who could read English and those who could not. For example an Indian student’s responses would be the same if the questionnaire is written in English or Hindi. This assumption will be tested in Chapter 8.
3) The focus of this study is on learners from Higher Education, this was done for purely pragmatic reasons, in that there was easy and ready access to these students over the course of this research.
1.3 BACKGROUND
1.3.1 21S T CENTURY EDUCATION
Before describing the state of eLearning in the 21st Century it is useful to remember that not all educational advances have occurred through technological means. The methodologies used by pedagogues have changed (albeit at a slower pace) throughout the last two millennia, until one reaches the state that is recognised as ‘modern’ education. It is important to place the current changes in education into an overall context, as otherwise learning in the 21st century risks losing sight of the fundamentals in the rush to use the next technological advance. It is only by being aware of the past that it is possible to move towards a better future.
1.3.1.1 TRADITIONAL EDUCATION
In many countries traditional education can be split into two clearly distinct groups, that of the ‘school’ and that of the ‘university’. These can be known by different names (such as ‘academy’ or ‘college’), but are normally distinguished by the manner of student involvement. In a school, the student is young (normally a child) and is often forced (most commonly through legal means) to attend, whereas with a university the student (normally an adult) voluntarily attends. This leads to differing mind sets between the two types of institutions. Such a distinction is not universal (for example the US system may use the term ‘school’ to apply to education at all levels, including universities) but will be used throughout this thesis. The following section gives a short history of the creation and advancement of the educational systems from their inception until the late 1980s, to give context to the pedagogical procedures in use before the wide scale uptake of eLearning in the 1990s.
1.3.1.2 SCHOOLS
The term ‘school’ (in its various translations) can be connected to many ancient institutions (such as Plato’s Academy in Greece [University of St. Andrews, 2004], the Gurukul [Gurukul, 2011] in India and the Sh yuàn [Academies, 2011] in China); however these are generally what one would now consider establishments for higher education – i.e. ‘universities’.
The earliest modern schools were those established by the Byzantine Empire, and they created a primary level of education in 425 CE, generally for those children destined to join the military or civil service. These were followed by the Islamic ‘Maktab’ (Arabic ) [maktab, 2012] which was
created as a means of primary education1 around the 900s CE and then by the European schools (starting with The King's School, at Canterbury in the UK (established 597 CE), as it has been teaching students since its inception as an abbey by St Augustine).
What would now be considered the modern revival of the education system began in the 19th century, as it was closely tied to the idea of compulsory education. With modern civilisations coming to realise that it is economically profitable for each citizen to be able to communicate with or receive communications from others through the ability to read and write. To this end (and due to pressure from competing educational efforts, such as the Lancastrian System [Constitution Society, 2011]) governments started to establish state paid for and run schools that aimed to educate children. The form that teaching took in these schools, however, remained similar to those established earlier, with emphasis on didactic information exchange in the subjects of grammar, numeracy, literacy and writing. Changes in the methods of school education did not occur en masse until the 20th century. For example, John Dewey’s (early 20th century) work in experiential education advocated the teaching of theory and practice at the same time (‘learning by doing’ often an important aspect of any (e)Learning systems).
The study of teaching, learning and education have all progressed rapidly towards the end of the 20th century, with the outcome that the cognitive and meta cognitive models used by teachers and children are understood to a far greater degree. This has had a direct effect on modern teaching techniques.
The research presented in this thesis could help guide the future development of the school classroom as it moves into a more multicultural age. As country populations grow more diverse (especially in western countries, often due to their ex colonial nature) so do the populations within their schoolrooms. It is only by being aware of these changes and how cultures have come together in the past that it will be possible to correctly and efficiently bring eLearning into the classroom.
1.3.1.3 UNIVERSITIES
Similar to the history of education at the level of the school, the history of adult or higher education is a varied one. Once again however knowledge of the past is important in determining the direction of education in the future, especially as university education has often been at the forefront of technological uptake.
The earliest educational establishments that could be considered universities were the Platonic Academy [University of St. Andrews, 2004] (c387 BCE2) and the Taixue (Chinese: )(established in 3CE3), with the Nanjing University (Traditional Chinese: ), which has been teaching students (although not awarding degrees) since 258 CE, the oldest continually running ‘university’ in the world. Also worth mentioning is the ancient Indian university of Nalanda (Hindi: न लद) established 427 CE. This extremely large university accommodated up to 10,000 students and 2,000 teachers. The curriculum covered all aspects of learning (subjects both religious and secular) and attracted students from as far away as Japan, resulting in a very large multicultural student population, more akin to a modern university.
The manner of teaching (specifically, how students interact with teachers) in these universities can be considered to consist of three strands:
Didactic: the teacher speaks and the students listen (e.g. lectures).
1 It is interesting to note that one of the foremost Islamic philosophers of the time (11th century), Ibn
S n (Arabic: ), wrote in his book “The Role of the Teacher in the Training and Upbringing of Children” that children learn best in classes rather than one on one with tutors, due to factors such as competition, emulation, discussion and debates, showing that fundamentally similar teaching issues and structures seem to have been a constant in education.
2
Before Common Era – a global and secular version of BC (Before Christ)
3