Journal of Robotics and Mechanical Engineering Research
The NC Machine Tool Roundness Error Test Method Based on EIB741
Su Yilin, Hou Xuyan*, Zhang Kailiang, Zhang Kaidi, Liang Ping and Deng Zongquan
Harbin Institute of Technology
J Robot Mech Eng Resr 1(3). Page | 22
*Corresponding author: Dr. Hou Xuyan, Lecturer, School of Mechatronics Engineering, Harbin Institute of Technology, Room 427, Building 2F, Yi-kuang Street, Nangang District, Harbin, Heilongjiang, China, Tel: +86-0451-86413857, Fax: +86-0451-86413857; Email: [email protected]
Article Type: Research, Submission Date: 01 January 2016, Accepted Date: 21 January 2016, Published Date: 08 February 2016.
Citation: Su Yilin, Hou Xuyan, Zhang Kailiang, Zhang Kaidi, Liang Ping and Deng Zongquan (2016) The NC Machine Tool Roundness Error Test Method Based on EIB741. J Robot Mech Eng Resr 1(3): 22-27.
Copyright: © 2016Su Yilin, Hou Xuyan, et al. This is an open-access article distributed under the terms of the Creative Commons Attribution License, which permits unrestricted use, distribution, and reproduction in any medium, provided the original author and source are credited.
Vol: 1, Issue: 3
Abstract
In order to achieve the detection of the machine tool roundness error. Using KGM grading encoder to obtain the measurement signal. Choosing signal acquisition card EIB741 to collect sinusoidal incremental signals from KGM grading encoder. Using TCP/IP communication deal to connect the acquisition card with personal computer. The encoder supporting software have license that it can only install on one computer and its operation interface is unmodifiable in foreign language that is hard for workers to use. Labview software was used to develop programs for signal processing on PC. The roundness error of acquisition and analysis system based on virtual instrument was studied. The program based on the roundness error’s real time acquisition, storage and amendment and is designed. The measure and assessment method of the machine tool roundness error is proved valid through the experiment.
Keywords: Roundness error, Acquisition card, Labview, Virtual instrument.
Introduction
The detection of the machine tool’s error has great relationship with the accuracy of error mode, and error of machine tool will affect result of error compensation of machine tool [1-2]. Error measurement is not only the foundation of machine error detection, but also an important technology of reacting machine accuracy and error compensation. Therefore, Experts and scholars from home and abroad have made a lot of effort on studying lots of methods of measurement error. Roundness error measurement is one of the most common mechanical measurements. The commonly small displacement measurement method is using sensors to detect small displacement, then converted into analog signal and sent to the data acquisition card. Powerful analysis function of virtual instruments is in base of software [3-6]. So, we can establish a set of roundness detection and analysis system using virtual instruments to measure roundness error, then achieved data acquisition, data processing and error display functions.
Data acquisition system hardware and theory
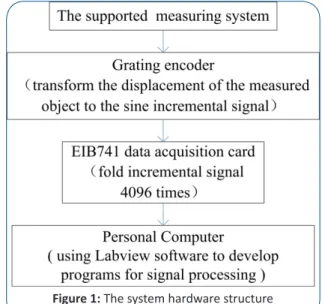
The virtual instrument of the roundness error measure produces signal by using encoder. It construct with signal acquisition card EIB741 and personal computer, shown as Figure 1.
Figure 1: The system hardware structure
The composition and principle of grating encoder
The high plane grating encoder KGM182 which is used to detect the machine tool’s two-dimension motion trail precision is a kind of non-contact optics measure instrument. It is produced by Germany Heidenhain Company [7-9]. It is shown in Figure 2.
The scale grating and indicative grating can be called as long grating and short grating. In the test, two gratings overlap with each other in parallel. Keep the clearance from 0.01mm to 0.1mm. The long grating rotating a tiny angle θ relative the short grating in its own plane. When light hitting the grating in parallel it causes the effect of the light transmission and diffraction. In the vertical direction with the angle bisector of two grating. There will be thick stripe of alternating light and shade, equal interval. We call it moire fringe. As shown in Figure 4.
Moire fringe have displacement amplification effects. The relation between the space of moire fringe B and the stripe angle of two grating θ is
By the above formula, as the value of θ is too small, the space of moire fringe B is much bigger than W.
Two grating move a lattice spacing W, then the moire fringe moving a fringe spacing B. So the light on a fixed point of the grating change the light intensity for once. The photoelectric element can acquire the number of moire fringe stripe, then we will know how many lattice that the grating moved. Thus to know
Figure 3: The composition of grating encoder
Figure 4: Moire Fringe
element, we can determine the grating moving direction. The voltage is
Amplify the voltage signal and the signal transform to square wave, then converted to pulse signal. Finally using digital form display physical displacement. The displacement is equal to the product of pulse and lattice spacing. The resolution measure is equal to the lattice spacing.
To the mutual vertical two-axis on the plane of the machine tool, KGM outputs two 90 degrees phase difference and 4µm
Figure 5: The electrical signals of light intensity
period signal, measuring signal sent to the personal computer for subsequent processing. EIB741 acquisition card is used to connect KGM and the computer. EIB741 can subdivide the sinusoidal signal for 4096 times. So every axis’s measurement step distance is about 1nm.
Data acquisition card
The EIB 741 is an external interface box for precise position measurement. It is ideal for inspection stations and multipoint inspection apparatuses as well as for mobile data acquisition, such as in machine inspection and calibration.
The EIB 741 is ideal for applications requiring high-resolution encoder signals and fast data logging. Ethernet transmission also enables you to use switches or hubs for connecting more than one EIB 741. A maximum of four HEIDENHAIN encoders, either with sinusoidal incremental signals (1 VPP) or with EnDat interfaces (EnDat 2.1 and EnDat 2.2) can be connected to the EIB 741[10-11]. The EIB 741 subdivides the periods of the incremental signals 4096-fold for measured-value generation. The deviations within one signal period are automatically reduced by adjusting the sinusoidal incremental signals (signal compensation). The integrated measured-value memory enables the EIB 741 to save up to 250,000 measured values per axis in “recording mode.” (1)
J Robot Mech Eng Resr 1(3). Page | 24 Internal or external triggers can be used for axis-specific storage
of the measured values. A standard Ethernet interface using TCP or UDP communication is available for data output [12-14]. This permits direct connection to a PC, laptop or industrial PC. The standard Ethernet based on TCP/IP communication deal is used to output data. Therefore it can contact the laptop via netting cable.
Roundness error data processing algorithm
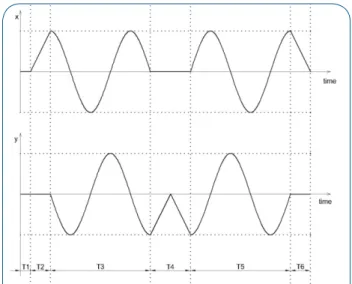
KGM encoder outputs two sinusoidal signal whose directions are different and signal cycle lengths both are 4µm. EIB741 data acquisition card can subdivide one signal cycle length for 4096 times . Therefore the unit length of the position coordinates captured by the computer directly is: L =4μm/4096 =1/1024μm. While measuring the machine tool’s circular arc interpolation precision, the motion trail of the machine tool’s x axis and y axis is shown in Figure 7. The motion trail starts from circle center, moves distance R along x axis, and returns to the circle center along y axis after moving 450 degrees in clockwise direction
Figure 6: Basic circuit diagram of the EIB
Figure 7: The x axis and y axis trajectory curve
along R radius circle. And then it moves distance R along the negative axis y, and returns to the circle center along x axis after moving 450 degrees in anticlockwise direction along R radius circle.
Because the center of the machine tool motion arc isn’t in the absolute origin pf coordinates, so we need acquisition the actual circle center firstly. Even though the machine tool doesn’t operate, the position coordinates captured by the data acquisition card are fluctuated. Therefore the machine tool stay for T1 to obtain the mean coordinate O (a,b) of the circle center.
∑
==
n i ix
n
a
11
(3)∑
==
n i iy
n
b
11
(4) Where xi and yi are the actual coordinates of axis x and axis y, n is the number of the acquired center coordinates.Starting from time T2, we can obtain new position coordinates by subtracting the circle center coordinates from actual acquired position coordinates. This can guarantee that the circle center of circle trail is in the origin of the coordinate.
1
1
'
i i n i ix
x
x
n
== −
∑
(5) 11
'
i i n i iy
y
y
n
==
−
∑
(6) While measuring, the encoder can acquire all the points of the machine tool motion trail. However error analysis just needs one forward circle and one reverse circle. This is shown in Figure 8. The time θi= 330° is chosen as the start point and the end point of signal acquiring and storing. Namely we start to acquire the positive arc trail while y'i≤-R/2 , and we terminate the acquiring while y'i≤-R/2 again. And then the arc moves along the negativeFigure 8: Two set of trajectory curve
direction. At this time we start to acquire the negative arc trail while y'i>-R/2 , and we terminate the acquiring while y'i>-R/2 again.
At last, achieve the function of adjusting the acquiring arc trail. The position coordinates set before and after adjusted are shown in Figure 9 and Figure 10 respectively.
In order to see the micrometer-level error of the centimeter-level circle visually, we should magnify the error. Firstly transform the position change relation of x'i and y'i in the rectangular coordinate system into the change relation of phase position θi and amplitude Ri. Obtain the roundness error by subtracting the radius R. The error level can be seen by magnifying the error
Figure 9: The unadjusted coordinates collection
Software programming base on Labview
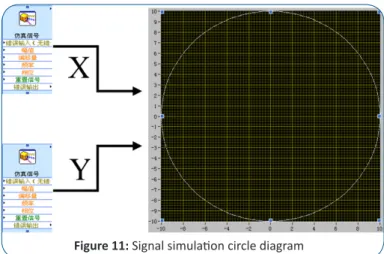
As shown in Figure 11 is the simulation signal generator. Using two signal generator with same frequency and amplitude, the phase difference is 90 degrees. The two signals are corresponding to the X axis and Y axis in the horizontal plane. Finally, the simulation data of circular trajectory was displayed.
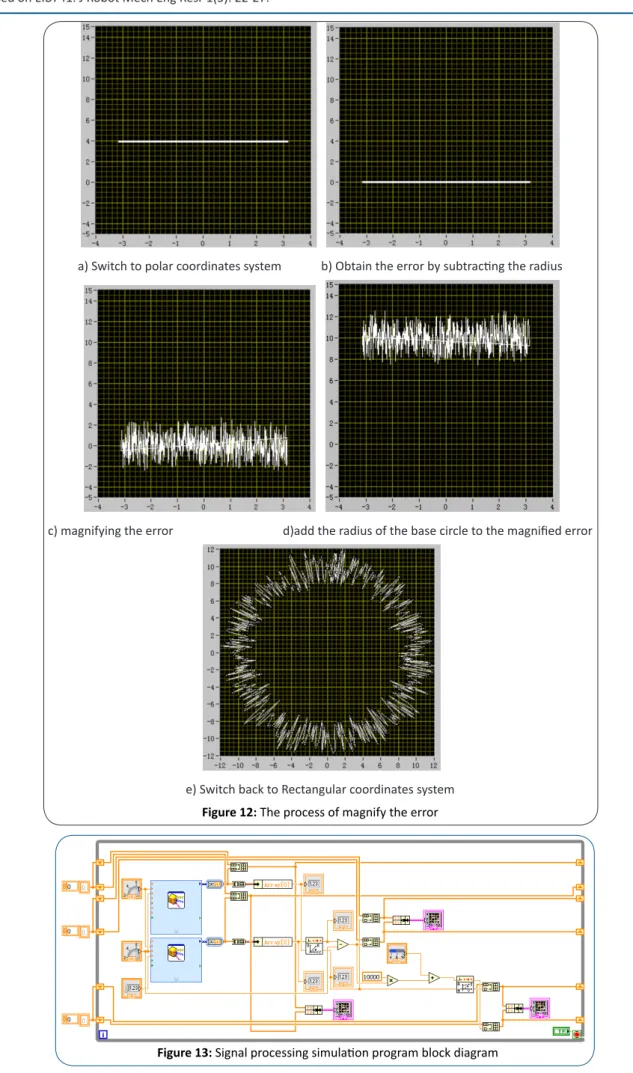
In order to see the micrometer-level error of the centimeter-level circle visually, we should magnify the error. As shown in Figure 12 is the program diagram of signal amplification processing.
Figure 10: The adjusted coordinates collection
Figure 11: Signal simulation circle diagram
Firstly transform the position change relation of x'i and y'i in the rectangular coordinate system into the change relation of phase position θi and amplitude Ri. Obtain the roundness error by subtracting the radius R. The error level can be seen by magnifying the error k times. We also need add the radius r of the base circle to the magnified error. And then we transform the change relation of phase position and amplitude back into the position change relation of the rectangular coordinate system, so we can obtain the new position relation curve about x''i and y''i. Finally the machine tool roundness error is shown visually. As shown in Figure 13 is the program chart of the simulation signal processing. Two signal generators generate two sinusoidal signals with 90 degrees phase difference. Using conversion module converted the rectangular coordinates system to polar coordinates system. Then subtract the amplitude of the simulation (9)
J Robot Mech Eng Resr 1(3). Page | 26
Switch to polar coordinates system b) Obtain the error by subtracting the radius a)
c) magnifying the error d)add the radius of the base circle to the magnified error
e) Switch back to Rectangular coordinates system
Figure 12: The processof magnify the error
J Robot Mech Eng Resr 1(3). Page | 27 Figure 14, we can see the error size and error type clearly after
amplification.
Figure 14: The graphics of the Roundness error
The experiment of data acquisition system and result
analysis
The KGM had its supporting software. We using the supporting software to collected the data and display the graph. Then we test the Labview program. When we open the Labview program, we need to set up parameters at first, such as the error amplifier gain, the machine tool’s running arc radius, size of the base circle. Running the software after setting the parameters, the roundness error graphics and error magnitude displayed.
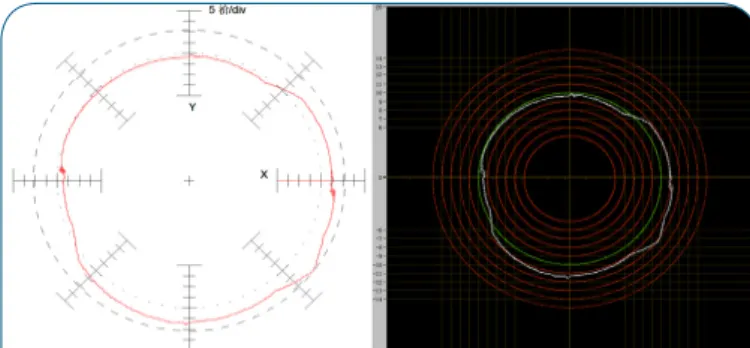
We compare the graph that using the program designed by Labview that saving by the encoder to the graph that using the encoder supporting software. As shown in Figure 15, the two graphs were exactly the same.
Figure 15: Contrast the error curve according to two software by the
same set of data
processing. References
Kakino Y, Ihara Y, Nakatsu Y, et al. The Measurement of Motion
1.
Errors of NC Machine Tools and Diagnosis of their Origins by Using Telescoping Magnetic Ball Bar Method[J]. CIRP Annals - Manufacturing Technology. 1987; 36(1):377-380.
Knap W. Test of Three-Dimension Uncertainty of Machine Tools and
2.
Measuring Machines and its Relation to the Machine ErrorAnnals of the CIRP. 1983; 1(32):459-464.
Sun bao shou , Zha fan, Zhang Lei. Labview and virtual roundness
3.
error measuring instrument. J. Of anhui University of technology. 2005; 07:259-261.
Kalkman DCJ. LabVIEW: a software system for data acquisition, data
4.
analysis, and instrument control. Journal of Clinical Monitoring. 1995; 11(1):51-58.
YE Huai chu, LI Zhi qiang, WANG Peng xiang, et al. Geometry
5.
and position error measuring system of CNC machines based on LabVIEW[J]. Journal of Mechanical & Electrical Engineering. 2010:26-28.
Wan W. Roundness Error Measurement and Analysis System Study
6.
Based on LabVIEW[J]. Machine Tool & Hydraulics. 2011:80-82. Ochi T. Introduction of update Heidenhain absolute linear encoder
7.
over 4m.The Manufacturing & Machine Tool Conference. The Japan Society of Mechanical Engineers. 2004:83-84.
Chen M, Xiong A, Fan Y. Universal Module for Signal Measuring
8.
and Processing of Heidenhain Encoders Based on FPGA and DSP[J]. Microcontrollers & Embedded Systems. 2014:28-31.
Warner M, Krabbendam V, Schumacher G. Adaptive periodic
9.
error correction for Heidenhain tape encoders. Proc Spie. 2008; 7012:70123N-70123N-8.
SUN Shi-wei, CHEN Xiu-cai, WANG Feng-rui. Reeding Method
10.
Study of Absolute Encoder with Endat Interface. Jiangsu Electrical Apparatus. 2008; 10:14-17.
Yao Juan, Zhang Zhijie, Li Lifang. Design and implementation of
11.
data acquisition system based on LabVIEW and TCP. Measurement Control Technology and Instruments. 2012; 07:72-74.
Zhang dong, Shi Qi-feng, Wang Yun-bo. Development and
12.
application of data acquisition system based on LabVIEW and TCP. Metallurgical Industry Automation; 2011; 03:36-40.
Yang H R, Liu G, Rong-Yu X U. TCP/IP technique application in
13.
inspecting system[J]. China Measurement & Testing Technology. 2008:42-44.
GAO Zhan feng, DU Yan liang, LIU Yu hong, et al. Remote Data
14.
Acquisition and Transmission Based on LabVIEW[J]. Microelectronics & Computer. 2007; 24(3):102-104.