Worcester Polytechnic Institute
Digital WPI
Interactive Qualifying Projects (All Years)
Interactive Qualifying Projects
March 2018
Developing Digital Maps for Worcester Historical
Museum
Nicholas Walter Seagrave
Worcester Polytechnic InstituteStephen A. Balcewicz
Worcester Polytechnic InstituteFollow this and additional works at:
https://digitalcommons.wpi.edu/iqp-all
This Unrestricted is brought to you for free and open access by the Interactive Qualifying Projects at Digital WPI. It has been accepted for inclusion in Interactive Qualifying Projects (All Years) by an authorized administrator of Digital WPI. For more information, please [email protected].
Repository Citation
Seagrave, N. W., & Balcewicz, S. A. (2018).Developing Digital Maps for Worcester Historical Museum. Retrieved from
Developing Digital Maps for Worcester Historical
Museum
An Interactive Qualifying Project Report submitted to the Faculty of WORCESTER
POLYTECHNIC INSTITUTE in partial fulfillment of the requirements for the Degree of
Bachelor of Science
By:
Stephen Balcewicz
[email protected]
Nicholas Seagrave
[email protected]
Project Advisor:
Professor Joseph Cullon, Project Advisor
Project Sponsor:
William Wallace, Museum Director
The Worcester Historical Museum
Table of Contents
Table of Contents…...………01 List of Tables…...……….………...03 List of Images………..……04 Abstract……….05 Acknowledgements………...06 Executive Summary………...07 Chapter 1:Introduction………..…09 1.1 Problem Statement… ……..…....………..………09 1.2 Project Goal………….………..………14 1.3 Project Objectives………...…...……….………...………14Chapter 2: Literature and Digital Environmental Review……….16
2.1 Literature on the Evaluation of Digital Integration in Museums……….………...……16
2.2 Best Practices for Digital Maps in Galleries………..………...19
Woonsocket Museum of Work and Culture………...………19
2.3 Digital Tools and Content Management Systems for Digital Maps………..…23
Leventhal Map Center………...25
2.4 Conclusion……….……..………..27
Chapter 3: Railroads and the Rise of Worcester Industry………...…28
3.1Introduction,...………...28
3.2 The Rise and Decline of Worcester’s Canal Era.……….…30
3.3 Evolution of Worcester’s Railroad Connections…...………...……30
3.5 Tables of Railroad Impacts………..33
3.4 Designing a Digital Railroad Interpretive Panel………40
3.6 Learning Objectives………..41
Chapter 4: Electric Railcars and Urban Growth……….………42
4.1 Introduction & History………..………..………...…..…42
4.2 Digital Maps and Evolution of Worcester’s Street Car System……....…………...…42
4.3 Origins: The Horse Trolley……….………..………44
4.4 Toward the Lake: The Worcester and Shrewsbury or “Dummy” Railroad……...49
4.5 Electrification and the Evolution of the Worcester Consolidated Street Railway...50
Chapter 5: Cartobibliography……….……….…60
5.1 Introduction………...60
5.2 Current State of Map Finding Aids………....60
5.3 Metadata Fields for WorcesterMaps.Org………...61
5.4 Managing WorcesterMaps.Org………..64
5.5 Tagging Maps by Genre………..65
Chapter 6: Conclusion and Recommendations……….………68
Bibliography……….73
List of Tables
Table 2.1: Open source mapping display software Review………...….27
Table 3.1: Railroad expansion …….……….…..33
Table 4.1: Horse Trolley expansion………...……….…...48
Table 4.2: Addition of the Dummy Line to Lake Quinsigamond……….……50
Table 4.3: Electric Streetcar serviced lines………...………..53
List of Images
Image 1.1: Current display of Worcester 1878….………..………09
Image 1.2: Current display of Worcester’s Industry & Waterways………10
Image 1.3: Current display of Worcester’s Residential Expansion.………….………11
Image 1.4: Current display of Wallings Survey…….……….………11
Image 1.5: Current display of Railroad Expansion Panel…………....………12
Image 2.1: Royal Ontario Exhibit Display……….…...20
Image 2.2: Interactive digital display at Royal Ontario………20
Image 2.3: Interactive mapping display of New York subway system……….…………24
Image 2.4: Interactive mapping display of New York trading routes..………….………24
Image 2.5: Embedded content within digital display………25
Image 2.6: Overlayed images on base map of a digital display…….……….…………..26
Image 3.1: Current display of Railroad Expansion Panel………...………....…29
Image 3.2: Regional transportation routes………..………...40
Image 3.3: Norwich & Worcester line specific map display………..………….41
Image 3.4: National railroad map………...43
Image 4.1: Common staff and equipment associated with horse transit………..………….44
Image 4.2: Leventhal map collection of Worcester 1861…………...………..45
Image 4.3: Edited display example of image 16…………...……….……….46
Image 4.4: Inline media example...……….48
Image 4.5: Trolley expansion between 1861-1891………...………..49
Image 4.6: Trolley expansion between 1891-1919………...………..52
Image 4.7: The regional and neighborhood connections of Worcester 1909……….……...56
Image 4.8: The regional connection of Worcester County 1900……….………...57
Image 4.9: Statewide electric Streetcar Connection to Worcester in 1900……….58
Image 5.1:Metadata field for “Map”...62
Image 5.2: Example of metadata fields for Leventhal Map...63
Image 5.3: Example of the metadata fields for WHM map………..64
Abstract
Our group worked with Worcester Historical Museum to develop interactive digital map exhibits for inclusion in the redesign of their Fuller Gallery of Industrial History. Digital map exhibits were developed for the impact of railroads on the development of Worcester and for the growth and decline of Worcester's horse and electric trolley service. This IQP also created a framework for building and maintaining a digital carto-bibliography in Omeka. WHM can use this framework to catalogue and make available digital images of their historical map collection through www.digitalworcester.com. We expect our work to assist the WHM as they redesign the Fuller, manage their physical map collection, and increase access to their digital collections online.
Acknowledgements
We would like to thank Professor Cullon for advising us throughout the project. He
provided us with excellent guidance researching, writing, and understanding the topics of this project. We also would like to thank William Wallace and Wendy Essery of the Worcester Historical Museum for sponsoring and allowing us to have access to the museums collections and archives to complete this project. Finally, we would like to thank Laura Robinson and James Monaco for their aid and time to help us conduct our research.
Executive Summary
The Worcester Historical Museum (WHM) is interest in updating their dated Fuller Gallery by integrating interactive digital maps. The current gallery does not engage the
museum goers, often leaving them to read hip rail panels or listen to audio display phones. This redesign provides a unique opportunity to not only update their gallery but to add engaging, interactive technologies. Additionally, digital systems offer a means to overcome some of the space constraints given the size of the gallery. The current Fuller Gallery feels cluttered and crowded with many historical artifacts and informative displays competing for attention in a tight space. The employment of digital technology in museums reduces the amount of space used by the displays, creating a more open environment for museumgoers and the ability to display more information while using less area.
Digital technology is especially useful for geographically orienting visitors through map displays. As maps in a digital display can be freely manipulated and overlaid, visitors can view maps focusing on different aspects of the same area, familiarizing themselves to the historical context. In cases where the topic of the display has features at multiple geographic levels, i.e. in-city, local, regional, and national levels, maps can be zoomed in or out freely to illustrate this, or separate maps of these levels can be shown in order.
This IQP undertook the research and analysis to create prototypes for two digital map respecting the role of railroads and electric streetcars in shaping Worcester’s industrialization. The railroad map display will focus on how the network of rail lines that connected to
Worcester impacted the city’s industrial growth over time, as the city was connected to new resources, raw materials, and markets. The trolley map display will focus on the creation and growth of a trolley-based public transportation system, and its subsequent decline. Both of
these stories are well suited to interpretation via digital map displays, as they are largely geographic.
The final objective of this IQP is to build a digital carto-bibliography. Currently, the Worcester Historical Museum only has a partial catalogue of their physical map archives. This system is outdated and inefficient, and could benefit greatly from digitization of many of these assets, especially their collection of historical maps. The establishment of a digital repository for these materials will greatly benefit the Museum and its users.
CHAPTER 1: INTRODUCTION
1.1 Problem Statement
The Worcester Historical Museum (WHM) is currently in the planning stages of thoroughly redesigning its Fuller Gallery of Industrial History. The original design beautifully captured the diversity of Worcester’s industry and population through artifacts and images, but the crowded gallery, which was completed in the mid-1990s, now feels dated. In addition, the current interpretation only partially incorporates geographic portrayals of Worcester’s growth. Four small laminated maps on the gallery’s interpretative hip-rail-panel orient visitors to the coming of railroads, distribution of industry in 1851, construction of triple deckers between 1890 and 1935, and rough boundaries of ethnic neighborhoods. There are no maps of the twentieth-century city. The only large geographic reference point for visitors to orient themselves is the 1878 Bird’s Eye view of the city published by O.H. Bailey and J.C. Hazen.
Image 1.1: The O.H. Bailey and J.C. Hazen aerial view of the 1878 city currently greets visitors at two entrances into the gallery. (Photograph from the collection of Joseph Cullon)
The use of small laminated maps evidence the limited interactive technology available when the gallery first opened to the public. Not more than 10 by 10 inches, the four small laminated maps along the hip rail interpret significant elements of Worcester’s history, but their small size and lack of detail inhibit their utility. One of the chief limitations of the currently deployed maps is their lack of orienting landmarks. For example, in Image 1.2, a visitor would benefit from the identification of Indian Lake (then North Pond) or markings that illustrate the maps features to modern landmarks. This limitation carries over to the next map in the gallery highlighting the chronological construction of triple deckers, see Image 1.3. Inclusion of neighborhoods, parks or other landmarks would make it easier for visitors to situate
themselves in this map. A second limitation of the current interpretative map panels relates to accessibility. In small type with no means of enlarging, some visitors with sight impairment will be unable to fuller appreciate their detail.
Image 1.2: A 10 x 10 inch map of Worcester’s early industries and waterways appears early in gallery chronological layout upon the hip rail.
Image 1.3: A 10 x 10 inch map chronicles the construction of Worcester’s iconic triple deckers in the late nineteenth and early twentieth centuries.
The current Gallery relies mostly upon reproduction maps stripped of orienting landmarks, but historical maps can help visitors visualize the spatial expansion and layout of Worcester’s streets. With only one historical map, Image 1.4, the current geographic content of the exhibit misses an opportunity to use the Museum’s extensive collection of maps.
Image 1.4: A small section of the 1851 H.F. Walling’s Survey of Worcester published by Warren Lazell.
The current maps overwhelmingly interpret Worcester’s early history and industrial transition. For example, one of the most effective geographic panels in the current exhibit explains and illustrates the arrival of railroads connecting Worcester to points north, south, east and west in Image 1.5. This significant attention to railroad is entirely merited because
Worcester would not have developed as it did without access to markets and raw materials, but the arrival of railroads was the second in a series of transportation revolutions that remade the city’s industrial landscape. This first, of course, was the Blackstone Canal, which is well covered in the exhibit. Missing from the gallery is content on how first horse and then electric street car service spread heavy industry to New Worcester in the 1860s, Quinsigamond Village and present-day Greendale. Street cars not only allowed for the spatial spread of the city, but also allow for the spatial separation of industrial and residential districts, facilitating the rise of new ethnic neighborhoods further from the industrial core. Finally, cars and the expansion of highway service with Interstate 290 facilitated the move of some industries out of the city and into the outlying towns of Worcester County. Most famously, the Wyman Gordon move to Grafton initiated a decentralization of industry toward the suburban periphery.
Image 1.5: Interpretative panel on how railroads transformed Worcester into a crossroads between 1835 and 1854.
Just as the use of improved geographic components can enhance visitor engagement and learning outcomes, new digital technologies can also draw the visitor deeper into the gallery and aid in the display of additional resources without competing for space in a crowded space. The old corded telephones and laminated flipped books themselves seems like
historical artifacts in a age of touchscreens and smartphones. In many instances a young patron would have no memory of wall phones with cords, but these audio devices offer visitors compelling oral histories to augment the display of artifacts. In an attempt to intrigue the visitor to delve deeply into the gallery’s oral histories, its interfaces would better utilize technologies that the visitors are more familiar with and confident using. Finally, in an age of digital maps and geographical information systems, the flip book style of learning is not engaging enough for visitors to the gallery. Furthermore, in some cases the text information on displays is not even legible to all viewers, being too small for the vision impaired. In these cases, material on display may not even be considered for further investigation.
Digital mapping can greatly enhance geographic storytelling and interpretation in the gallery. When redesigning the gallery it is vital to implement interactive components. This method is very useful to the patron trying to engage content of their own terms. It allows them to visually, physically, and mentally understand the material with which they interact with. The use of digital technology overall is capable of displaying an enormous amount of information while taking up only as much space as is necessary for the display, especially when all of the data is stored online. This would massively reduce the cramped and cluttered feeling of the current Fuller Gallery. Personalizing experiences for different age groups can also be as simple for a museumgoer as touching a single icon at the start of their experience - with no concern as to how much more space it would take up to have an additional set of displays, as they
would all be stored together in the digital display. For museumgoers with visual impairment, the digital displays could be zoomed in on so the images and text were more legible.
While the inclusion of digital maps offers an opportunity for WHM, challenges await the museum as their map collection is disorganized and largely uncatalogued, which will make locating, sorting, and digitizing the maps for use in displays difficult and tedious. The museum staff is also largely inexperienced with the various tools required to build and display
interpretive and interactive digital maps. There is also the question of identifying durable
hardware for displaying the maps, along with maintenance and expansion of the display, which could prove troublesome given the aforementioned lack of technological experience on the part of the Museum staff.
1.2 Project Goal
This Interactive Qualifying Project (IQP) aims to support WHM in its redesign of the Fuller Industrial Gallery to increase the deployment of cartographic material and enhance geographic interpretations using digital tools. Given the needs, challenges, constraints, and timeline of WHM’s redesign of its industrial history gallery, this IQP defines its fundamental goal:
Design and develop digital, interactive and interpretative maps to create a more immersive and educational experience for visitors of all ages to the Worcester Historical Museum’s Fuller Gallery of industrial history.
1.3 Project Objectives
To fulfill its goal, this IQP identified a series of objective to guide its development, measure its progress, and ensure its delivery of meaningful content to WHM.
1. Work with WHM’s librarian and archivist to identify the range of catalogued and uncatalogued resources in the collection;
2. Design and create a digital carto-bibliography to WHM’s fullest collection of maps; 3. Build an Omeka site - worcestermaps.org - with custom item type for maps that can
serve as an accessible home for the digital carto-bibliography complete with photographs or scans of the maps;
4. Assess scholarship on digital technology in museums and evaluate best practices and technologies for building digital maps;
5. Create a storyboard for the digital interpretation of Worcester’s increasing connections to regional and national markets through railroad integration, including custom
cartographic animation, historic maps, artifacts and historical photographs; and 6. Create a storyboard for the digital interpretation of the city’s street car system and the
spatial reorganization that it wrought; including custom cartographic animation, historic maps, artifacts and historical photographs.
Each of these objectives support the goal of this project, which is to develop interactive map displays to create a more immersive and educational experience for visitors to WHM’s Fuller Gallery of Industrial History.
CHAPTER 2: LITERATURE, MUSEUM, AND DIGITAL ENVIRONMENT REVIEW
For more than two decades digital technologies have been making their way into museum galleries. From touchscreen interpretative panels to interactive digital games, history museums now increasingly see the integration of digital technology as a central component of planning new exhibits, redesigning existing galleries, or augmenting but not displacing
permanent installations. This chapter analyzes scholarly evaluations of digital technologies in museums, surveys best practices for digital mapping technologies in two museums, and evaluates software tools for building and displaying digital map content. This three part approach to the “state of the field” in digital museum technologies points to its increasing acceptance by museum professionals, its effectiveness in engaging audiences, and its growing accessibility for museum staff through new, mostly open source, software tools.
2.1 Literature on the Evaluation of Digital Integration in Museums
There is a great deal of research into the use of digital technology in museums, and much of it supports the idea that the use of interactive digital displays increases museumgoers’ engagement with the content. Scholarly evaluations of existing digital exhibits tend to report, at worse, no significant change in information retention, to a marked improvement in information retention compared to more traditional physical displays.
The paper “Learning through multi-touch interfaces in museum exhibits: an empirical investigation”, by Panagiotis Zaharias, Despina Michael and Yiorgos Chrysanthou, for example, explored the question of whether interactive digital displays enhanced or detracted from
museumgoers’ enjoyment or education. They conducted their study at the Leventis Municipal Museum in Nicosia, Cyprus, a museum focused on the preservation and presentation of numerous historical artifacts. The museum had recently introduced a digital display to tell the
story of the “Walls of Nicosia”, which refers to the various fortifications constructed around the city over its history. The study examined whether students benefited more from traditional displays, in this case taking a guided tour through the museum to learn about the Walls from printed maps, versus interacting with the multi-touch digital exhibit. The participants in the study were 53 fifth-grade students from local elementary schools, aged 10-11. The students were divided into two groups, traditional learning and digital interactivity, as described above. All students were given the same questionnaire on the Walls of Nicosia before their experience, and another questionnaire on the Walls and their assessment of the experience afterwards. They found no statistically significant evidence that the digital experience was better for information retention over the traditional experience, but did find that the students enjoyed the interactive experience more. The authors also noted that they observed a much higher degree of enthusiasm and engagement in the interactive group than the traditional group. (Zaharias 2013)
Similarly, in “Engagement with an Interactive Museum Exhibit”, Naomi Haywood and Paul Cairns conducted a study at the Science Museum in London, England. They evaluated the exhibit Energy: Fueling the future, which contains six interactive elements, of which one,
Energy Everywhere, was the main focus of the experiment. Energy everywhere is primarily aimed at children aged 7-14, and lasts roughly five minutes. This exhibit element is comprised of an interactive video, in which a variety of scenarios are shown while a voice-over describes how energy is present and being used in each one. Museumgoers are encouraged to
participate by performing actions, such as clapping and spinning their arms. Using software similar to GestureWorks, the movement response software commonly found in games like Wii Fit, the goal was to get visitors moving and active. If their actions are not registered, they will be encouraged to repeat them with more enthusiasm. The researchers interviewed ten children
within the intended age range after they had used the exhibit, and found that the children enjoyed the interactivity and digital displays greatly, and that watching the connections between states of energy change because of their actions helped them understand those processes better. (Haywood 2006)
“Museum Scouts: Exploring how schools, museums and interactive technologies can work together to support learning”, by Jocelyn Wishart and Pat Triggs, explores the findings of a massive study performed by countless teachers, students, and museum staff across Europe. The students, aged anywhere from 10-19 years old, visited a variety of museums each,
including subjects such as science, art, and history. Due to this, there was immense variation in the level and form of interactivity the students experienced at these museums. It was found, overall, that students whose museum going experiences involved more digital interactivity reported more enjoyment and engagement, and showed more information retention than those of students with less digital interactivity. (Wishart 2010)
Jessie Pallud’s paper “Impact of interactive technologies on stimulating learning experiences in a museum”, performed more research into how digital interactivity affects museumgoers. She used the digitally linked audio guides and the interactive kiosks at the French National Museum of the History of Immigration in Paris as her interactive displays, versus more traditional physical displays elsewhere in the museum. She found through data analysis that when users view their experience as more engaging and interesting, they show an improvement in learning. (Pallud 2017)
In terms of general engagement and museumgoer interest, Robin Baker’s study, “An Interactive Computer Video Game for the Design Museum: Using Technology to Teach Technology”, reported that the in-museum video game they developed for use by the Design Museum in London, meant to teach players the basics of information display, was played by
over one third of museumgoers, worked well and reliably, and provided important context to the surrounding displays. (Baker 1991)
Collectively, these evaluations point to the increasing recognition that digital
technologies are not distractions within museum settings. Rather, they can enhance, reinforce and expand the learning experience of visitors while also increasing their enjoyment.
2.2 Best Practices for Digital Maps in Galleries
While digital interactivity in museums is now common, interactive digital map displays are somewhat less so. Still, there are examples of such displays available for analysis. Three recent examples deserve special note, each operating at a different scale - the Forbidden Palace exhibit at the Royal Ontario Museum, the Digital Map of Woonsocket Mills at the Museum of Work and Culture, and the mapping New York City at the Museum of the City of New York.
One example very similar to our own intentions for the Fuller gallery is described in “Mapping the way to a more digitally inclusive museum”, by Alyssa McLeod. In her paper, she describes the use of digital mapping software and interactive displays using that software to create a display for the Forbidden Palace in Beijing for the Royal Ontario Museum. The user can explore the overhead map of the Palace, and tap on information points to learn more about the Palace through text and images corresponding to those locations. (McLeod 2015)
McLeod’s work points to the way digital geographic interpretative panels can be adapted to various scales from palace to region and also underscore that the intention of the geographic interpretation needs to be define and correspond with eventual design for visitor engagement.
Image 2.1. Visitor engages with a digital touchscreen in the Forbidden Palace exhibit at the Royal Ontario Exhibit. Touchscreens enhanced visitor engagement with 250 artifacts that traveled for the first time to Canada. (McLeod 2015)
Image 2.2. The physical display, and the interactive digital screens. Note there are multiple screens surrounding the display for visitors to interact with, and several selectable points of interest. (McLeod 2015)
Recently, the Woonsocket Museum of Work and Culture installed a table-sized
interactive digital display in their mill exhibit. The display shows a map of Woonsocket over the course of four time periods, and has twenty five selectable data points. Each data point
corresponds to one historical mill that is or at one point was present in the town. Selecting different time periods will also change the informative text and images that appear when that mill is selected, with the new information reflecting new developments that have occurred since the last time point. The table’s size allows up to four visitors to interact with display at the same time without obstructing each other.
Besides serving as an excellent example of the benefits of interactive digital displays, the Woonsocket Museum’s mill exhibit can offer other advice. Showing the progression of the mills using discrete time periods as opposed to a continuous timeline is simpler for both the developer and the visitor. Also, while our team took advantage of the table’s visitor capacity to have two people examining it at once, there were still a few features that we did not notice in our time with the display. This shows the importance of having clear and concise instructions available to visitors, especially considering the displays in the future Fuller gallery will only have room for one user at a time. The Woonsocket staff reported that they see a wide variety of patrons using the exhibit, and that they have received large amounts of positive feedback from the community. They advised that museums looking to invest in similarly technological displays allow the design form plenty of time to develop the display, and to create a Content
Management System for easy content alterations.
At the Museum of the City of New York, a range of interactive digital map displays are available. The Future City Lab exhibit features several displays of data on the city and its history, including a large, curving digital map that cycles through various datasets, including immigration and businesses. There’s also the NYC Subway Development Map, which allows users to follow the construction and progress of the New York City subway system over several decades, with points on the timeline being free for the patrons to choose, with extra
information being displayed beside the map of the subway lines. Another display shows the growth and change of industry throughout the city over the centuries.
Image 2.3. Map of the New York City subway system at the Museum of the City of New York.
The display has a number of years that can be selected from a timeline at the bottom of the panel, and the different sections of the line can be viewed separately or all at the same time. (Young 2017)
A fourth, entitled “Port City: 1609 to 1898”, shows the economic growth of NYC from a small trading post to one of the most important centers of trade, manufacturing, and finance in the world. It shows change in trade goods, trade routes, city size, and manufacturing locations. Another shows the evolving diversity of the city from 1609 to 1898, and another, with more census data to show and easily map out, shows the remaining years from 1898 to 2010. Also, the former map focuses on religious diversity, while the latter focuses on changing ethnic diversity. (Young 2017)
Image 2.4. This display shows the growth of New York City from a small trading outpost to the commercial titan it would become. (Young, 2017)
Collectively, the digital maps at the Royal Ontario Museum, the Woonsocket Museum of Work and Culture, and the Museum of the City of New York demonstrate the powerful visual impact of both small and large touchscreen interpretative panels. They also offer the museum inspiration as it considers rendering it own exhibit it more explicit geographic terms that orient visitors to space as well as time.
2.3 Digital Tools and Content Management Systems for Digital Maps
Designing and building digital maps can be intimidating for those unfamiliar with recent advances in story maps technologies. While many museums, like the Woonsocket Museum of Work and Culture, hire graphic design firms to create final installations, many recent digital tools exists to allow WHM to prototype ideas and designs without the expense of contracting expensive services. This section explores some the most significant and accessible tools available to WHM for prototyping digital maps and evaluate the potential utility and effectiveness of touchscreen geographic displays in the industrial history gallery.
One tool, StoryMapJS, is a simple software that allows users to tell stories using maps, data points, text, images, and embedded videos. One example, “How the Islamic State is
carving out a new country”, tells the story of how the terrorist organization ISIS conquered areas in the middle east over time, using a system that allows users to either explore the map and its data points freely, or follow a predetermined story from point to point. (MAP) Another example from the same website, “From 0-89 Million Pounds – The Most Expensive Transfers in Football History,” tracks the history of fantastically expensive player trades in football, has similar effects as the earlier display, but uses a high detail map of the entire world as a base, showcasing to the user exactly which countries are willing to spend huge amounts of money on athletes. (Barilaro 2016)
Image 2.5. The points with lines on them represent only text is available at those points. The points with arrows on them represent embedded videos are present. (Barilaro 2016)
A website that allows for the construction of far more complex story maps is Neatline from the Scholars Lab at the University of Virginia. One of the examples of the software is “Perspectives on the Haram”, which illustrates the changes to the Haram Mosque over the course of centuries. The map can also be zoomed out from its starting position to show the
spread and recession of the Ottoman Empire, in which the Mosque is historically located, over time. (Ibn Jubayr n.d.) A second example, “My Dear Little Nelly”, showcases scanned in letters from a Civil War soldier writing home, and connects the events and locations present in the letters to points on the base map, and also shows troop movements as arrows in the background. (My Dear Little Nelly n.d.)
Image 2.6. Different sections of the letters along with other sections of the map can be selected and explored. (My Dear Little Nelly n.d.)
Another online source to look to for guidance would be ATLMaps, a project utilizing multiple experts and coding languages to develop an expansive collection of digitized maps focusing on Atlanta, Georgia. The maps can be overlaid on top of each other, and then data points can be dropped on those maps, with text, images, and videos stored within to tell a story. However, as ATLMaps is specifically for the city of Atlanta, and imitating it would require resources and expertise far beyond the scope of this project or the Worcester Historical Museum, we should not most likely not try to emulate it on a technical level. (ATLMaps n.d.) The Norman B. Leventhal Map Center at the Boston Public Library has both online and
in-gallery interactive digital map displays, a feature which the museum may benefit from. (Norman B. Leventhal n.d.)
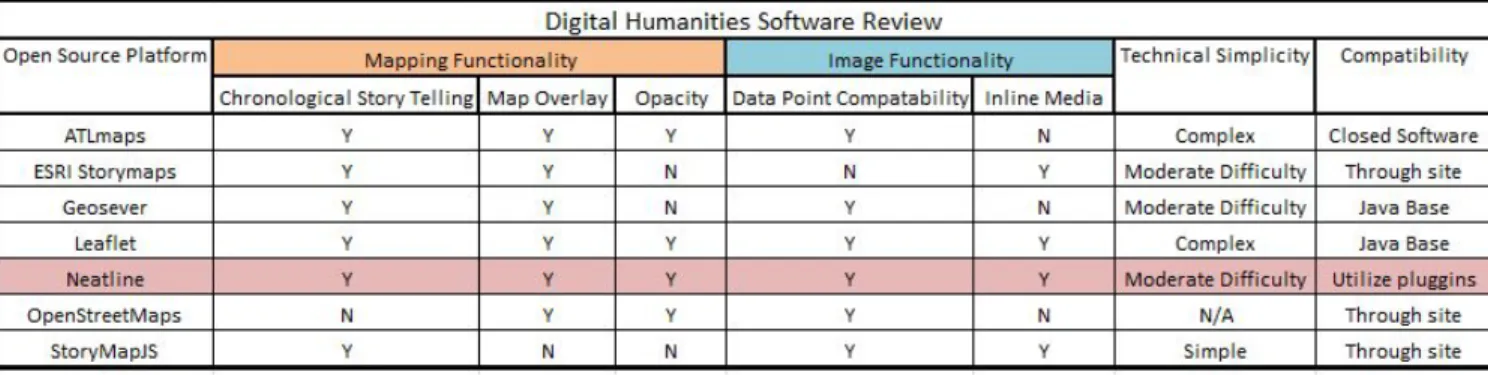
Table 1, shown below, is an evaluation of several open source software databases. Throughout the evaluation it was important to find a software that was technically simple to use and capable of supporting external plugins. Additionally, the evaluation was based on two methods of functionality, mapping and imagery.
Table 2.1. Review of various open source mapping display software
The mapping functionality is the most important for the presentation, organization, and execution of the display. The digital display should contain the ability to tell stories over time, overlay historic maps over current basemaps, and the ability change the opacity. It is important to overlay maps of interest to a base so the user can have a point of reference to compare the selected map to. This will be a way of creating an artificial benchmarks for the user to
understand the teaching point of a particular historic map. The opacity is useful because it allow the user to adjust the transparency of a particular map, so they can observe the area below the selected map. In addition this will allow the user to connect various maps by layering one on top of the other and adjusting the top maps transparency.
The image functionality points are important because they allow the WHM to have a display with a large quantity of content without overwhelming the user. This process can be utilized by placing data points. These pinned locations on the display suppress certain content
by storing it in the background utilizing a plugin, such as omeka. When the user clicks on a particular datapoint the system accesses the corresponding data and the information is
displayed. Finally, the variety of data point opportunity is important to keep the user interested. By allowing the data point to contain text, image, video, or a combination; a user will be less likely to become uninterested with the display.
2.4 Conclusion
Digital museum technologies have matured to being a accepted, even required part, of designing and implementing new exhibits. Studies demonstrate that well designed, accessible and informative digital assets not only increases visitor and enjoyment but also increases their engagement and learning outcomes. While many museums rely upon outside digital design firms, accessible open sources tools exist to allow WHM to imagine, conceive, and prototype geographic interpretative elements before engaging outside professional services.
CHAPTER 3: RAILROAD AND THE RISE OF WORCESTER INDUSTRY
3.1 Introduction
Railroads were one key part of Worcester’s rise to industrial prominence. The natural and physical geography of Worcester, along with poorly maintained roads, discouraged its emergence as a central point of industry. Before the Blackstone Canal’s completion in 1828, the town’s primary claim to relevance was its status as the shire town of Worcester County and home of the Worcester County Court (Moynihan, 2007). With the establishment of
transportation routes, Worcester created a new geography, with itself planted firmly in the center. As more railroads were connected, Worcester’s industrial and transportation strength grew, with local roads providing access to nearby resources and processing plants, and longer railroads importantly linking the city to supplies and markets across the country (Cullon, 2018). Worcester is not the only example of such a city whose relevance grew through
railroads. The city of Chicago also prospered from a network of rail lines connecting it to the east and west, despite its geography. The city’s only geographical boon in terms of centrality was its position on Lake Michigan. Investors in the city and Illinois chose to finance a railroad leading to Galena, Illinois, a lead-mining district. The rail line proved to be a great boost to the city’s economy, and by 1860, the city of Chicago, originally built around farming and traffic on Lake Michigan, had become a key point in transport between the western and eastern halves of the United States, with the majority of railroads west of Lake Michigan leading back to Chicago (Cronon, 1991).
Despite the incredible importance of the railroads to Worcester’s development, there is remarkably little information about them or their role present at the Worcester Historical
Museum. They are mentioned briefly in the current exhibit, with the majority of information being contained in a single placard as a simple map alongside a paragraph of text.
Image 3.1. Current, sparse exhibit on railroads in the museum. (Photograph from the collection of Joseph Cullon)
With the coming renovation of the Fuller Gallery, and the installation of touch screen displays, an opportunity to improve the situation has presented itself. The integration of touch screen technology will allow Worcester Historical Museum to implement interactive digital displays to communicate the information and educate visitors about the impact railroads had on the growth of Worcester and its progression into a center of industry. The displays will utilize interactive maps to show the development of the network, with a time-lapse function showing the changes over time, with text and images being linked to each railroad. This will be an improvement over the current state as it will allow a large amount of information to be communicated to visitors while occupying very little space in the gallery, and it has been
shown that higher interactivity is both more enjoyable for museumgoers, and improves cognitive retention relative to traditional text based displays.
3.2 The Rise and Decline of Worcester’s Canal Era
Before the railroads, the Blackstone Canal was the first manufactured trade route connecting to Worcester. It was proposed in the 1790s, and attempts to construct it were made in 1821 and 1828. The first attempt had the support of both Worcester investors and Providence merchants, but project supervisor, Benjamin Wright was still overseeing the construction of the Erie Canal, and work did not commence until Rhode Island residents
became impatient and made an effort at construction themselves in 1824. They faced repeated difficulties with poor chartering, and many contractors abandoned the project after only a few months. Heavy rains and a burst dam destroyed what little had been completed by winter. (Moynihan, 2007)
The following spring, Benjamin Wright had completed the Erie Canal and could begin work on the Blackstone, and completed it in in 1828. The canal linked Worcester to Providence to the southeast, along with all of the villages and mills between them. While still a boon to Worcester’s economy, the Canal had a much smaller impact on the city than most of the railroads that would come later. The travel along the Canal was limited in one direction, and moving cargo was slow and unreliable with the water level and speed being dependent on the weather. After the establishment of the railroads began, the Canal quickly became outdated and passed over by most companies looking to move freight, and business dried up.
(Moynihan, 2007)
The first railroads served to connect Worcester to seaports – Boston and Providence, the capitals of Massachusetts and Rhode Island, respectively. The first railroad to connect to Worcester, the Boston & Worcester, was constructed in 1835, with the Boston & Providence having been completed the year before. The two routes also served to replace the Blackstone Canal, establishing a more reliable and two-way path for transportation of resources.
(Chamberlayne 2014) The Norwich & Worcester was the next line to connect to the city directly in 1840 (Karr 2014), linking Worcester to another port city, this one in Connecticut. Eventually this created a dense set of connections to the west and south as local rail lines connected to the national rail system.
The first line to connect to Worcester, the Boston & Worcester, was later expanded – a line was constructed from Worcester to Albany in New York, completed in 1841. This larger section of line, known as the Western Railroad, changed the Boston & Worcester Railroad into the Boston & Albany Railroad, and connected Worcester to the rest of United States. (Karr 2014) Despite the incredible boon the line would become, many Worcester residents and investors opposed the idea of investing in the line, fearing it would reduce the city to just a stop on the route between Albany and Boston. (Chamberlayne 2014) Their fears turned out to be unfounded as the impact on the city was tremendously beneficial. Worcester was suddenly connected to resources, materials, and markets across the entire country.
One of the most notable connections formed by Worcester’s newfound access to the New York Central System of railroads was that to the coal fields of Pennsylvania. Access to the Pennsylvania mines allowed the city to bring in coal to fuel their industrial growth via steam engines, much of the water coming from the Blackstone Canal, having found a new purpose after its fail into irrelevance. (Landscape of Industry, 2009) Another important acquisition was the iron mines of Michigan, which provided the raw materials for the machines and products of
Worcester’s many manufacturing plants. From the 1840s to the 1850s, Worcester’s population more than doubled, and the amount of the workforce employed in manufacturing went from almost none to almost half. (Moynihan 2007) The Western also led to access to the Erie Canal, While the Western Railroad was enormously important to the development of Worcester as an industrial giant, local rails still affected the city’s growth. Railroads such as the Fitchburg & Worcester connected Worcester to smaller nearby towns and cities, and helped to draw in the local industry and resources towards the city. The Fitchburg & Worcester specifically drew in a great deal of business from Worcester county as it helped to connect the northern and southern halves of it. (Chamberlayne 2014) The Boston, Barre, and Gardener, which never reached Boston or Barre, connected Worcester to many local resource centers, such as lumber yards and industrial parks, and helped surrounding towns supply the city with basic amenities such as milk and ice, (Karr 2014) which otherwise would have needed to be produced more locally, slowing the industrial growth of the city.
Railroad Construction Complete Cities and Locations Connected to Worcester
Investors Impact on Worcester
Boston & Providence, Boston & Worcester 1834, 1835 Boston, Providence through Boston
Initial attempts to gain support from the government fell through, as the Boston & Worcester line did not benefit many small towns who were reluctant to pay taxes. The company turned to private
investors, advertising the line as a first trial to see the costs and benefits of a line that could extend to the Hudson. Worcester
financiers were leery and only bought 250 of the 10,000 available shares of stock, 50 of were bought by Stephen Salisbury. 1
Formed a new pathway for goods to be moved between Worcester and
Providence – one better than the canal in every way. The railroads were not restricted by weather for operation, and could travel to and from both cities that the canal only offered one-way
passage between. These railroads would be one of the first major steps to turning Worcester into the industrial hub it would become, linking the river mills to the plantations of the South. 2
1 Chamberlayne, 2014 2 Landscape of Industry, 2009
Norwich & Worcester
1840 Norwich, Maine The line was funded by both the state of Massachusetts and the city of Norwich. The line was reliant on further loans and subsidies from Massachusetts for much of its existence, as it failed to make much profit. 3
Passed through a through a densely populated region that had already industrialized. There were valuable cotton, wool, paper, iron, and lumber mills on or near the route, along with quarries. The proposed pathway was also so level a canal had been considered at one point for the same route. The Norwich & Worcester also turned Worcester into a hub to transfer freight from the Boston & Maine to the Norwich & Worcester, connecting the state of Maine, the state capital and major port of Boston, the mills of Worcester, and the state of Vermont into one route. 4
3 Karr, 2014 4 Karr, 2014
Western Railroad
1841 Albany, the rest of the United States through
Albany
The Boston & Worcester Company received a charter to build the Western Railroad in 1833, but shortly afterwards, competition arose as parties in Hartford and New York planned to connect the two cities through rail. B&W pushed hard for investors in response, but found few interested parties in Worcester, as the city felt Worcester would prosper more as a terminal city of the line as opposed to a point along it. 5
Served as the western portion of the Boston & Albany. The Boston & Albany line served to connect Boston and Worcester to New York, and from there, the rest of the United States. Worcester was connected to America at large, and could blossom into an industrial and transportation hub. 6
5 Chamberlayne, 2014 6 Karr, 2014
Providence & Worcester
1847 Providence,
directly via rail
Funds were raised almost entirely by Providence investors, as Worcester investors were reluctant to purchase stock. 7
The Providence & Worcester served much the same purpose as the Boston & Providence/Boston & Worcester combination, allowing for faster transport between the two cities and further reducing the usefulness of the Blackstone Canal. It also lessened Worcester’s reliance on Boston in terms of trade, as freight from
Worcester no longer needed to travel through Boston to reach Providence and the rest of Rhode Island
Interestingly, the Providence &
Worcester company never owned more than 28% of stock on their own
railroad. 8
7 Chamberlayne, 2014 8 Karr, 2014
Worcester & Nashua 1848 Nashua, Rochester, Portland, New Hampshire
The first Worcester railroad to funded primarily by the city itself. The principal investors included Daniel Waldo, Isaac Davis, Stephen Salisbury II, and William Wheeler. 9
The line expanded to Rochester in 1874. The expansion established a link from Maine to New York, further
solidifying Worcester’s role as a transportation and industrial hub. 10
Fitchburg & Worcester
1850 Fitchburg It connected to the Worcester &
Nashua, and was a relatively local, though still important railroad, mainly serving the purpose of connecting Fitchburg to the national rail network, and connecting the northern and southern parts of Worcester County. 11
9 Chamberlayne, 2014 10 Karr, 2014
Boston, Barre & Gardner
1874 Gardner,
Winchendon
The BB&G failed to receive any significant amount of investments
or profit, leading to it never actually reaching Barre or Boston,
and construction not beginning until 22 years after being initially
chartered. 12
The line never actually reached Barre or Boston, but was later extended to reach Winchendon. Attempts were made to extend out to Concord afterwards, but they were as
successful as the Barre branch. Most of the freight moved along the line was milk and ice from the surrounding towns into Worcester, and the branch was soon served by local trains operating out of Worcester, helping to connect the city to mills and the products of factories along its route, including an industrial park in Holden and a lumber yard in Hubbardston. 13
12 Chamberlayne, 2014 13 Karr, 2014
New York Central System First consolidated in 1853 Pennsylvania, Ohio, Michigan, Illinois, all of the
continental United States through various railroads connected to the system.
The New York Central System is one
of the largest railroad systems in the United States. It serviced the states of New York, Pennsylvania, Ohio, Michigan, Illinois, and Massachusetts. It is a consolidation of dozens of formerly independent railroads, with acquisitions ranging from 1826 to 1914. 14
3.4 Designing a Digital Railroad Interpretive Panel
The railroad lines as they are currently on the map will be removed with Photoshop or another image manipulation software, and multiple copies of the image will be made, with groups of particular lines either missing or present based on their time of completion. As the visitor progress through the display, more lines will appear as each image is replaced by the next, creating the time-lapse effect. The lines that are important specifically to the story map will be highlighted in different colors to distinguish them from surrounding lines.
Image 3.2. Map of the Railroad routes surrounding the Blackstone Canal as of 1885.
(Landscape of Industry, 2009)
As each line appears, it will become selectable, and selecting it will cause a brief textual history of the line and its impact of Worcester to appear, with accompanying images.
Image 3.3. An example of a line-specific map that could appear when a line is selected from the base map. This image is of the Norwich and Worcester Line. (Karr 2014)
3.5 Learning Objectives
The primary objective of a museum, more so than entertainment, is education. Therefore, it is important to focus on how the implementation of the digital map displays will positively impact the learning experiences of visitors. More specifically, there would be three major learning objectives for this exhibit. The first learning objective would be to show how the most
The first example would be the impact of the Blackstone Canal, with the one-way transport of goods between Providence and Worcester. Then, to a much greater extent, the enormous impact of the railroads. The second learning objective would be to show that railroads were tightly tied to Worcester’s energy transition to fossil fuel dependent steam power and metalworking industries, with fuel for steam in coal from Pennsylvania, and raw materials in iron from Michigan. This lead to heavy usage of steam power in equipment and train engines, water mainly coming from Blackstone Canal. This ties directly into the third learning objective, which is showing that railroads connected Worcester to markets for raw materials but also linked the city with new consumer and industrial markets for its products. This lead to the rise of manufacturing companies such as Coen Wires, Washburn and Moen, that ended up making up the bulk of Worcester employment for decades, along with Worcester being a major
supplier of various metal wire and manufacturing tools, and developing inventions such as barbed wire and the monkey wrench.
Another benefit of the transition to digital map-based displays is that the new system will be able to tell the full story to visitors. The existing exhibit only gives a brief statement that railroad’s eventually led to Worcester becoming a hub of regional rail systems. While this is true, Worcester was much more than just a hub for the northeast. The railroads connecting to the city of Worcester affected not only New England and the northeastern United States, but had an impact on the entire country, mostly via the Western Railroad connecting it to the New York Central System. Interactive maps are incredibly useful for communicating this type of story, as it combines visual and textual mediums, and visitors can zoom in and out of the maps to maintain a consistent sense of scale as they learn about the scope of Worcester’s industrial role.
Image 3.4. An historical map showing the railroad network of America as of 1854. This and maps of similar scale can be used to show how railroads connected Worcester on a national level. (Chesborough, 1831-1886)
CHAPTER 4: STREET CARS AND SPATIAL DIFFERENTIATION
4.1 Introduction
Urban transit was the key transportation technology in the expansion and development of Worcester, Massachusetts in the second half of the nineteenth century. While railroads brought big industry and centralized Worcester as a regional transportation hub in the early nineteenth century, the local transit abetted its substantial growth and geographic expansion with the filling in of the urban core and the spreading of its periphery into near suburbs. Worcester tremendous industrial growth after 1860 required not only a growing population of working immigrants but also the means of moving them across the city, prompting new development in secondary business districts and residential suburbs. A growing city was an attractive city. Many flock to the newly developing city in the hopes of work, business, pleasure, energy and new beginnings (Warner, 1962).
Although, urban transit systems played such a vital role in Worcester’s industrial development, its story is left untold in the current exhibit. From Wyman Gordon to Washburn Moen, wrenches to machinery, corsets to space suits; Worcester is a diverse city whose characteristics are on displayed at the WHM. However, local and interurban transportation is not represented. Many stories can be told from the layout of the city streets, neighborhood locations, distribution of industry, and the spread of residential districts. Despite the absence of visual representation, digital mapping of the city’s network of streets and streetcars as they developed would be a useful way to engage and interest patrons of all ages and technical ability. Expanding the gallery’s interpretation in this direction would leave WHM visitors with a better understanding the city’s industrial and residential geography.
As a result of Worcesters diversity, there are several important characteristics that can be portrayed through the integration of a digital mapping exhibit.The most prominent is the expansion and separation of the city layout. Mass transit reshaped Worcesters industry by growing secondary business areas and mitigating the need for increase working population by offering new housing districts surrounding the industrial complexes (Warner, 1962) . Secondly, Worcester’s transformation from a walking city to a streetcar suburb indirectly caused ethnic segregation and class hierarchies which continue to shape the city (Blackmar, 1991).
Furthermore, mass transit in Worcester compartmentalized work, home, and leisure within each household commercialized recreation for the first time (Rosenzweig, 1983). Finally, the evolution of railway companies and transit routes contributed to a large scale business model for the mass transit system through consolidation and coordination (Carlson & Harding, 1985). The diverse learning outcomes that can be acquired through an understanding of Worcester’s urban transit system would otherwise be difficult to display in a museum; however, advances in interactive learning and modern technology reduce the compromise between content and display space within the Fuller Gallery.
Integrating digital mapping displays into the Fuller Gallery redesign would be crucial in depicting the importance of urban transit effect on Worcesters growth. Large touch tables or small touch screens can be used to reduce the amount of space needed to display the content relevant to the evolution of Worcester streetcar network. The display would show the outward advances and development of the city limits through time. Historic maps can be digitized and overlaid on bases, for example google maps, to show the current street layouts and the relation to the expansion of Worcester through time. In particular, maps from 1861, 1891, and 1919 have been digitized and are useful to display the growth of Worcester and it’s transit.
to further advance the users understanding of a particular line, location or subject in the city. This model can be used for several decades of interest to define the four periods of importance to show how each affects the city independently in different ways.
4.3 Origins: The Horse Tolley System
Urban transit in Worcester began with horse drawn trolley, Image 4.1 can be used to visually represent the start of horse transit in Worcester. Fundamentally, it is important for the user to understand what horse transit looks like and consists of.
Image 4.1: The common staff and equipment associated with horse drawn trolleys
The introduction of horse transit reshaped Worcester’s industrial and residential geography significantly. Previously, Worcester was confined to pedestrian limits, like most cities at this time they were walking cities. To get business patrons to walk to the store and to go to work, residents had to live in close proximity. The city was entirely modified as a
reflection in the advances in public transit. For the purposes of the digital display, Image 4.2 can be utilized to depict the early outward advances of the cities limits.
Image 4.2: A map of the city of Worcester in 1861
The map above, shows that Worcester was otherwise linear, until the use of horse trolleys. Main Street was a vital artery for the city. This map can show the rudimentary start of
Worcester during 1861. By outlining the routes on this map for the user, the outward growth from the Main street line can be understood, see Image 4.3.
Image 4.3: Worcester map outlining transit line additions in 1861
To distinguish the teaching points presented by a map a variety of colors, line weights or line types can be used with photoshop or other image manipulation software. The red line shows the walking route that Worcester was centered around before horse transit.
Railway Co. The blue lines represent the expansion of the horse trolley routes down Front, Lincoln, and Pleasant Streets.
The learning outcomes of this section is the expansion of the cities geometry. Because the Horse Trolley adequately allows commuters to travel, new regions of Worcester begin to prosper. In particular the south west area of the map can be developed into a secondary business center, specifically named the “New Worcester” on maps. This area would see the secondary growth of industry and then residential districts around Webster Square and Coes Reservoir. American Steel and Wire find success here establishing Worcesters “South Works”. As a result of its close proximity to the Main Street line residents are able to be transported efficiently to work in the wire manufacturing factory. Additionally, the blue lines allow for residential development from the Main Street centerline without compromising adequate commuting time for the employed members of each household.
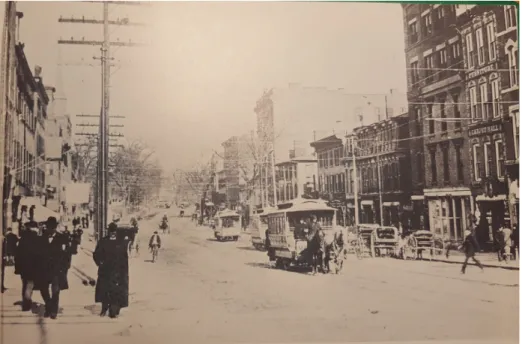
The user can better understand how the addition of the Front, Lincoln, and Pleasant lines contributed to the outward growth from the centerline, Main street. Furthermore, when the map is displayed on the digital display panel the user can click one of the outlined Transit routes to display additional information or images such as Image 18. This image shows a horse trolley pulling patrons down Main Street.
Image 4.4: A horse trolley pulling patrons down Main Street
Additionally, and image or text block pop up can be associated with a particular line so that it can be displayed at the user's discretion.This will help make the display less cluttered while being utilized but still containing the necessary content in the background.
Table 4.1: Horse Trolley Evolution
Date Line Service
September 1, 1861 Main St Lincoln Street Webster Sq Front Street November 3, 1863 Pleasant St Pleasant St
To Park Avenue 1890 Salisbury St Salisbury St To Boynton St
The growth of the Worcester directly correlates to the expansion of the Worcester Horse Railway Co. The relationship can be seen in Image 4.5. Through the use of two historic
maps the user of the digital map display can see the significant growth of Worcester over 20 years, while horse transit was prevalent. Secondary business districts were being established throughout the city, working immigrants were working the factories, and the increase in
residential development made sure there was no shortage of homes to house new immigrants.
Image 4.5: The expansion of Worcester Horse Railway Co. from 1861 to 1891
4.4 Toward the Lake: The Worcester and Shrewsbury or “Dummy” Railroad
The city was flourishing and for the first time families were able to relax. The addition of the dummy line in 1873, a smaller gauge track for horse transit, made frequent trips to Lake Quinsigamond on the weekend, commercializing recreation. Families would commute to spend
their weekends at social clubs and swim in the lake. Eventually in 1905 the White City Amusement Park was established. The dummy line switches back and fourth down the hill toward Lake Quinsigamond on the right side of Image 19. As a result of the dummy line running parallel to Shrewsbury Street, it can be compared to the 1861 map. The expansion down Shrewsbury street is important because it was an example of ethnic segregation. As new immigrants came to Worcester for work the need for residents was necessary. Many Irish immigrants moved to Shrewsbury street to meet there living needs, while also staying close with other families to their natural heritage and beliefs. Additionally, many Swedish families immigrated to Worcester to work the newly forming business districts across the city. The indirect segregations associated with the expanding development was vital in shaping
neighborhoods throughout Worcester. Demonstrating this through various texts and mapping prove crucial to understand the importance of urban transit to Worcesters expansion.
Table 4.2: Dummy Line
Date Line Service
July 31, 1873 Dummy Line Union St To
Lake Quinsigamond
4.2 Electrification and the Evolution of the Worcester Consolidated Street Railway
Through numerous consolidations of lines and companies the Worcester Consolidated Street Railway Company was forged. During the early 1890’s the existing lines were electrically converted and new tracks were constructed. From this period on Worcester's development and expansion explodes. Worcesters urban transit crosses city lines and connects neighboring towns to the heart of the city, while offering further suburban growth outward. Middle-class
and upper middle-class families begin to move outward as the cities energy intensifies leaving old tenant housing open for new immigrants. Secondary business districts, especially
consumer shops like groceries, begin to appear across the city. Ethnic segregation continues as the developmental expansion and occupational opportunity amplified. And for the first time there is no need to walk throughout the city because of the vast network of streetcars. During this time period Worcester became a streetcar suburb. Through the use of a digital mapping display a WHM patron can understand the relevance that electric streetcars had in the development of the city, see Image 4.6.
Through digitized mapping the user can see first hand how Worcester became the city it is over the 70 year period while streetcar transit was evolving. Using increments of decades from the start, 1861, to the demise, 1945, the user can visually and interactively understand the importance of mass transit in Worcester. Although the maps utilized in this report demonstrate 30 year increments the concept is important. Utilizing text descriptions or digitizing archived maps the WHM can physically represent the growth of the Worcester Consolidated Street Railway and inadvertently demonstrate the growth of the city. Additionally, the WHM can associate images and important text to the individual transit routes to expand the patrons opportunity to grow their knowledge on a particular subject.
Table 4.3: Electric Streetcar service routes
Date Line Service
September 2, 1891 Dummy Line Shrewsbury St To Belmont Street 1891 Worcester-Leicester-
Spencer Union Depot To Cherry Valley 1890 Salisbury St Salisbury St
To Boynton St 1893 Adams Square Line Adams Sq
To Main St 1893 Park Avenue Line Lincoln Sq
To Mill Street 1893 Quinsigamond Line Chadwick Sq
To Millbury St 1893 Fairgrounds Line Park Ave
To Union Depot 1893 New Square Line Newton Sq
To Union Depot 1893 Normal School Line Grafton Sq
To Eastern Ave 1893 Greendale Line Foster St
To Greendale 1893 Chadwick Square Line Foster Street
To