Open Research Online
The Open University’s repository of research publications
and other research outputs
A Cognitive Radio Compressive Sensing Framework
Thesis
How to cite:
Karampoulas, Dimitrios (2018). A Cognitive Radio Compressive Sensing Framework. PhD thesis The Open University.
For guidance on citations see FAQs.
c
2017 The Author Version: Version of Record
Copyright and Moral Rights for the articles on this site are retained by the individual authors and/or other copyright owners. For more information on Open Research Online’s data policy on reuse of materials please consult the policies page.
A Cognitive Radio Compressive Sensing
Framework
Dimitrios Karampoulas
BEng (Hons), MSc
A Thesis submitted in partial fulfilment of the requirements for the degree of Doctor of Philosophy
School of Computing and Communications
Faculty of Science, Technology, Engineering and Mathematics The Open University
Milton Keynes
Acknowledgements
I would like to express my deepest and sincerest gratitude to my supervisor Professor Laurence S. Dooley for his constant academic and moral support. His guidance, advice, comments and suggestions were tremendously valuable throughout this journey. His in-depth technical knowledge, expertise in scientific writing and unique ability to identify areas for improvement provided invaluable help to crystallization of ideas and production of this thesis. I am also immensely indebted to my co-supervisor Dr. Soraya Kouadri M. for her support and extremely valuable comments and advices. Her ability to look from a different perspective was crucial throughout the entire research.
My sincere gratitude also goes to Dr. Patrick Wong and the current and past members of the neXt Generation Multimedia Technologies (XGMT) research group at the Open University. They created a friendly environment for discussion and provided valuable comments during our Monday meetings. I am grateful especially to Parminder and Alam for their help they gave when I asked them for.
I would like also to thank my mini viva examiners Dr. Alan Jones and Dr. Tony Nixon for their comments and feedback during the initial phases of this project.
I also thank my children for their positive attitude and helping to focus on things other than research. In particular I also thank my son Sean for his advice with software packages.
Last but not least, I am deeply grateful to my adorable wife Nancy. She was instrumental to encourage and convince me to undertake this journey. The love, patience, compassion, support, flexibility and support were such, that it would be almost impossible to complete the thesis without them.
Abstract
With the proliferation of wireless devices and services, allied with further significant predicted growth, there is an ever increasing demand for higher transmission rates. This is especially challenging given the limited availability of radio spectrum, and is further exacerbated by a rigid licensing regulatory regime. Spectrum however, is largely underutilized and this has prompted regulators to promote the concept of opportunistic spectrum access. This allows unlicensed secondary users to use bands which are licensed to primary users, but are currently unoccupied, so leading to more efficient spectrum utilization.
A potentially attractive solution to this spectrum underutilisation problem is
cognitive radio (CR) technology, which enables the identification and usage of vacant bands by continuously sensing the radio environment, though CR enforces stringent timing requirements and high sampling rates. Compressive sensing (CS) has emerged as a novel sampling paradigm, which provides the theoretical basis to resolve some of these issues, especially for signals exhibiting sparsity in some domain. For CR-related signals however, existing CS architectures such as the random demodulator and
compressive multiplexer have limitations in regard to the signal types used, spectrum estimation methods applied, spectral band classification and a dependence on Fourier domain based sparsity.
This thesis presents a new generic CS framework which addresses these issues by specifically embracing three original scientific contributions: i) seamless embedding of the concept of precolouring into existing CS architectures to enhance signal sparsity for CR-related digital modulation schemes; ii) integration of the multitaper
spectral estimator to improve sparsity in CR narrowband modulation schemes; and iii) exploiting sparsity in an alternative, non-Fourier (Walsh-Hadamard) domain to expand the applicable CR-related modulation schemes.
Critical analysis reveals the new CS framework provides a consistently superior and robust solution for the recovery of an extensive set of currently employed CR-type signals encountered in wireless communication standards. Significantly, the generic and portable nature of the framework affords the opportunity for further extensions into other CS architectures and sparsity domains.
Declaration
The work presented in this thesis is an original contribution of he author. Parts of the thesis have appeared in the following:
Peer-Reviewed Publications:
Karampoulas, D., Dooley, L. and Mostéfaoui, S. (2013a) "Precolouring in Compressive Spectrum Estimation for Cognitive Radio", In IEEE EUROCON, pp. 1715-1720, Zagreb, Croatia, 1-4 July.
Karampoulas, D., Kouadri, S. and Dooley, L. (2013b) "A Novel Precolouring-Random Demodulator Architecture for Compressive Spectrum Estimation", In IET Intelligent Signal Processing, pp. 1-6, London, UK, 2-3 December.
Karampoulas, D., Dooley, L. and Kouadri, S. (2014) "Integration of a precolouring matrix in the random demodulator model for improved compressive spectrum estimation", In IEEEGlobalSIP, pp. 1209-1213, Atlanta, USA, 3-5 December.
Karampoulas, D., Dooley, L. and Kouadri, S. (2015) "A multitaper-random demodulator model for narrowband compressive spectral estimation", In IEEE
Table of Contents
List of Figures...viii
List of Tables...xiv
List of Abbreviations...xv
List of Variables...xviii
Chapter 1: Introduction 1.1Overview...1
1.2Spectrum Sensing for Cognitive Radio...3
1.3Research Motivation...5
1.4Research Question and Objectives...7
1.5Contributions...9
1.6Thesis Structure...11
1.7Summary...13
Chapter 2: Compressive Sensing for Cognitive Radio: A Literature Review 2.1 Introduction...14
2.2. A Brief Historical Review of Wireless Communications...15
2.3 Cognitive Radio...17
2.3.1 The CR Concept and its Tasks...18
2.3.2 Spectrum Sensing for CR...20
2.3.2.1 Spectrum Sensing Challenges for CR…...22
2.3.2.2 Spectrum Sensing Techniques for CR...24
2.3.2.3 Spectrum Estimation Methods for CR... 30
2.3.3 Summary...34
2.4 Compressive Sensing...35
2.4.1 Introduction...35
2.4.2. The CS Theoretical Framework...36
2.4.2.1 The CS Concept...36
2.4.2.2 Signal Recovery...39
2.4.3 CS Architectures...41
2.5 Discussion...47
Chapter 3: Research Methodology 3.1 Introduction...49
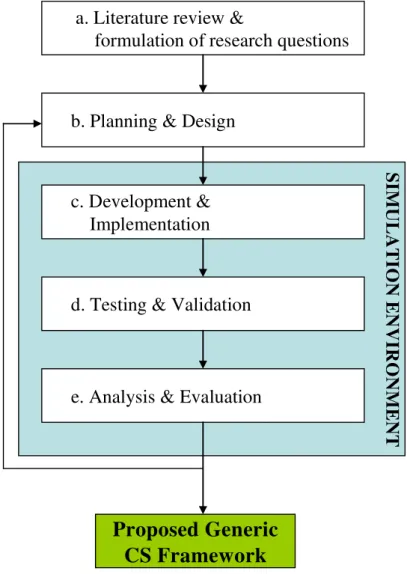
3.2 Overview of the Research Process...50
3.3 The Simulation Environment...52
3.3.1 Overview...52
3.3.2 Simulation Platform...53
3.3.3 Simulation Parameters...54
3.3.4 Simulation Blocks...57
3.4 Performance Evaluation and Metrics...59
3.5 Software Validation...62
3.6 Summary...63
Chapter 4: An Autoregressive-based Compressive Sensing Model for Spectrum Sensing 4.1 Introduction...64
4.2 The AR-based CS Model...65
4.2.1 The AR Filter and Precolouring Integration in the RD Architecture...66
4.2.2 The CM version of the AR-based CS Model...76
4.3 Simulation Setup...81
4.4 Simulation Results Discussion...82
4.5 Summary...95
Chapter 5: A Multitaper-based Compressive Sensing Model for Spectrum Sensing 5.1 Introduction...96
5.2 The MT-based CS Model...97
5.2.1 The MT Method and the RD-based MT-RD Architecture...98
5.2.2 The CM-based MT-CM Architecture...104
5.3 Simulation Setup...108
Chapter 6: A Walsh-Hadamard based Compressive Sensing Model
6.1 Introduction... 119
6.2 The WH-CS Model...120
6.2.1 The WH Transform and Sequency Sparsity...121
6.2.2 The RD and CM versions of the WH-CS Model...124
6.3 Simulation Setup...129
6.4 Simulation Results Discussion...131
6.5 Summary...138
Chapter 7: Integration of the AR, MT and WH based Models into a Generic CS Framework 7.1 Introduction...140
7.2 The UNI-CS Model...141
7.2.1 Spectral Classification...147
7.2.2 A Generic CS Framework...149
7.3 Simulation Setup...152
7.4 Simulation Results Discussion...153
7.5 Summary...159
Chapter 8: Conclusion...160
Chapter 9: Future Work...163
List of Figures
Figure 1.1: Block diagram of the generic CS framework...11
Figure 2.1: Basic Cognitive Radio cycle...19
Figure 2.2: Block diagram of a Matched Filter based technique...25
Figure 2.3: Block diagram of the Energy Detector...26
Figure 2.4: Block Diagram of a Cyclostationary feature detector...27
Figure 2.5: Block diagram of the FFT-based ED...28
Figure 2.6: Block diagram of multiband joint detection...29
Figure 2.7: Block diagram of a Wavelet-based detector...29
Figure 2.8: Block Diagram of an M-band filter bank...31
Figure 2.9: Filter frequency responses: (a) Prototype filter, (b) other filters...31
Figure 2.10: Block Diagram of the random demodulator...42
Figure 2.11: Block Diagram of the compressive multiplexer...45
Figure 3.1: Block Diagram of the Research Process and its various steps...50
Figure 3.2: Simplified diagram of a CR network...52
Figure 3.3:Simulation blocks...58
Figure 4.2: Block diagram of the AR-RD architecture. The dotted lines block
represents the classical RD structure...69
Figure 4.3: Block diagram of the iPM-RD architecture...74
Figure 4.4: Block diagram of the multi-channel (a) RD and (b) iPM-RD
architectures...76
Figure 4.5: Block diagram of the iPM-CM architecture...79
Figure 4.6: Block diagram of the generic AR-based CS model...80
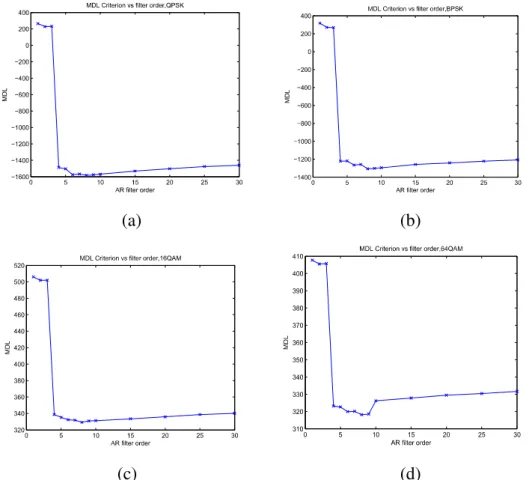
Figure 4.7: Variations in AR filter order using MDL for (a) QPSK,
(b) BPSK, (c) 16QAM and (d) 64QAM...83
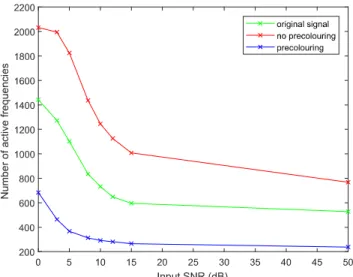
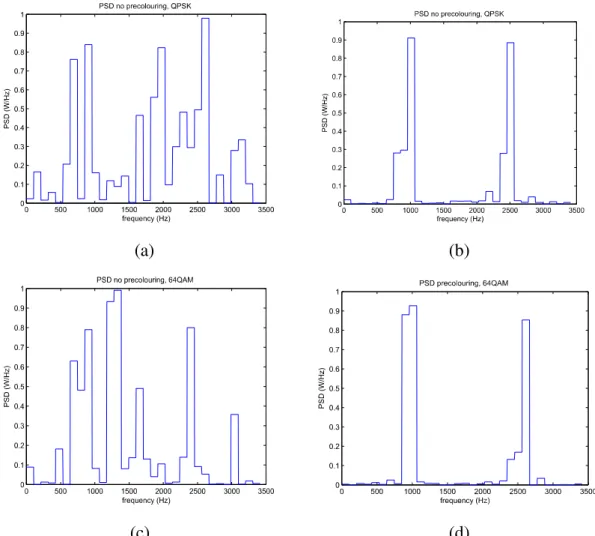
Figure 4.8: The effect of precolouring on sparsity of a QPSK signal using
algorithm 4.2...85
Figure 4.9:PSD spectral leakage vs sampling rate for classical RD
(no precolouring) iPM-RD (precolouring) architectures, with 2 carrier signals for (a) BPSK, (b) QPSK, (c) 16QAM and (d) 64QAM...85
Figure 4.10: The effect of precolouring on PSD spectral leakage derived by RD-based architectures for (a) QPSK, (b) BPSK, (c) 16QAM and (d) 64QAM test signals for various input SNR values...87
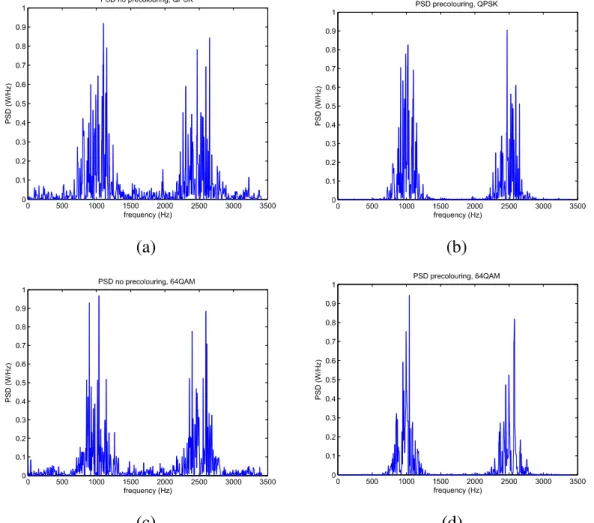
Figure 4.11:Recovered normalised PSD for QPSK (a), (b) and 64QAM (c),
(d) modulations, at a sampling rate 50.5% Nyquist...88
Figure 4.12: Recovered normalised PSD derived from RD-based architectures for QPSK (a), (b) and 64QAM (c), (d) modulations, at a sampling rate 3.15625%
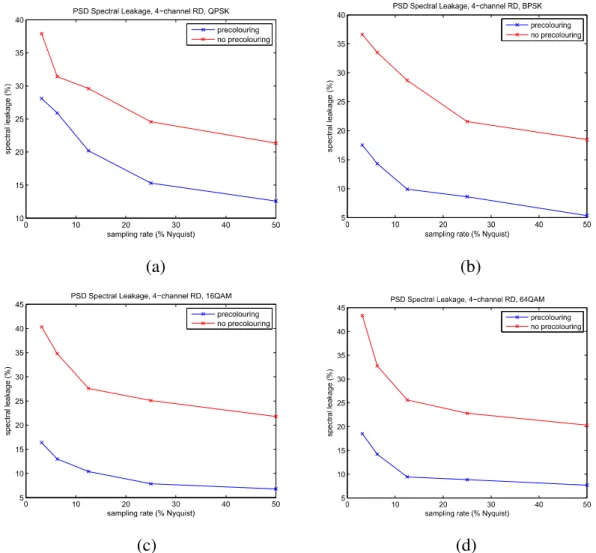
Figure 4.13:PSD spectral leakage vs sampling rate for multi-channel classical RD
(no precolouring) and multi-channel iPM-RD (precolouring) architectures...90
Figure 4.14: The effect of precolouring on PSD spectral leakage derived by multichannel RD-based architectures for (a) QPSK, (b) BPSK, (c) 16QAM and (d) 64QAM test signals for various input SNR values...91
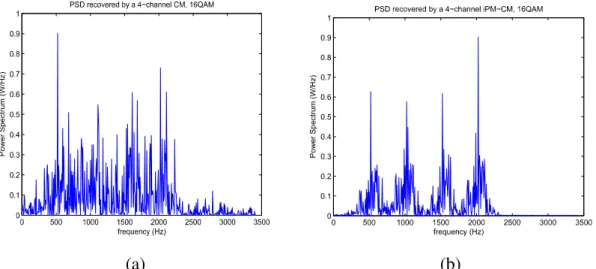
Figure 4.15:Recovered normalised PSD derived from (a) 4-channel RD, (b), (c), (d), 4-channel iPM-RD...92
Figure 4.16. The effect of precolouring on sparsity of QPSK signal using algorithm 4.3...93
Figure 4.17: Effect of precolouring on PSD spectral leakage derived by the classical CM and iPM-CM architectures for (a) QPSK, (b) BPSK, (c) 16QAM and (d) 64QAM test signals...94
Figure 4.18:Recovered normalised PSD derived (a) from classical CM and (b) from the iPM-CM for 16QAM modulation scheme...94
Figure 5.1: Block diagram of the MT-RD architecture...103
Figure 5.2: Block diagram of the MT-CM architecture...106
Figure 5.3: Block diagram of the generic MT-based CS model...107
Figure 5.4. The effect of the MT method on sparsity of an AM signal using algorithm 5.1...110
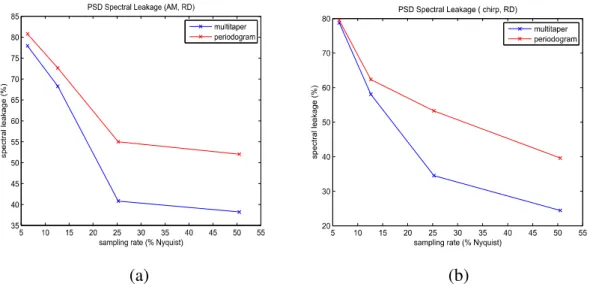
Figure 5.5: PSD spectral leakage vs sampling rate for classical RD (periodogram-based) and MT-RD architectures with (a) AM and (b) chirp signals...111
Figure 5.6: PSD spectral leakage vs input SNR for classical RD (periodogram based) and MT-RD architectures with (a) AM and
(b) chirp signals...111
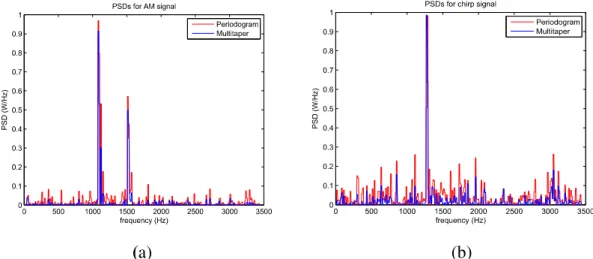
Figure 5.7:Recovered normalised MT-RD and periodogram-based PSD for
(a) AM and (b) chirp signals at 25.25% Nyquist rate and -3dB input SNR...112
Figure 5.8: Recovered normalised PSD for (a) classical RD and (b) MT-RD
at 25% Nyquist rate and -3dB input SNR...113
Figure 5.9: The effect of the MT method on sparsity of AM signals
using algorithm 5.2...113
Figure 5.10: PSD spectral leakage vs input SNR for classical CM (periodogram based) and MT-CM architectures with (a) AM and
(b) chirp signals...114 Figure 5.11:Recovered normalised PSD derived from CM (periodogram-based) and MT-CM architectures for (a) AM and (b) chirp signals at 8.1dB
input SNR...114
Figure 5.12:Recovered normalised PSD derived from CM (periodogram-based) and MT-CM architectures for (a) AM and (b) chirp signals at 3dB input SNR...115
Figure 5.13: Recovered normalised PSD for (a) classical CM and (b) MT-CM
at -3dB input SNR...115
Figure 5.14: PSD spectral leakage vs (a) sampling rate and (b) input SNR
with QPSK signal and for classical RD (periodogram) and MT-RD (multitaper)...116
Figure 5.15:PSD spectral leakage vs input SNR for classical CM and MT-CM
Figure 5.16: Recovered normalised PSD of QPSK signal for (a) classical RD,
(b) MT-RD, (c) classical CM and (d) MT-CM...117
Figure 6.1: Block diagram of the WH-RD architecture...126
Figure 6.2:Block diagram of the WH-CM architecture...128
Figure 6.3:Block diagram of the generic WH-CS model...129
Figure 6.4. The effect of WH-based CS in signal sparsity of CDMA encoded QPSK signals using algorithm 6.1...132
Figure 6.5. The effect of WH-based CS in signal sparsity of CDMA encoded QPSK signals using algorithm 6.1...132
Figure 6.6:Normalised PSD (a) and SPS (b) of the baseband version of a Walsh-encoded QPSK signal...133
Figure 6.7: Signal PSD (a) and SPS (b) for a CDMA encoded and scrambled QPSK signal...134
Figure 6.8: Normalised PSD (a) and SPS (b) of the passband version of a Walsh-encoded QPSK signal...135
Figure 6.9: Comparison of system SNR performance for (a) classical RD vs WH-RD and (b) classical CM vs WH-CM architectures...135
Figure 6.10:The PSD (a) and SPS (b) graphs for a CDMA forward link signal with 4 active channels...136
Figure 6.11:SPS graphs of CDMA forward link signal derived by a WH-RD architecture with (a) 1024, (b) 512, (c) 256, (d) 128, (e) 64 and (f) 32
Figure 6.12:The SPS (a) and PSD (b) graphs for 2 CDMA forward link signals
with 8 active channels...138
Figure 7.1: Block Diagram of the UNI-RD architecture...143
Figure 7.2: Block Diagram of the multi-channel UNI-RD architecture, with J channels...144
Figure 7.3: Block Diagram of the UNI-CM architecture...146
Figure 7.4: Block diagram of the generic UNI-CS model...147
Figure 7.5:The Generic CS Framework...150
Figure 7.6. The effect of precolouring on sparsity of an OFDM signal using algorithm 7.1...153
Figure 7.7. The effect of precolouring on sparsity of an OFDM signal using algorithm 7.2...154
Figure 7.8:PSD spectral leakage vs sampling rate for (a) LTE Advanced, (b) 802.11af standards, with RD, UNI-CS 4th order and UNI-CS 8th order employed....155
Figure 7.9:PSD spectral leakage vs input SNR for (a) LTE, (b) 802.11af standards, with RD, UNI-RD 4th order and UNI-RD 8th order employed...155
Figure 7.10:PSD spectral leakage vs input SNR for (a) LTE (b) 802.11af standards, with CM, UNI-CM 4th order and UNI-CM 8th order employed...156
Figure 7.11:Comparison of PSD graphs for (a) classical RD, 4th order UNI-RD and (b) 4th order UNI-RD and 8th order UNI-RD with LTE signals...157
Figure 7.12:Comparison of PSD graphs for (a) classical RD, 4th order UNI-RD and (b) 4th order UNI-RD and 8th order UNI-RD with 802.11.af signals...157
Figure 7.13:Comparison of spectral classification performance of RD, 4th order UNI-RD and 8th order UNI-RD...158
Figure 7.14:Comparison of spectral classification performance of CM, 4th order UNI-CM and 8th order UNI-CM...158
List of Tables
Table 3.1: Simulation Platform and PC Specifications...54
Table 3.2: Simulation Parameters and their values or characterization...57
Table 4.1: MDL values and corresponding AR filter latencies...84
Table 4.2:PSD spectral leakage comparison for AR-RD, iPM-RD and RD
List of Abbreviations
1G 1st generation 2G 2nd generation 3G 3rd generation 4G 4th generation 5G 5th generationADC Analog to Digital Conversion/ter AIC Akaike Information Criterion
AM Amplitude Modulation
AR Autoregressive
AR-CM Autoregressive with Compressive Multiplexer AR-RD AutoRegressive with Random Demodulator ARMA AutoRegressive Moving Average
AWGN Additive White Gaussian Noise BPSK Binary Phase Shift Keying
BS Base Station
CAT Criterion Autoregressive Transfer CDMA Code Division Multiple Access
CM Compressive Multiplexer
CR Cognitive Radio
CS Compressive Sensing
DFT Discrete Fourier Transform DSA Dynamic Spectrum Access
ED Energy Detector
FB Filter Bank
FCC Federal Communications Commission FFT Fast Fourier Transform
FM Frequency Modulation
FPE Final Prediction Error GPS Global Positioning System
iPM-RD integrated PM to RD
iPM-CM integrated PM to CM LAN Local Area Network/s
LTE Long Term Evolution
MAN Metropolitan Area Network/s MDL Minimum Description Length MLE Maximum Likelihood Estimation
MS Mobile Station
MT Multitaper
MT-CM Multitaper with Compressive Multiplexer MT-RD Multitaper with Random Demodulator MTS Mobile Telephone Service
MWC Modulated Wideband Converter Ofcom Office of Communications
OFDM Orthogonal Frequency Division Multiplexing
PM Precolouring Matrix
PM-MT Precolouring - Multitaper
PN Pseudorandom Number
PSD Power Spectral Density PSK Phased Shift Keying
PU Primary User/s
QAM Quadratur Amplitude Modulation QoS Quality of Service
QPSK Quadrature Phase Shift Keying RAN Regional Area Networks
RD Random Demodulator
RIP Restrictive Isometry Property
RMS Root mean square
SCF Spectral Correlation Function SDR Software Defined Radio SNR Signal to Noise Ratio
SPS Sequency Power Spectrum
SU Secondary User/s
TDL Time Delay
TVWS TV White Spaces
UNI-CS Unified with Compressive Sensing
WH-CS Walsh Hadamard with Compressive Sensing WH-CM Walsh Hadamard with Compressive Multiplexer WH-RD Walsh Hadamard with Random Demodulator WHT Walsh Hadamard Transform
List of Variables
a
Signal representation in the Fourier domaina
k The k th AR filter coefficient∆
f
Frequency resolution∆
t
Sampling intervalλ
m Them
theigenvalue of the MT spectral estimator
2 w
σ
White noise varianceΦ
Measurement matrix in a CS framework/architectureΦ
j The jth diagonal measurement matrix of a CMΨ
Sparse basis in a CS frameworkb
Bandwidth per carrierB
Signal bandwidthc
k The kth
element of the precolouring matrix
C
Precolouring matrixf
F
requencyf
C The precoloured frequency vectorf
CMT The PM-MT frequency vectorf
MT TheMT frequency vectorf
l Thel
th frequency vector l kf
Thek
th element of thel
th frequency vectorF
DFT matrixF
C Precoloured DFT matrixF
MT MT DFT matrixG
Recovery matrix of the classical RDG
C Recovery matrix of the AR-RD and iPM-RDG
CMT Recovery matrix of the UNI-RDG
ΜΤ Recovery matrix of the ΜΤ-RDG
CM Recovery matrix of the classical CMCM C
G
Recovery matrix of the iPM-CMCM CMT
G
Recovery matrix of the UNI-CMCM
H
G
Recovery matrix of the WH-CMCM MT
G
Recovery matrix of the ΜΤ-CMh
Signal representation in the WH domainH
WHT matrixH(f)
Filter frequency responseH
N Hadamard matrix of orderN
J
Number of channels in a CS architectureK
Number of non-zero coefficients (signal sparsity)L
Number of Slepian sequenciesM
Number of CS measurementsM
α
Sampling rate of the RDN
Number of signal samples taken at Nyquist frequencyN
α
Sampling rate at least equal to Nyquist rateℕ
The set of natural numbersp
The AR filter orderp
c Chipping sequenceP
Power Spectral Density (PSD) vectorP
C The precoloured PSD vectorP
CS Signal power recovered by CS architecturesP
CMT The PM-MT PSD vectorP
H The Sequency Power Spectrum (SPS) vectorP
MT The MT PSD vectorP
Nyq Signal power derived at rates equal or above NyquistP
total Signal plus noise powerq
Combined representation of the CM input in the Fourier domainq
C Combined representation of the iPM-CM input in the Fourier domainq
CMT Combined representation of UNI-CM input in the Fourier domainq
H Combined representation of WH-CM the input in the WH domainq
MT Combined representation of MT-CM the input in the Fourier domainN
H i
r
Thei
throw of Hadamard matrix of order
N
s
Signal representation in a sparse basis/domainS
The MT matrixt
Signal durationT
Random demodulator data periodT
1 Average input noise levelT
2 RMS of signal PSDv
cs Spectral classification vectorv
ref Reference vectorV
lThe
l
theigenvector determined by the MT spectral estimator
w
White noise processW
Resolution of the MT spectral estimator1
Introduction
1.1.
Overview
In the last decade, wireless communication has been undergoing rapid development, with mobile devices becoming an essential element of people’s daily lives. As new technologies emerge, wireless services and applications are commensurately expanding, with mobile data traffic having grown 4000-fold over the past decade and 400 million times over the last 15 years (CISCO, 2016). Almost half a billion mobile devices and connections were added in 2016, with smartphones accounting for the most of that growth, raising the total global number of mobile devices to 8 billion in 2016 (CISCO, 2017a). More growth is anticipated in the future as global Internet traffic is predicted to increase nearly threefold by 2021, while traffic from wireless and mobile devices will account for almost two-thirds of this expansion (CISCO, 2017b).
This condition will dramatically increase the need for high data transmission rates, thus making it increasingly challenging to accommodate this expanding and emergent wireless world using the existing finite available spectrum, and deliver the required
quality of services (QoS). The problem is further aggravated by the inflexible licensing of the wireless spectrum by the regulatory bodies to the telecommunications operators, the so-called licensed or primary users (PU) in the sense that the licensing is exclusive and no violation is allowed by unlicensed or secondary users (SU)(Ben Letaief & Zhang, 2007).
As a result, spectrum is an extremely scarce and valuable resource. It is estimated that in the US the licensed spectrum available for the mobile wireless industry is valued around US$500 billion (CTIA, 2016). In the UK the annual contribution in the spectrum to the economy was in 2014 over £50bn and is expected to double by 2025 (Real Wireless, 2015). Despite the spectrum scarcity and rigid regulations, the available spectrum is highly underutilized (Federal Communications Commission, 2002; Broderson et al. 2004) In particular, the degree of spectrum utilization ranges from 15% to 85% (Federal Communications Commission, 2002) in New York City
the maximum total spectrum occupancy is 13.1% from 30MHz to 3GHz (McHenry, 2005), while in the UK the Wi-Fi spectrum usage reaches 16% (Ofcom, 2013).
The observed spectrum underutilization allied with key technology developments in digital radio and computer software (Tuttlebee, 2002; Milligan, 2003), have prompted regulatory bodies like the Federal Communications Commission (FCC) (FCC, 2004) and the Office of Communications (Ofcom, 2007) to promote a completely different approach, where SU are allowed to opportunistically access and utilize unused licensed bands, referred to as spectrum holes or white spaces (Nekovee, 2010). This concept is called dynamic spectrum access (DSA) (Nekovee, 2006; Marcus, 2005) and leads to a more efficient utilization of the available spectrum. A special IEEE committee was established in 2005 to develop the IEEE 1900 regulatory series standards for DSA networks (IEEE DySPAN, 2017). Moreover, OFCOM proposed a spectrum sharing framework which introduced regulatory tools that facilitated spectrum sharing and evaluated the potential of sharing frequencies between PU and SU (OFCOM, 2015; OFCOM, 2016). Likewise, FCC introduced a 3-tier spectrum sharing framework where both PU and SU were assigned a priority spectrum access status and then subsequently placed into one of the 3 tiers (FCC, 2015).
A promising technology which offers mechanisms to improve spectrum utilization is cognitive radio (CR) (Mitola & Maguire, 1999; Mitola, 2000). The spectrum utilization is implemented in an autonomous manner (Haykin, 2005) by firstly, identifying the unused licensed radio spectrum and then, rendering this spectrum available for SU, while not causing any harmful interference to the PU, thereby respecting, at all times, their rights as the licensed operators. In order to facilitate this opportunistic spectrum access to SU, a CR transceiver needs to be aware of its radio environment and using this information it can then select and accordingly adapt its various communication parameters e.g., bandwidth, carrier frequency, modulation scheme, transmit power and networking parameters (Hossain & Bhargava, 2007).
There exist three methods for a CR transceiver to reliably identify white spaces (spectrum holes) without generating PU interference (Nekovee 2010; Brown, 2005): i) beacon signals, ii) geolocation with database, and iii) spectrum sensing. The beacon method requires dedicated infrastructure to be installed and maintained, while beacon signals can be lost due to mechanisms similar to the hidden node problem which may arise in wireless networks (Nekovee 2010). In contrast, the geolocation with database
approach is regarded by the regulators as offering a better short-term solution (Nekovee 2010; Webb, 2012), however, it requires modifications to the licensed systems and additional costly infrastructure for database construction and maintenance (Nekovee 2010; Ghasemi & Sousa, 2008). In addition, extra connectivity is required for information exchange between the SU and databases, as well as considerable management of participating parties (Webb, 2012). Crucially, as with the beacon signal solution, this method compromises the autonomous nature of a CR system, since the PU are under no obligation to share information regarding their operating parameters (Sun et al., 2013).
In the spectrum sensing approach, the identification of the spectral holes is accomplished solely by the SU in an autonomous manner (Haykin et al., 2009; Ghasemi & Sousa, 2008). After sensing a vacant licensed band, the SU can transmit on this band of frequencies provided the PU is not transmitting, so avoiding harmful interference. The infrastructure overheads are low and there is no need for any modification to the licensed systems. Consequently this has provided considerable impetus to investigate spectrum sensing by both researchers and industry, as evidenced by its inclusion in the IEEE 802.22, 802.11.af standards (Stevenson, 2009; Shellhammer, 2008; IEEE 802.22 Working Group, 2017; Flores et al., 2013). The spectrum sensing approach, its techniques and challenges is the subject of the following Section.
1.2.
Spectrum Sensing for Cognitive Radio
Spectrum sensing is one of the critical components in CR technology (Ghasemi & Sousa; Ben Letaief & Zhang, 2007; Sun et al., 2013; Lundén et al., 2015) in enabling the successful identification of frequency bands for SU to gain access to any vacant channels. Moreover, spectrum awareness and by implication, spectrum sensing is crucial to adapting CR communication parameters (Lundén et al., 2015).
Spectrum sensing, due to its importance, has to perform robustly and reliably even in severe communication environments (Ghasemi & Sousa, 2008). This coupled with the variable and random nature of wireless channels (Haykin et al. 2009), presents many challenges to CR spectrum sensing, including uncertainties due to noise,
sensitivity, interference and the hidden node problem (Nekovee, 2010), as well as the strict requirements governing sensing time, awareness, adaptability and reliability (Ghasemi & Sousa, 2008; Fette, 2004; Ben Letaief & Zhang, 2007).
These challenges and strict requirements could be relaxed if a cooperative
sensing strategy was to be employed, where multiple transceivers share their sensing results and mutually decide about the status of the spectrum bands (Ghasemi & Sousa, 2008; Ian F. Akyildiz et al., 2011). Even so, this incurs overheads like extra sensing time, delay, energy and infrastructure to accommodate the exchange of sensing information (Ghasemi & Sousa, 2008; Ian F. Akyildiz et al., 2011). In any case, the overall spectrum sensing performance of a CR network, even in a cooperative environment, is dependent on the performance of each of the CR transceivers of the network and the effectiveness of the spectrum techniques employed by them.
The most well-known techniques are matched filtering, energy detection, and cyclostationarity feature detection (Cabric et al., 2004; Yucek & Arslan, 2009; Sun et al., 2010). Energy-based detection is the most popular due to its simplicity and also does not require a priori knowledge of the input signal (Ben Letaief & Zhang, 2007; Hossain & Bhargava, 2007; Cabric et al., 2006; Doyle, 2009). This approach however, is considered as narrowband, in that the corresponding receiver systems are only capable of processing signals within a narrow bandwidth channel (Sun et al., 2013; Yucek & Arslan, 2009). Another common feature of these techniques is that the detection of the spectrum holes is a binary decision (Ben Letaief & Zhang, 2007; Haykin et al. 2009; Sun et al., 2013), meaning spectral bands are classified as either vacant or not.
However, to more efficiently exploit the presented spectrum opportunities, a CR network must also manage wideband signals operating over far wider frequency range from hundreds of megahertz to several gigahertz (Yucek & Arslan, 2009; Sun et al., 2013). This mandates the signal processing at much higher sampling rates, which may not be feasible if conventional techniques are applied (Tian & Giannakis, 2007; Yu & Hoyos, 2009). In addition, the stringent system requirement of very short sensing times (Ghasemi & Sousa, 2008; Tian & Giannakis, 2007), means only a limited number of samples can be collected, which may be insufficient for reliable sensing performance (Tian, 2008).
Moreover, the binary decision for spectral band classification implies that the only possible decisions are for a band to be vacant (white) or occupied (black). However, a
band could also be classified as partially occupied (gray). Examples of such cases include low-power interfering signals (Haykin et al. 2009), underutilized channels (Cabric et al., 2006; Ariananda et al., 2009), or even mobile networks where PU transmissions are weak in an area where a SU is situated (Haykin et al. 2009). If only two occupancy states are considered, vacant or occupied, then these gray spectral bands would be identified as occupied and not as opportunities for the SU, certainly impacting the QoS of the CR network. Therefore, in order to also include the possibility of existence of gray bands and subsequently provide an accurate and efficient spectral classification, it is important to resort to sensing techniques that include spectrum estimation (Haykin et al. 2009).
Compressive sensing (CS) (Candès et al., 2006; Donoho, 2006) has emerged as a new signal acquisition paradigm. It is considered a type of sampling theory (Fornassier & Rauhut, 2015; Baraniuk et al., 2017), where signals which are sparse in some domain, can be efficiently be acquired and subsequently recovered in the sparse domain using relatively few measurements, with a sampling rate below that dictated by the Nyquist theorem (Kotelnikov, 1933; Nyquist, 1928). As the wireless communications signals are inherently sparse in the Fourier domain due to the spectrum underutilization, CS has the potential to address the challenges of the high sampling rates and the limited number of available signal samples. As the signal recovery is accomplished in the frequency domain, CS has also the potential to incorporate spectrum estimation. Collectively these CS opportunities underpin the key motivation for this research thesis.
1.3.
Research Motivation
Much research activity has followed the emergence of CS theory and the field has attracted considerable attention in various disciplines including wireless communications and CR (Baraniuk et al., 2017; Fornassier & Rauhut, 2015; Duarte & Eldar, 2011; Hayashi et al., 2013). Several architectures have been presented and implemented as hardware prototypes, such as the random demodulator (RD), the
tested with communications signals and been evaluated to have a potential impact for spectrum sensing for CR type signals (Lexa et al., 2012; Tropp et al., 2010; Eldar & Kutyniok, 2012).
Despite existing CS solutions, which could provide the basis for novel more efficient spectrum sensing schemes, in particular in combination with spectrum estimation methods, there are still many challenges to be resolved in achieving efficient and reliable spectrum sensing in CR networks. Some of these include:
a. Several CS architectures assume specific input signal types e.g. narrowband and their performance becomes ineffectual for signals with different features. This has major spectral sensing implications for the different type of signal encountered in wireless applications, where diverse modulation and access schemes are frequently applied.
b. The underlying spectrum estimation technique adopted in many CS architectures is based on the classical periodogram, which while simple to realise has a number of major deficiencies including being an inconsistent and biased estimator (Manolakis et al., 2005). Consequently, more sophisticated spectrum estimation methods have to be considered.
c. Given the low spectrum utilization, almost all the CS techniques exploit signal sparsity in the frequency domain. As CS for CR improves spectrum utilization, the sparsity level of wireless signals is reduced and it may not be sufficient enough to facilitate satisfactory CS performance. It is therefore a challenge to perform CS exploiting possible signal sparsities in domains other than Fourier.
d. Although several architectures have been presented with the aim to improve performance of the existing CS structures, these have come at the cost of additional complexity (Yu & Hoyos, 2009; Taheri & Vorobyov, 2011; Y. Lu et al., 2011; Zhao et al., 2011; Harms et al., 2013; Mangia et al., 2011). Moreover, due to the wideband nature of the
signals involved, there is always a need to achieve as low sampling rates as possible.
e. The ultimate aim of spectrum sensing for CR purposes is the classification of the spectrum. Since there is the possibility of the existence of three occupancy states, the binary decision is no longer applicable, so the CS-based designs must be capable of assigning three possible occupancy states to the spectral bands.
These challenges along with the general aim of improving sensing performance and robustness of CS-based designs for a range of diverse signals in CR, without crucially increasing processing complexity, were the main motivations for this research. These are important requirements to be addressed if CS is going to be effectively employed in CR networks, since they are related with crucial issues such as inclusion of diverse range of signals, exploitation of spectrum estimation methods, consideration of sparsities other than Fourier, reliable spectral classification and complexity. This provided the context for the overarching thesis research question and the related objectives which are presented in the next Section.
1.4.
Research Question and Objectives
From the above discussion, the following research question was framed:
How can spectrum sensing for Cognitive Radio-based be best achieved?
After a detailed literature survey and critical evaluation of existing CS techniques, a strategy combining energy-based spectrum sensing with CS was identified as a particularly promising area for further investigation, as it has considerable potential to achieve efficient and reliable classification of the spectral bands in CR applications. Such a strategy would lead to the design and development of novel spectrum sensing architectures that successfully address the challenges identified in Section 1.3, without
concomitantly imposing unfavourable overheads or trade-offs with the computational cost, hardware complex and the PU access.
A set of three research objectives were subsequently distilled to address the main overarching research question:
1. To develop and critically analyse new compressive sensing architectures for cognitive radio applications.
Justification: This objective focuses on investigating and designing novel CS architectures for wireless communication signals by particularly, exploiting their structure so to increase frequency sparsity. This will seek to address the challenge of very high sampling rate requirements which often push current analog to digital conversion (ADC) technology to its limits, especially for wideband signals. It also addresses the stringent timing requirements, which means that only a very limited number of signal samples are able
to be acquired. Furthermore, the CS architecture design must be flexible so it can handle different CR related signals as well as diverse modulation and radio access schemes. Finally it must be able to perform accurate and efficient spectral classification considering three occupancy states instead of two.
2. To critically synthesize spectrum estimation into the compressive sensing architectures.
Justification: This objective seeks to enhance the capabilities of the CS architectures in Objective 1 by integrating parametric spectrum estimation techniques into the spectrum sensing process for CR. The application of alternative non-parametric spectrum estimation methods instead of the established, but inconsistent periodogram provides the opportunity for more accurate and reliable information regarding spectrum utilization and occupation. There are in the literature spectrum estimators which are considered promising to be employed for spectrum sensing in CR applications, thanks to their favourable properties.
3. To design and critically assess the CS architectures so to perform sensing for signals which are not sparse in the frequency domain.
Justification: The Objectives 1 and 2 above, assume that the signals are frequency sparse. As CR improves spectrum utilization the spectrum becomes less sparse, which is not a favourable CS scenario because the basis for efficient sensing performance depends on the existence of sufficient signal sparsity in the frequency domain. Moreover, there are cases where wireless signals are not frequency sparse, as in the case of spread spectrum signal types like CDMA. Hence this objective seeks to extend the capabilities of the new CS architectures by examining the viability of performing CS for signals which are characterised by being sparse in other domains, rather than only the frequency domain.
The overall aim is to develop a new flexible CS framework, which provides consistently efficient and robust performance by exploiting signal structure and incorporating sophisticated spectrum estimation as well as extending CS functionality to domains other than frequency. The outcome is enhanced signal sparsity, which depending on the CS domain, can also be viewed as a noise reduction process.
1.5.
Contributions
To accomplish the aforementioned objectives, this thesis presents a novel robust and flexible generic Compressive Sensing framework, which comprises four original scientific contributions to the field of compressive sensing for CR networks. Initially a novel CS model exploits the structure of several signals typical in telecommunications in order to enhance their sparsity and subsequently provide some important framework performance enhancements. Then another novel CS model employs spectrum estimation more sophisticated than the periodogram to improve performance. The performance is further increased by unifying the two models and is also expanded by introducing sparsity domains other than frequency. The outcome of
the models is employed in spectral/channel classification which considers the existence of three occupancy states.
The four original scientific contributions of this thesis are as follows:
a. A new autoregressive (AR)-based CS model is introduced and critically analysed as a realisation of the research objective 1. The model addresses the challenge to extend the scope of the existing CS designs so to handle various signal types encountered in CR by utilizing their structure to increase their sparsity, thereby improving performance. The sparsity enhancement is accomplished by seamlessly integrating precolouring to the existing CS architectures.
b. A new multitaper (MT)-based CS model is also presented and critically analysed as a fulfilment of the Objective 2. The model seamlessly integrates the MT spectral estimator to existing CS architectures, thereby exploiting the inherent advantages of the MT method to enhance performance. Moreover, thanks to the non-parametric nature of the MT method, the performance does not depend on the signal structure.
c. The third contribution is the development of a Walsh-Hadamard
(WH)-based CS model, which attempts to address the Objective 3. It is based on signal sparsity in the Walsh-Hadamard (WH) domain and not the Fourier/frequency domain. WH sparse signals are encountered in wireless communications and they exhibit insufficiently low frequency sparsity to be handled by the conventional frequency-based CS architectures. It can be stated therefore that for such types of signals the WH-based CS model can considered as a sparsity enhancer. Due to the type of the sparsity, the model performs channel classification instead of spectrum, by extracting the structure of the signal in the WH domain. This facilitates the identification of the occupied and vacant channels, where the latter could be employed by a SU.
d. The fourth contribution is the unification of the AR-based and MT-based models resulting in an extended and more flexible unified CS (UNI-CS) model, which accordingly exploits the advantages offered by the precolouring process and the MT spectral estimator. The standard operation of the UNI-CS model is based on the MT estimator, while, depending on the type of the incoming signal, the precolouring process is activated.
The generic CS framework is realised by the parallel operation of the UNI-CS and WH-based models, as depicted in Figure 1.1. The RF input signal is firstly down-converted to the baseband before sampling, so the signal content is now between dc and some maximum frequency. The baseband signal is then used as the input to the appropriate CS models which generate information about the spectral and channel occupancy status respectively.
RF Tuning & Conversion to baseband RF Tuning & Conversion to baseband
UNI-CS
model
WH-based model Spectral classification input signal input signal Baseband 1 Baseband 2 Channel classification decision decisionFigure 1.1: Block diagram of the generic CS framework.
1.6.
Thesis Structure
The rest of the thesis is organised as follows:
a. Chapter 2 presents a historical background of CR systems, before a thorough literature review of different CR tasks and challenges is
presented, especially those pertaining to spectrum sensing. It also focuses on compressive sensing and presents and discusses the strengths and weaknesses of the most promising CS designs to be employed in CR applications.
b. Chapter 3 presents the research methodology employed in this thesis, including the description of the various CS architectures which constitute the proposed CS framework and their associated parameters. The chapter also presents and discusses the choice of the simulation platform, the different testing scenarios employed, along with performance metrics and software validation methods used.
c. Chapter 4 details the formulation of the AR-based CS model which is based on the precolouring process and for CS structures, the RD and CM. It describes the formulation and integration of a specific
precolouring matrix and elaborates on the choice of the relevant parameters. The performance is critically evaluated and compared against the classic RD and CM. Work from this Chapter has been published in (Karampoulas et al., 2013a; (Karampoulas et al., 2013b; Karampoulas et al., 2014).
d. Chapter 5 presents the MT-based CS model which integrates the sophisticated, nonparametric MT spectrum estimation method to it for both RD and CM. The formulation and integration of a specific MT matrix is described. The resulting RD and CM versions of the MT-based model are also critically evaluated and compared with the original RD and CM architectures. Work from this Chapter has been published in (Karampoulas et al., 2015).
e. Chapter 6 presents the WH-based CS model which is also based on the RD or CM structures, but instead of frequency, exploits sparsity in the WH domain, termed sequency. The performance of the resulting RD and CM versions of the model is investigated, critically evaluated and
compared against the frequency sparsity based counterparts and for non-frequency sparse signals.
f. Chapter 7 leverages from the key findings of Chapter 4 and Chapter 5
to propose the unified UNI-CS model able to exploit the advantages of both the precolouring process and MT spectrum estimator. The MT matrix is seamlessly integrated into the model, with precolouring determined from the input signal characteristics. The model is also critically evaluated as a spectral band classifier. Finally, the generic CS framework is presented as a parallel structure, where its branches are the UNI-CS and WH-based models respectively.
g. Chapter 8 presents some future directions and new research avenues that the new compressive sensing frameworkforCR systems provides.
h. Chapter 9 summarises the key findings emanating from the thesis.
1.7.
Summary
In this Chapter, the overarching research question and the three main research objectives have been framed to address some of the main challenges in spectrum sensing for CR, in particular those arising from the high sampling rates and stringent timing requirements. The next Chapter will present a comprehensive literature review of CR technologies and compressive sensing, and the role they play in intelligent spectrum sensing for wireless applications.
Chapter 2
Compressive Sensing for Cognitive Radio: A
Literature Review
2.1 Introduction
Over the last decade, the wireless devices and services have been ubiquitous and a vital component in every day life almost all over the globe (Scwhartz, 2005); Zheng & Cao, 2007). This pattern will continue over the span of the next 5 years and even greater expansion of services and growth of the number of the devices is anticipated. For instance, around 29 billion connected devices are forecast by 2022, of which around 18 billion will be related to Internet of Things (IoT), while the number of smartphones will jump from 3.9 billion in 2016 to around 6.8 billion by 2022. As a result, the mobile data traffic will increase sevenfold between 2016 and 2021 (CISCO, 2017c).
Consequently, the arising demand for higher capacity and transmission rates will likewise dramatically increase the need for extra bandwidth, thus putting huge pressure to the spectrum resources. The situation is getting worse if the conventional approach to spectrum management continues to be in force. It is very inflexible in the sense that each operator is granted by the government agencies an exclusive license to operate in a certain frequency band (Ghasemi & Sousa, 2008) rendering the spectrum a scarce resource. Since most of the available spectrum is already allocated (Ben Letaief & Zhang, 2007), if the conventional approach persisted, the spectrum would become even scarcer.
Despite the spectrum scarcity and inflexible regulations, the available spectrum is highly underutilized, which has driven the regulatory organizations to introduce the concept of unlicensed users who borrow or share the spectrum assigned to the license
holders (Marcus, 2005; Federal Communications Commission, 2004). The CR technology has the potential to exploit this more flexible regulatory concept, thereby solving the spectrum underutilization problem. However, the implementation of a CR network presents its own challenges pertaining to high sampling rates and strict timing requirements, respectively due to the nature of the wireless signals and the constraints imposed by the spectrum regulators.
The CS paradigm has come into view over the last few years and provides the theoretical framework to resolve the above issues pertain to the CR implementation, though the existing CS architectures have their own problems and limitations. This Chapter provides an overview of the CR, presenting the major tasks and challenges, while it discusses CS highlighting its potential and its own challenges to be employed in CR.
2.2. A Brief Historical Review of Wireless Communications
The advent of wireless communications can be traced back in the late 19th century when Heinrich Hertz in 1888 successfully demonstrated the generation and detection of electromagnetic waves and also in 1896-97 when Guglielmo Marconi successfully transmitted signals over hundreds of miles and demonstrated radio’s ability to provide continuous contact with ships sailing the English Channel (Miao, 2007; Rahman & Ibnkahla, 2005). The next important contributions to the field were the pioneering work of Nyquist in 1927, which was later followed by advances made by Shannon in 1948. The combination of their works gave birth to the field of information theory and is collectively known as the Nyquist-Shannon sampling theorem (Miao, 2007; Nyquist 1928; Shannon, 1949).
During the 20th century several milestones regarding wireless communications took place: The commercial amplitude modulation (AM) broadcast in the 20s, the invention of frequency modulation (FM) in the 30s, the first TV broadcast in the USA in 1929, the first BBC TV broadcast in 1936. Radio navigation systems have been already deployed in the 20’s, while the first satellite communication satellite was launched in 1963 (Maral & Bousquet, 2009).
In regards to mobile communications, the first commercialized system was the
Mobile Telephone Service (MTS) by AT&T in 1947, while the 1st generation analog (1G) cellular system was introduced in 1978 in the USA. A turning point was the adoption of digital technology by the 2nd generation (2G) system introduced in 1991. The shift to digital technology and the application of advanced signal processing which was not possible in the analog domain, paved the way for higher data rates, lower costs and greater channel and power efficiency. Moreover, in addition to the voice services, data services were introduced such as short messaging, email and internet access, while new mobile applications emerged. The new services coupled with lower costs, made the mobile devices popular and affordable for wider population.
The introduction of the 3rd (3G) generation systems in 2001, further enhanced the functional capabilities and enriched the array of the services provided to include among others multimedia and video streaming (Smith & Collins, 2007). Today the 4th generation (4G) systems are in operation with the first commercial system deployed in 2009, with even better operational characteristics and more services available such as mobile web access, video conferencing, mobile/IP TV, entertainment, cloud storage and others (Boccuzzi, 2008; Dahlman et al., 2014). In 2015 the next generation mobile networks (NGMN) Alliance published a white paper outlining the requirements and capabilities for the 5th (5G) generation system (Afif Osseiran et al., 2016), which is expected to make its appearance in 2020 (NGMN Alliance, 2015).
Analogous developments have taken place in the field of wireless networking. The wireless local area networks (LAN) have gone through a long way of development since the 1971 and today are every where from home to business applications. In addition the LAN concept has geographically expanded to included metropolitan area networks (MAN) as well as regional area networks (RAN) (Stallings, 2014; Guizani et al., 2015).
The proliferation of services and applications and their great market potential has led to the development of a great number of different standards for the above mentioned systems, which are not compatible with each other (Goldsmith, 2005). This situation along with the need to maintain and even improve quality of service (QoS) provided by the wireless communication systems, led to the emergence and realization of software defined radio (SDR) technology (Miao, 2007; Boccuzzi, 2008). The SDR devices are reprogrammable and reconfigurable and permit seamless
wireless connectivity and interface between wireless network services regardless of the standards applied (Miao, 2007; Boccuzzi, 2008; Grayver, 2013).
Despite the fact that the wireless technologies and systems described so far provide ever increasing data rates, the ever growing data rate demands stemming from the emergence of new applications and services, makes it increasingly difficult for them to keep up with the pace (Guizani et al., 2015). The manner the available spectrum is used makes matters worse, rendering it a valuable and scarce natural resource (Tomar et al., 2017). The CR technology and concept is a promising solution to address these challenges.
2.3. Cognitive Radio
There are two developments which contributed to the advent of CR. The first pertains to the findings reported by the FCC in 2002 (Federal Communications Commission, 2002; Kolodzy, 2001), according to which the radio spectrum was underutilized, namely:
a. Some bands are largely unoccupied most of the time b. Others are only partially occupied
c. The remaining bands are heavily used
The spectrum underutilization implies the existence of spectrum holes as discussed in Section 1.1. In (Kolodzy, 2001), a spectrum hole is defined as a “band of frequencies assigned to a PU, but at a particular time and specific geographical location, the band is not being utilized by the user”. As also mentioned in Section 1.1, the partially occupied bands are called gray bands and the heavily used ones are called black.
The observed spectrum underutilization has prompted FCC (Federal Communications Commission, 2002) and other regulatory bodies like Ofcom (Ofcom, 2007) to investigate and promote a radically different access paradigm, where unlicensed systems (SU) are allowed to opportunistically utilize the unused licensed (primary) bands assigned to a PU. The bands are commonly referred as white spaces.
The second development is the today’s realization of the SDR, thanks to sophisticated signal processing and the convergence of the key technologies of digital radio and computer software (Tuttlebee, 2002;Milligan, 2003), in the sense that the properties of carrier frequency, signal bandwidth, modulation and network access are defined by software (Fette, 2009).
CR, exploiting the already existing SDR platform, has been proposed as the means to promote the efficient use of the spectrum by exploiting the existence of spectrum holes (Mitola & Maguire, 1999; Mitola, 2000; Grayver, 2013; Tomar et al., 2017).
2.3.1. The CR Concept and Tasks
The concept of CR was first proposed by Joseph Mitola III in a seminar at the Royal Institute of Technology in Stockholm in 1998 and was published in an article (Mitola & Maguire, 1999). Later Mitola, in his dissertation (Mitola, 2000) described how a CR could enhance the flexibility of personal wireless services through a new language called the radio knowledge representation language. He followed his dissertation with the publication (Mitola, 2006) of a book on CR architecture. According to Mitola, a CR is software control and could orient itself by establishing priorities, create plans, decide and finally take the appropriate action in response to sensing of the RF environment of the outside world (Hossain & Bhargava, 2007).
Another CR approach was presented (Haykin, 2005), where the focus was in signal processing and communication aspects, rather in software. According to this approach, a CR is an intelligent wireless communication system that is aware of its surrounding environment. It is able to learn from its environment and adapts according to the incoming RF stimuli by making the necessary changes in certain operating parameters (transmit-power, carrier-frequency, modulation strategy) in real time. The objectives are highly reliable communications and efficient utilization of the radio spectrum. Based on this description, the following tasks are identified (Akyldiz et al., 2006):
a. RF sensing which basically encompasses the detection of the spectrum holes. It employs information about the RF stimuli of the surrounding radio environment.
b. Spectrum analysis is based on information about the RF stimuli and spectrum holes to build a model for the estimation of channel state information in order to predict the channel capacity to be used by the CR device.
c. Spectrum decision, where the information about channel capacity and spectrum holes is used to determine the parameters of the transmitted signal as well as the transmission time.
Through interaction with the RF environment, these three tasks form a CR cycle, which is depicted in its most basic form in Figure 2.1 (Haykin, 2005).
Radio environment RF sensing spectrum decision spectrum analysis RF stimuli RF stimuli spectrum holes spectrum holes signal transmission channel capacity
Figure 2.1: Basic Cognitive Radio cycle.
For the CR cycle to be successfully implemented, a CR must build upon an SDR system and add the capabilities of sensing, agility, flexibility and networking (Kolodzy, 2004). RF sensing is needed for the CR to be aware of its environment and gather the necessary information to detect the spectrum holes in order to change its operation parameters. A CR device needs to be agile so to be able to change the operating spectral band, while flexibility is required to change its waveform and configuration. Networking is useful for the CR devices to communicate with each other, cooperate, better understand the environment and thus make a more efficient
use of the spectrum resources (Fette, 2009; Ian F. Akyildiz et al., 2011). It is also important to stress that in principle, a CR must be able to
operate autonomously, since the PUs are not obliged to dispense their operating parameters (Sun et al., 2013;Haykin et al., 2009;Hossain & Bhargava, 2007).
2.3.2. Spectrum Sensing for CR
The task of detection of spectrum holes has acquired major importance in CR, since FCC (Federal Communications Commission, 2004) and Ofcom (Ofcom, 2009) have expressed their interest in permitting unlicensed access to TV white spaces (TVWS). Building on this interest, the IEEE has formed the IEEE 802.22 working group (IEEE 802.22 Working Group, 2017) to develop an interface for opportunistic secondary access to the TV spectrum.
In order to protect the primary systems from the adverse effects of SU’s interference, white spaces across frequency, in time and space should be reliably identified (Yucek & Arslan, 2009). The following approaches have been proposed to address this challenge (Nekovee, 2010; Brown, 2005):
a. Beacon signals. With the beacon method, unlicensed devices only transmit if they receive a control signal (beacon) identifying vacant channels within their service areas. The signal can be received from a TV station, FM broadcast station, or even a TV unlicensed transmitter. One issue with the control signal method is that it requires a beacon infrastructure to be in place, which needs to be maintained and operated. Another issue is that beacon signals can be lost due to effects similar to the hidden node problem (Nekovee, 2010), which occurs when the CR device is shadowed, in severe multipath fading or inside buildings which have high penetration losses, while a PU is operating in the vicinity (Nekovee, 2010; Ben Letaief & Zhang, 2007).
b. Geolocation Combined with Database: In this method, a secondary device determines its location and accesses a database to determine the channels that are vacant in a given location (Webb, 2012; (Carvalho et
al., 2015). The database is accessed by the primary devices systems and contains information about their locations, their transmitted power, current operating band and expected duration of its usage. This method is regarded by the regulators as a suitable short-term solution (Nekovee, 2010; Ofcom, 2012). However, there are a number of limitations associated with this method (Nekovee, 2010): Firstly, there is a need to build and maintain the database. Secondly, both primary and secondary devices need to know their locations with a prescribed accuracy, so they rely on accuracy and availability of systems like the GPS. Finally, additional connectivity and complexity is needed so the devices can access the database, either for updating or for getting information. In order to address these issues, additional costly modifications and infrastructure is required from the PU side (Ghasemi & Sousa, 2008). In addition, considerable management of the participating parties is required (Webb, 2012). Therefore, as with the beacon signal solution discussed in part a., this method compromises the autonomous nature of CR systems (see section 2.3.1).
c. Spectrum Sensing: Spectrum sensing for CR can be defined (Haykin et al., 2009; Tomar et al., 2017) as the task of finding spectrum holes and detecting interference by sensing the radio spectrum in the local neighbourhood of a CR receiver in an autonomous manner. By sensing and adapting to the environment, a CR is able to serve its users without causing harmful interference to the licensed user. Unlike the first two approaches, spectrum sensing, on the other hand, relies only on the secondary system to identify the spectrum holes, by directly sensing the licensed bands and switch its operation parameters to them. The infrastructure costs are comparatively low and there is no need for any modification to the primary systems. It is considered the most critical component in CR networks (Sun et al., 2013; Lundén et al., 2015). Hence the increasing attention to spectrum sensing by researchers and key industry stakeholders, as well its inclusion in the IEEE 802.22, IEEE 802.11af and long term evolution (LTE) advanced standards (Stevenson,