Understanding Free Software Developers: Findings
from the FLOSS Study
1Rishab Aiyer Ghosh
MERIT/Institute of Infonomics, University of Maastricht e-mail: [email protected]
Abstract: This chapter presents an overview of findings from the Survey of Developers from the FLOSS project, involving over 2700 respondents among free/open source software developers worldwide. The survey studied several factors influencing developers’ participation within the free/open source community, including their perceptions of differences within the community and with the commercial software world, personal, ethical, political and economic motives for participation, and their degree of interaction within and contribution to the free/open source software community. These results are linked to preliminary findings from a study of developer contribution to the Linux kernel based on an analysis of the source code.
1 The FLOSS project was funded by the European Union’s 5th Framework Programme (IST). The FLOSS
consortium comprised the International Institute of Infonomics/University of Maastricht and Berlecon Research, Berlin. In addition to this author, Ruediger Glott, Bernhard Krieger and Gregorio Robles were members of the Infonomics FLOSS team. Detailed results, the full questionnaire and analysis are in the FLOSS report (FLOSS 2002 Part IV). A version of this paper is included in “Making Sense of the Bazaar: Perspectives on Open Source and Free Software", ed. J. Feller, B. Fitzgerald, K. Lakhani & S. Hissam, forthcoming summer 2003, O’Reilly.
Table of Contents
1. Background... 3
1.1. The need for empirical data ... 3
1.2. Who can we survey? ... 4
1.3. Secondary sources... 5
2. Models and hypotheses... 6
2.1. Assumed motivations... 6
2.2. Assumed organization... 6
2.3. Assumed behaviour... 8
3. Conducting the FLOSS developer survey... 8
3.1. Methodology and sampling ... 8
3.2. Response rate and validation ... 9
4. What do we know now?... 10
4.1. Demographics: Married with children? ... 10
4.2. Motivation... 12
4.3. Organisation... 15
5. Subjective responses, objective data? ... 18
5.1. Do reported motives match reported rewards? ... 18
5.2. Other data sources... 22
6. Conclusion ...22
7. References... 22
List of Figures Table 1: A classification of organizational structures... 7
Figure 1: Current and starting age of developers... 11
Figure 2: Civil status of developers ... 12
Figure 3: “Selfishness” or “profit-seeking measure” of developers ... 13
Figure 4: Initial and current motivations for FLOSS development ... 14
Figure 5: Developers by motive class, as % of total developers ... 15
Figure 6: Leadership: Number of projects involved in, % of respondents ... 16
Figure 7: Number of projects involved in so far, % of respondents ... 17
Figure 8: Regular contact with other developers, % of respondents ... 18
Figure 9: Earning from FLOSS by motive class... 19
Figure 10: Income by motive class ... 20
Figure 11: Social activity rewards by motive class ... 21
1. Background
1.1. The need for empirical data
The phenomenon of Free/Libre/Open Source Software2 – the development of software through
collaborative, informal networks of professional or amateur programmers, and the networked distribution making it available to developers and end-users free of charge – has been widely and well documented. Editorials and policy papers have been written on the impact of the free software movement on the computer industry, business in general and the economy at large. However, few models have been developed that successfully describe, with supporting data, why or how the system works, or to explain the functioning of collaborative, productive networks without primary dependence on money.
Speculation is common regarding the monetary worth of such collaborative development, speculation which has translated into widely fluctuating share prices for the companies that have devoted much of their business plans to the free software philosophy. But hard data on the monetary value generated by this phenomenon is almost non-existent. Indeed, hard data on any aspect of the FLOSS phenomenon is rare. One reason for this lack of empirical data may be that in a very short period of time this phenomenon has attracted a lot of research attention. Researchers, and practitioners, have tended to be quick to detail how open source is (or is not) a revolutionary “new” form of something – programming, economic production, social interaction. These explanations have generally been based on anecdotal evidence or very small sample data – which doesn’t make them wrong, only hypothetical3.
Given that most models and techniques for economic evaluation and measurement require the use of money, the activity of non-monetary economic activity, such as free software, is left unmeasured, at least in any usefully quantifiable sense. Although there are studies and models for quantitative analysis of non-priced goods (e.g. the measurement of knowledge) in an economy they tend to be useful primarily in judging the influence of such goods within organisations, markets or
2 This paper uses the terms free software, open source software and libre software interchangeably, except where a
specific distinction is made clear in the text. Most often the term FLOSS is used – Free/Libre/Open Source Software. Although it was originally a project title rather than a generic neutral term for the class of software, many commentators and writers have adopted FLOSS as such a term since the publication of the final FLOSS project report in July 2002. It should be noted that despite the media and policy focus on “Open Source” (in English, at least), free software is a more popular term among developers themselves – see http://floss1.infonomics.nl/stats.php?id=1
3 Models and hypotheses are legion: e.g. “Cooking-pot market” (Ghosh 1998); “Bazaar” (Raymond 1998); “Gift
exchange” (Barbrook, 1998); “Users turning producer” (von Hippel 2001); “Rational – signalling” (Lerner and Tirole 2002); “Peer production” (Benkler 2002).
other socio-economic structures for which the common forms of measurement are clearly dominated by monetary indicators. Measurement is far more complex and ambiguous in a context where the essential and primary economic activity – the generation of free software through collaborative networks – is unusual in its avoidance of the use of money as mode of exchange.
The lack of empirical data is not surprising, though – it is extremely hard to collect, for several reasons. First, without monetary measures, other indicators of developers’ activity have to be used (indeed, defined in order to be used). While there may be some quantitative indicators that are objective in nature4, the lack of objective “census-type” sources means that many indicators,
quantitative or qualitative, may require the use of surveys. 1.2. Who can we survey?
This leads to an immediate problem – there is no universal, clearly recognized, objective data on the population that needs to be surveyed. While it may seem obvious, it bears emphasizing that there is no clear definition of who a free software developer is (other than someone who writes free software code); there is no universal list of all developers; there is no accurate information of the number of developers in existence or the growth in this number5. There is no census or national accounts database that lists the distribution of developers by their country of residence, age, income levels or the languages they speak.
The lack of a basic data set on the universal population that is taken for granted in surveys of many other groups is simply not available for FLOSS software developers, with the result that attempts to fill in our gaps in empirical factual data through surveys require a choice between three options:
1. Survey responses may be indicative of the general population, but only provide reliable data on the actual respondents
2. Survey responses reflect a pre-defined subset of the general population, providing insights into that subset, but certain responses may be a consequence of the pre-definition (pre-selection) process and thus not reflective of the general population
4 Such indicators may objectively answer at least part of the question defining transactions, “who is doing how
much of what with whom” that seems to fall apart when the “how much” is no longer monetary, apparently eliminating the need for actors to record their transactions. Non-monetary indicators are described in more detail in Ghosh 2003 and a methodology for extracting them in an objective form from free software source code is detailed in Ghosh 2002.
5 A study of the distribution of code productivity among developers was first performed in the Orbiten Survey
(Ghosh & Ved Prakash 2000) by studying a sample of source code, and also using a different method based on annotations provided by developers in a large software archive (see Dempsey et al 2002). Since then, statistics from developer portals such as Sourceforge.net provide at least the order of magnitude of the total developer population, if not accurate population size or demographic estimates.
3. Survey respondents are drawn randomly from the general population, thus while responses reflect the general population as a whole, they may not be representative of the general population for certain (especially demographic) criteria.
For completeness, the fourth, unavailable, option is also listed:
4. The ideal (but unavailable) option: survey respondents are drawn from the general population in order to be representative of the general population for certain criteria, e.g. age or nationality, thus leading to responses that reflect the general population and also follow the distribution (based on the representation criteria) of the general population.
The BCG/OSDN survey (BCG 2002) is an example of the second approach. By pre-screening respondents and inviting their response by e-mail, it clearly defined the subset of the general population from which the sample was drawn. As such, responses can be representative of the pre-screened sub-population, and even weighted in order to truly reflect the defined population subset. However, the results say little about the general population beyond the defined subset, as it was not sampled at all. Indeed, some results, such as nationality, years of experience or political attitudes may result from the pre-selection criteria6 and while providing interesting detail on the sub-population
cannot be generalized to the universal free software developer.
As is described previously, for the FLOSS developer survey we chose the third option. 1.3. Secondary sources
That empirical data on FLOSS developers is not only difficult to collect, but once collected may also be somewhat unreliable, is perhaps a reason to try to find secondary sources to match subjective empirical data, and methods of validating them (it also provides a handy excuse for papers that do not cite empirical data!)
Such secondary sources include not just objective data resulting from analysis of source code7,
but also more conventionally reliable surveys – of, for instance, institutions that use free software. Such surveys can be conducted in an orthodox fashion, using industrial databases or public census records to build stratified representative samples, as was done in the FLOSS Survey of User
6 In comparison to broader surveys (FLOSS; Robles et al 2001, which describes 5000+ respondents; Dempsey et al
2002), the BCG/OSDN survey showed a higher degree of US participants, more developers with several years of experience, and less animosity towards proprietary software companies. This may be related to the pre-selection criteria, which specifically included developers in mature projects on Sourceforge – a US-based, “open source” portal. A sample that included, say, low-contribution developers on Savannah – a Free Software Foundation portal and hence more politically conscious – could have led to fairly different results.
Organisations8. Institutional surveys are immensely useful in themselves, to study the large-scale use
of free software, but they can also provide data on organisations’ relationships with developers that, with some “triangulation”, can corroborate the results of developer surveys.
2. Models and hypotheses
The FLOSS developer survey aimed to provide data that would support (or refute) the several anecdote-based models of FLOSS development that exist. Broadly, hypothetical models of free software developers aim to understand the motives of developers, determine the structure of their interaction and predict their resulting individual and collective behaviour. (Some models are less concerned about precise motives, e.g. Ghosh 1998 only claims that altruism is not a significant motive; Benkler 2002 argues that specific modes of organization, rather than motives, are important.)
The survey aimed to test the assumptions made by many models, and collect a set of data points that could be used to validate or improve such models.
2.1. Assumed motivations
Are developers rational, and if so, are they altruistic, or self-interested? Are they driven by a profit motive, and if so, is it a monetary or non-monetary one? Do they want to be famous? Are they writing free software to signal their programming proficiency in the job market? Or do they just want to fix a problem for their own use? Are they mainly interested in having fun? Is Programming artistic self-expression? Or is it self-development, a distributed university? Or a community experience, where the pleasure is in giving to others? Are developers politically driven, wanting to destroy large software companies or even the notion of proprietary software and intellectual “property”?
Most models of FLOSS development assume one or another of these motives as the key driver. In fact, it turns out, the truth is all of the above, combined in different proportions for different people. The survey questionnaire had several questions dealing with motivation, some of them with overlapping responses – as people don’t always think consciously about their motives, repetition and different phrasing help draw out more data and add perspective. See section 4.2 for a discussion of the results.
2.2. Assumed organization
When any group of individuals interact, the structure of their interaction is a strong determinant of their effectiveness and output. Organizational structure may be a result of the motives of individual participants; it may also prompt or create certain motives (e.g., in a strictly hierarchical
8 FLOSS 2002 Part I. This survey of 1452 industrial and public sector organisations in Europe on their use of open
source software is beyond the scope of this paper. However, the FLOSS user survey did query organisations on their motivations for use, and also their support of developers, corroborating some of the results of the FLOSS developer survey. See also section 5.2
organization, getting to the top may be an important motive; in a flat organization being “on top” may have fewer benefits and thus be less motivating.)
Organizational structure is a predictor of behaviour, though, and many models of free software development use an assumed organizational structure in order to predict behaviour. Benkler’s “peer production” depends fundamentally on structural assumptions; Lerner and Tirole’s “Simple Economics” does not directly depend on a certain organizational structure in FLOSS developer communities, but it does require that the structure facilitates the spread of reputation (as signaling) within the community and beyond, to the employment market (thus also assuming a “meta-structure” linking the FLOSS community to the priced economy directly via the job market). The “cooking-pot” model and the “bazaar” (Raymond 1998), though, are more tolerant of different organizational structures.
In the context of free software developer communities one could classify organizational structure on the axes of hierarchy, modularity and connectivity (see table 1). Here modular/integrated refers to the extremes in the integrated nature of the production, while connectivity refers to the integrated nature of the interaction (or social links, which may or may not lead to integrated products) – so this is not just the organizational structure of a community, but of a productive community. Of course the examples given in each box are somewhat arbitrary, as not all boxes can be reasonably filled in and retain relevance to the context of FLOSS development.
Table 1: A classification of organizational structures
Modular,
connected Integrated, connected Modular, non-connected Integrated, non-connected
Hierarchy Cabal/inner circle
(bazaar), “Simple Economics” (signaling)
Commercial
(cathedral) Benevolent Dictator (bazaar) Commercial
Flat “Peer production”
with reputation, “Cooking-pot market”9
“Hive mind” “Peer production”
(bazaar) ?
Organizational structure can be determined to some extent (and even objectively) by analyzing source code, which allows the measurement of modularity, obviously, but also the degree of connectivity and even hierarchy (using concentration of contribution as a proxy) through the identification of authors and clusters of authorship.10
9 Though the cooking-pot market model (Ghosh 1998) does not assume a specific model of organisation, it does
predict connectivity and the use of such things as reputation, which would fit well with this category box.
Otherwise, determining organizational structure empirically, on a large scale, is hard11.
Through a developer survey, it can be estimated by asking about the number of projects a developer participates in, degree of collaboration with other developers, and leadership positions. Section 4.3 has a discussion of the relevant FLOSS survey results.
2.3. Assumed behaviour
Behaviour, individual or collected, is what models aim to predict, so empirical data plays a valuable role here in testing the validity of models. Most such data is likely to result from objective studies of developer communities, such as the dynamic study of the developers and components of the Linux kernel in the LICKS project12. From developer surveys, especially if conducted repeatedly over
time, it would be possible to determine whether certain types of behaviour occur as predicted by models, or indeed as predicted by developers’ own responses to other questions.
This is useful in order to validate the strength of reported motivations – e.g. it is harder to believe those who claim money is not a motivation if they also report high earnings from their FLOSS software. At the very least one might expect, from the point of view of consistency, that developer’s motives change over time based on the rewards (or lack thereof) they receive through their efforts. Indeed the FLOSS developer survey attempts to measure this dynamic aspect of motivation by asking what motivated developers when they first joined the community, in addition to their motivations for continuing participation. Naturally as both questions are asked at the same time, this relies on developers’ memory.
Other aspects of behaviour that can be measured relate to developer’s planned future actions (as reported), for instance with relation to the job market. Sections 4 and 5 elaborate on this topic through the lens of the FLOSS survey.
3. Conducting the FLOSS developer survey
3.1. Methodology and sampling
Early in the design of the FLOSS survey methodology we faced the question of sampling: was it possible to survey a representative sample of developers? The question actually has two parts: is it possible to ensure that respondents are developers, and is it possible to identify a sample that is representative of developers based on some filtering criteria? Let’s take the second question first.
Our conclusion, as described previously, was that there is insufficient empirical data on FLOSS software developers to identify the criteria of sampling. However, without empirical data as a
11 There have been small-scale studies of the organisational structure of the Apache, Jabber, Mozilla and other
projects.
basis it is not possible to demonstrate that a chosen sample of respondents is representative of developers in general: i.e. it isn’t possible to sample developers and know with any confidence that the distribution of nationalities, age, or income levels is representative of the distribution in the total (un-sampled) population of developers.
Therefore, we decided that in order to have results that would have empirical validity for the universal population of developers, we would have to attempt a random sample. The survey was self-distributing – i.e. it was posted to various developer forums, and then re-posted by developers to other forums, many of which are listed on the workshop website. The survey announcement was translated into various languages, to correct possible biases inherent in an English-language survey announced only on English-language websites13. We can state confidently that the survey was seen by a very large
proportion of all developers (it was announced on Slashdot, among other places) and therefore the sample that chose to respond was random, though with some identifiable bias (including, as with any voluntary survey, self-selection).
Having drawn a random sample, we had to ensure that we were indeed drawing a sample of developers – that, specifically, our respondents were developers. We are also able to do through the validation process described below.
3.2. Response rate and validation
One of the requirements of open, online questionnaires is verifying whether the respondents really belong to the group that is under scrutiny. The survey definition of the universal developer population is “everyone who has contributed source code to an free/libre/open source software package”. We are able to state confidently that our respondents belong to this population as follows14:
• We asked respondents to provide complete or partial e-mail addresses for validation purposes.
• We matched these e-mail addresses to names or e-mail addresses found in the source code analysis – see FLOSS 2002 part V – or matching them to sources on Internet archives.
• This sub-sample of 487 respondents individually identified as certain developers were compared to the rest of the respondents by statistically comparing their responses.
13 We assumed that developers can answer the survey in English, though – we didn’t have the budget for a
multi-lingual survey. As a result, we expect that we have an under-representation of east Asian, and possibly Latin American developers.
This process involved a comparison of means and standard deviations of the two groups (“known developers” and other respondents) with regard to a selection of variables of our data set. This showed very little statistical difference. In the very few responses where minor differences existed, we found that the group of verified FLOSS developers consisted of slightly more active and "professionally" experienced persons.
The FLOSS developer survey received 2774 responses. Due to the page-wise design of the questionnaire – where responses to the first page were recorded even as the next page of questions were presented – this figure represents the respondents who answered the first set of questions, while there were 2280 responses to the entire questionnaire.
4. What do we know now?
4.1. Demographics: Married with children?
A presentation of demographics is usually the starting point for an analysis of any survey. For the reasons given earlier in section 3.1, the FLOSS methodology does not provide a sampling that is representative of developer demographics, especially of the geographic distribution of developers. (A comparison of geographical data from different developer surveys, as well as much else that this chapter draws on, is in Ghosh et al 2003.) It is possible to discuss other features of developer demographics, though, for which the FLOSS survey is likely to be more representative, such as age, gender and civil status (which we presume have a similar distribution across different nationalities).
Almost all (98.8%) of respondents to the FLOSS developer survey are male. This is similar to the 98.6% reported as male in the WIDI survey (from a much larger sample size, of nearly 6,000, see Robles et al 2001) and 98% reported male in the BCG/OSDN survey. It should be noted that the surveys probably under-represent female developers. As self-selecting surveys, they are dependent on developers who chose to respond – to the survey itself, and to the specific question on gender. However, given the degree of coincidence on this point across three quite different surveys, it would seem unlikely that female participation in the FLOSS developer community is much higher than 5-7%.
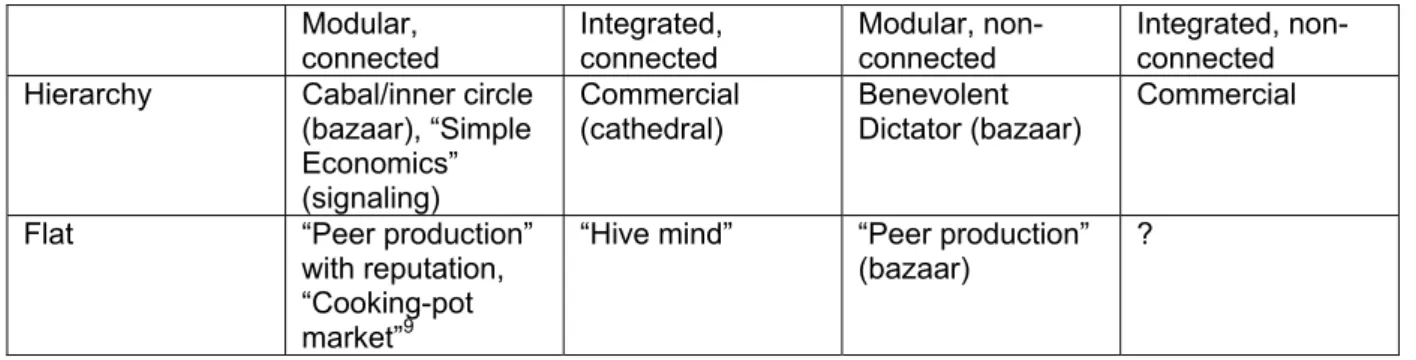
Figure 1: Current and starting age of developers 0 10 20 30 40 50 60 70 80 90 100 10 12 14 16 18 20 22 24 26 28 30 32 34 36 38 40 42 44 46 48 50 52 54 56 58 60 62 64 66 68 70 72 Age (Years) Cu mu la ti ve Percen t Starting Age Current Age
© 2002 International Institute of Infonomics
Source: F/LOSS developer survey
The FLOSS survey showed developers are quite young, with over 60% between the ages of 16 and 25. Figure 1 shows the cumulative percentage for developers’ age when they first started free software development, compared with developers’ current age. As we asked when respondents first started development and their age at that time, we were able to calculate two age points for each developer as well as identify the peak year for the start of development (2000 – it should be noted that the survey was carried out in early 2002).
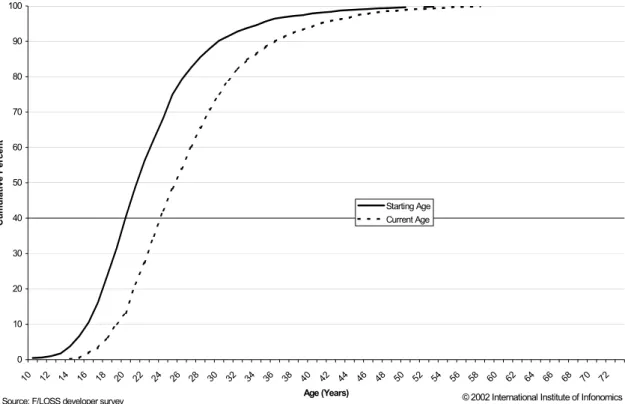
Despite the apparent youth of developers, as Figure 2 shows, single developers are in a minority (albeit a large one, 41.4%) and about the same as the surprisingly large fraction (39.9%) who live together with a partner or spouse. Again, going against the nerdish stereotype, 17% of developers reported having children, and half of those, one child. There is a correlation between having children (or even being married) and having a stronger career oriented participation in development. As most children were reported to be under 2 years of age at the time of the survey. One might think, as the free software baby boom coincided with the dot com peak, that developers saw their earning possibilities soar and took on financial and familial responsibilities?
Figure 2: Civil status of developers 41.4 18.6 18.8 21.1 0.1 Single
Partner, not living together Partner, living together Married
Married, not living together
4.2. Motivation
The FLOSS survey addressed the complex issue of what motivates developers to contribute to the community in a series of multi-dimensional questions. This aspect in particular is elaborated in much detail in Ghosh et al. 2003, so I will only present a brief summary here.
When I started writing about free software – and similarly “non-monetary economic”15 –
phenomena in the mid 1990s, there was widespread suspicion among traditional economists and others that this was a domain either for hobbyists or for irrational groups of people mainly driven by warm fuzzy feelings of communal sharing and gifts. Since the idea of a gift is usually associated with knowing the recipient, and the politics of developers in particular tends towards the libertarian rather than the communitarian, the notion of “gift economy”16 might seem unjustified. As open source
became a hot topic for investigation in the social sciences, recent hypotheses usually suppose largely rational, self-interested motives, among the most extreme being that open source is explained by the “simple economics” of signaling for better career prospects and hence monetary returns17.
In the absence of clear monetary transactions the interplay of contribution and return can be described in the form of “balanced value flow”18 where one assumes rational self-interest but allows that “self-interest” can include a range of different types of reward, not just monetary compensation. While the FLOSS survey attempts to measure some of these possible rewards, a simple question is to ask whether individual developers value their own contribution above or below their perceived rewards, i.e. “I give more than/less than/the same as I take” in relation to the developer community at large.
15 Ghosh 1994, Ghosh 1995, Ghosh 1998 16 Barbrook 1998
17 Lerner and Tirole 2002 18 Ghosh 2003
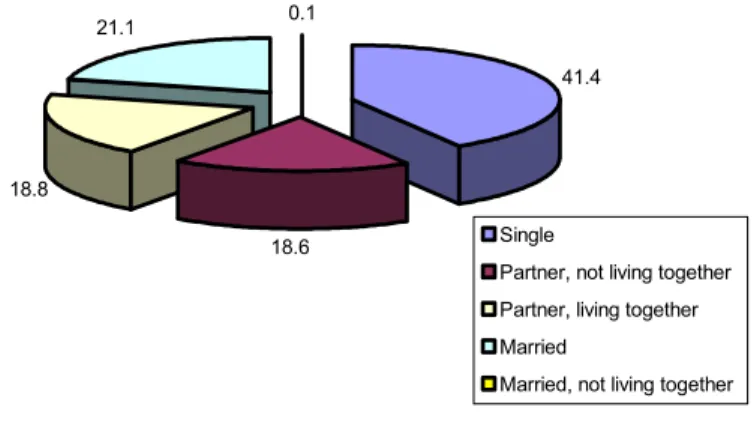
We asked exactly this, and the resulting “selfishness measure” or “altruism measure” is shown in Figure 3, for respondents falling into four motivation categories (as described later in this section). This measure ranges between -1 (purely altruistic) and +1 (purely selfish) and is calculated as the difference between the “selfish” responses (“I take more than give ”) and the “altruistic” responses (“I give more than I take”), as a fraction of total responses19.
Figure 3: “Selfishness” or “profit-seeking measure” of developers
What we see is that more respondents are selfish than altruistic from all motive classes. Indeed, 55.7% of all developers classified their relationship with the community as “I take more than I give” and a further 14.6% felt their contribution and reward was balanced; only 9% could be classed as consciously altruistic in that they reported that they give more than take. It should be noted that this measure does not reflect selfishness or altruism as intent – which is what would be correct – but as an outcome, in which case the words don’t fit as accurately. Thus, the responses are consistent with self-interested participation and indicate that developers perceive a net positive value flow.
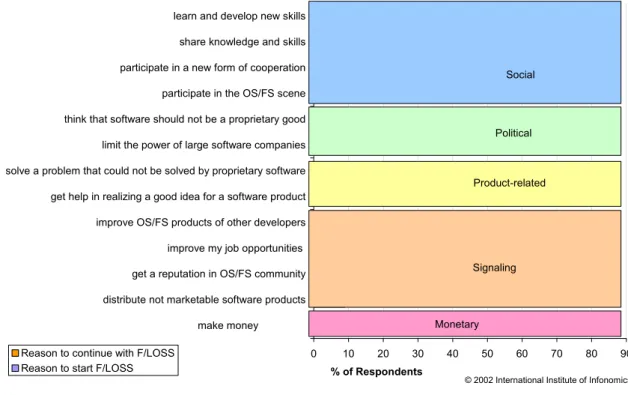
Figure 4 shows responses to the two main questions on motivation, asking developers for their reasons to first start developing free software and their reasons for continuing in the free software community. The chart groups the reported reasons into broad headings. What is most notable is that the most important reason to join and continue in the community is “to learn and develop new skills” – highlighting the importance of free software as a voluntary training environment.
Figure 4: Initial and current motivations for FLOSS development
0 10 20 30 40 50 60 70 80 90
make money distribute not marketable software products get a reputation in OS/FS community improve my job opportunities improve OS/FS products of other developers get help in realizing a good idea for a software product solve a problem that could not be solved by proprietary software limit the power of large software companies think that software should not be a proprietary good participate in the OS/FS scene participate in a new form of cooperation share knowledge and skills learn and develop new skills
% of Respondents Reason to continue with F/LOSS
Reason to start F/LOSS
© 2002 International Institute of Infonomics
Monetary Signaling Product-related
Political Social
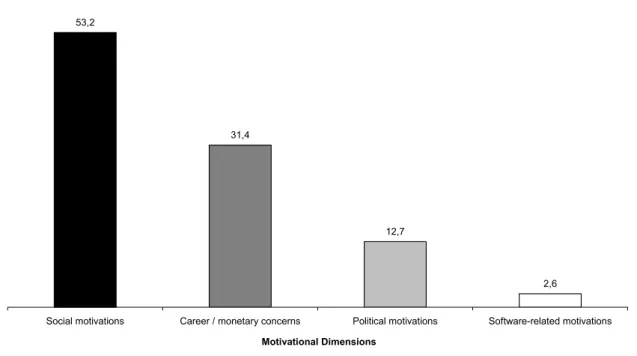
As a preliminary attempt to integrate the multiple, simultaneous reasons provided, respondents have been organised into four motivation classes (Figure 5): social/community motives; career or monetary concerns; political motives; purely product-related motives. This is further explained in Ghosh et al 2003, but in summary, while many developers express social or community-related motives, only those who also express career concerns were included in the second category, while only those who also express political views were placed in the third category. The last category is necessarily small since it comprises those who expressed only product-related motives (participating in the developer community to improve a software product, say). Of course, there are many ways of forming these categories and how one forms them would change how they correlate to other variables.
Figure 5: Developers by motive class, as % of total developers
53,2
31,4
12,7
2,6
Social motivations Career / monetary concerns Political motivations Software-related motivations
Motivational Dimensions
Source: FLOSS Developer Survey (C) International Institute of Infonomics 2002
4.3. Organisation
The FLOSS community shows signs both of extreme concentration and widespread distribution simultaneously. Measures of source code authorship show that a few individuals are responsible for disproportionately large fractions of the total code base and this concentration is increasing over time (the Gini coefficient for the Linux kernel20 is 0.79). Several previous studies
using a variety of objective metrics have shown that large fractions of code are developed by a small minority of contributors21.
However, the same studies and methods show that the majority of developers contribute relatively small amounts of code, and participate in a single, or very few projects. Arguably, in the spirit of Raymond’s (1998) view that “ given enough eyeballs, all bugs are shallow” we can assume that the small high-contribution minority would not be as productive, and would be unable on their own to complete projects, without the support of vast armies of lower-contribution participants. Moreover, the same objective metrics show that the majority of projects (or packages, or even modules in the Linux kernel) have a single author, or very few contributors.
20 In this context, the Gini coefficient measures the concentration of distribution: 0.0 represents uniform
distribution (equal contribution from all participants) while 1.0 indicates full concentration (one participant contributes everything). The value here is for Linux kernel version 2.5.25, taken from the LICKS study of three versions of the kernel, see Ghosh and David 2003 for details.
21 The Orbiten survey (Ghosh and Ved Prakash 2000) and the FLOSS Source Code survey (FLOSS 2002 Part V)
Put together, this suggests that the community is organized into not a single core with a vast periphery, but a collection of cores each with their own smaller, overlapping peripheries. This organization is fractal in nature, in that the shape of concentration curves22 remains the same no matter
what level of detail is used – i.e. the distribution of high- and low- contribution developers is more or less the same whether one looks at “all projects on Sourceforge” or at “modules in the Linux kernel”.
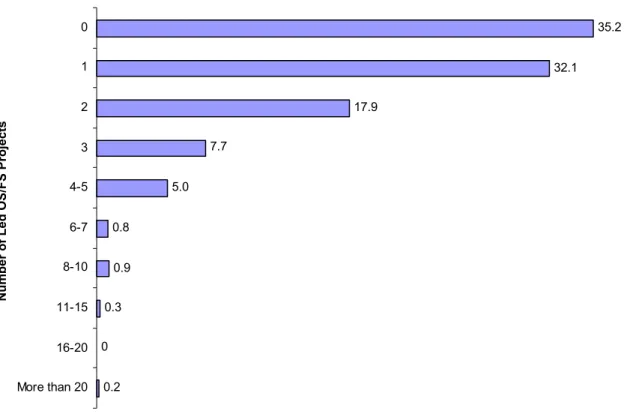
The fractal nature of this would suggest an organizational mechanism that is universal within the community, involving the development of strong leadership structures in a highly modularized environment. This is consistent with the FLOSS Developer survey, where for the first time individuals were asked to measure their leadership role. As Figure 6 shows, only 35% of respondents claim not to be leaders of any project, while 32% report they lead a single project. Meanwhile, only 2% claim to lead more than five projects.
Figure 6: Leadership: Number of projects involved in, % of respondents
0.2 0 0.3 0.9 0.8 5.0 7.7 17.9 32.1 35.2 More than 20 16-20 11-15 8-10 6-7 4-5 3 2 1 0
Number of Led OS/FS Projects
Figure 7 corroborates objective and other data sources showing that most people have been involved in a small number of projects (a similar but slightly different picture was reported when asked about current involvement in projects, which probably says more about a developer’s ability to manage time than his degree of involvement as such).
22 Lorenz curves, which plot authors’ cumulative share of contribution and are the basis for Gini coefficients; for an
Figure 7: Number of projects involved in so far, % of respondents 0.5 0.1 0.2 0.5 1.8 6.3 18.7 71.9 More than 100 76-100 51-75 31-50 21-30 11-20 6-10 1-5 N u m b er of OS/ F S Proj ects
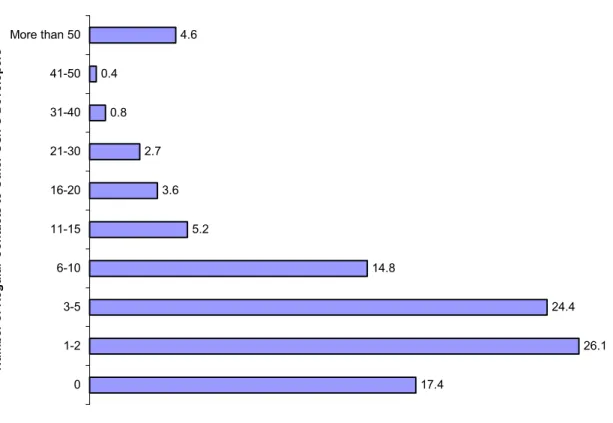
Finally, most models assume that there is considerable collaboration and more importantly communication between developers in order to make this highly modularized, distributed form of production work. Figure 8 shows what people reported when asked for the number of other members of the developer community with whom they are in regular contact. The terms “contact” and “regular” were deliberately not defined by us for two reasons – any definition we chose would be arbitrary; and we wanted to see whether developers believe they are in regular contact, which is an important insight into their own perception of the community’s organizational structure. Surprisingly, as many as 17% reported being in regular contact with nobody thus indicating that significant development does take place in isolation (structural, if not necessarily social), at least between points of code release.
What is perhaps predictable, and consistent with the other findings, is that the vast majority of developers maintain regular contact with a small number of other developers – indeed, over 50% are in contact with between one and five others.
Figure 8: Regular contact with other developers, % of respondents 17.4 26.1 24.4 14.8 5.2 3.6 2.7 0.8 0.4 4.6 0 1-2 3-5 6-10 11-15 16-20 21-30 31-40 41-50 More than 50 Num b er of Regular Contacts to O ther O S /FS Developers
5. Subjective responses, objective data?
Responses to any survey such as this one are necessarily subjective. Naturally, this is so even for the several questions which would have objective answers – such as the number of projects to which a developer has contributed, or his monthly income, or whether such income is a direct result of involvement in free software development.
Some of these objective data can be checked against secondary sources, which may be more reliable, or less subjective, than survey responses. Some objective data, and even subjective data, can be checked against responses to other survey questions – although this doesn’t make the responses any less subjective, one can at least know whether the subjectivity is internally consistent or self-contradictory.
5.1. Do reported motives match reported rewards?
One of the most interesting things that can be checked for consistency is the relationship between reported motives and reported rewards. When asking people for their motives behind any action, one has to be aware that answers are not necessarily accurate, for several reasons:
• people are not conscious of their motives all the time
• they may suppress some motives in preference for others either unconsciously or deliberately because of what they believe are the “right” motives – this effect may be
less in an anonymous web survey than a face-to-face interview but probably still exists
• they may report some motives but not others – especially when there are multiple motives, some that are “necessary but not sufficient” may be ignored.
This is certainly true for respondents to the FLOSS developer survey. But it is possible to get a truer understanding of respondents’ motives by comparing reported motives to reported rewards. We assume that people who develop free software for a given motive (e.g. to earn money) will also report an above-average incidence of related rewards (e.g. above-average income). Not all motives have rewards that can be directly measured (most don’t). Certainly, rewards generally result after a considerable time lapse, and such rewards would only become apparent through repeated panel surveys. But there is some degree of consistency control that can be performed within a single survey.
The first thing that comes to mind is to see whether there is any difference in reported income levels across motivation categories (as described previously in section 4.2), and whether motive category is reflected in earnings from participation in free software development. Figure 9 shows whether respondents from different motive classes earned income directly from FLOSS, indirectly only, or not at all. Figure 10 shows the mean income levels for motive classes (respondents were not asked for their level of income from FLOSS, so this reflects income from all sources).
Figure 9: Earning from FLOSS by motive class
Clearly there is a strong indication that those who report career and monetary motives get what they want, i.e. they report a low level of not earning income from FLOSS and high level of
earning directly from FLOSS as compared with other motive classes. In contrast, the politically motivated are least likely to earn any income, direct or indirect, from FLOSS. It is interesting to note that although those with purely product-related motives (such as distributing software they could not market in a proprietary way, or looking at FLOSS as a method of implementing an idea) are less likely to earn money from FLOSS than other groups, they earn the most, on average. This is consistent with, e.g., a picture of software professionals with proprietary software as a (large) income source who turn to this development mode to solve a technical or product-related problem.
Figure 10: Income by motive class
Figure 11 compares other possible reward indicators by motive class. These could possibly be treated as proxies for social or community-type rewards. While it seems clear that those motivated by career or monetary concerns get above average levels of the appropriate sort of reward, the picture is blurred for the social/community and political motive class (at least from this set of indicators; there are many other candidates from the FLOSS survey). From this figure one sees that social/community-driven and career/monetary-social/community-driven developers have similar levels of involvement in past and current projects as well as leadership of projects. (It should be emphasized that the career/monetary class includes those who did not explicitly state they wanted to earn money – those who were only interested in, e.g., reputation and possible job prospects form the major share of this group.) What is striking is that the career/monetary group has a much higher level of regular contact with other developers than other groups, possibly indicating that they are being successful in developing the reputation that they value.
Figure 11: Social activity rewards by motive class
One “reward” indicator, in the sense that it sheds light on developers’ perception of the sort of community to which they belong, is the “Hobbes measure” shown in Figure 12. Calculated using a similar method to the “selfishness measure” (see section 4.2), in the form of the statement about other developers that “they give less than/more than/the same as they take” in relationship to the developer community. By and large, respondents were more likely to see other developers as altruistic and themselves as selfish. The “Hobbes measure” ranges from –1 (all others are altruistic) to +1 (all others are selfish). Unsurprisingly, the chart shows that a majority thought other developers in general are not altruistic, and notably more from the career/monetary group assumed that other developers are selfish than from any other group.
Figure 12: Others’ selfishness – “Hobbes measure” – by motive class
Developers motivated purely for product reasons have the most utopian view of the community, possibly because they feel for others, as they do for themselves (as the least “selfish” group, as seen previously), that there is being more put into the community than taken out of it.
5.2. Other data sources
It has already been shown for some variables that more objective data sources can corroborate the subjective data provided by respondents to the FLOSS developer survey. While a comparison of these data is beyond the scope of this text, the FLOSS source code scan (FLOSS 2002 Part V), the Orbiten Survey (Ghosh and Ved Prakash 2000) and the LICKS project (Ghosh and David 2003) provide extensive presentations of data on an aggregate level, especially on developer participation in and leadership of projects, that can be compared with subjective survey responses.
6. Conclusion
This chapter has presented some of the most interesting findings from the FLOSS Developer Survey. These findings highlight the crucial role that empirical data must play in the formation of models and hypotheses regarding the creation, organization and activity of the free software /FLOSS developer community. They also show the utility of empirical data even when it is not possible to fully provide high levels of statistical accuracy, simply due to the unavailability of accurate data sources and census-type information on the universal population of developers.
Hopefully, this chapter provides the impetus for the process of using multiple sources of subjective and objective inputs on developer activity to better understand the motivations – and assess the rewards – behind the participation of individuals in this fascinating form of value production and exchange.
7. References
Barbrook, Richard, 1998, “The Hi-Tech Gift Economy”, First Monday, vol. 3 number 12 (December),
BCG 2002, Survey of free software/open source developers conducted by the Boston Consulting Group; see http://www.osdn.com/bcg/
Benkler, Yochai, 2002, “Coase's Penguin, or Linux and the Nature of the Firm”, 112 Yale L.J. (Winter 2002-03)
Dempsey, Bert J, Debra Weiss, Paul Jones, and Jane Greenberg, 2002, “Who is an open source software developer?” Communications of the ACM. April, 2002.
http://www.ibiblio.org/osrt/develpro.html
FLOSS: Free/Libre/Open Source Software Study, Rishab Ghosh, Ruediger Glott, Bernhard Krieger & Gregorio Robles, 2002, International Institute of Infonomics/MERIT, http://floss.infonomics.nl/report/ Ghosh, Rishab Aiyer, 1994. "The rise of an information barter economy", Electric Dreams, #37 (21 November), at http://dxm.org/dreams/dreams37.html
Ghosh, Rishab Aiyer, 1995. "Implicit transactions need money you can give away", Electric Dreams, #70 (21 August), at http://dxm.org/dreams/dreams70.html
Ghosh, Rishab Aiyer, 1996, Informal law and equal-opportunity enforcement in cyberspace, unpublished manuscript
Ghosh, Rishab Aiyer, 1998, Cooking pot markets: an economic model for the trade in free goods and services on the Internet, in: First Monday, volume 3, number 3 (March),
http://www.firstmonday.org/issues/issue3_3/ghosh/index.html
Ghosh, Rishab Aiyer, 2002, “Clustering and Dependencies in Free/Open Source Software
Development: Methodology and Tools”, SIEPR-Project NOSTRA Working Paper, draft available at http://dxm.org/papers/toulouse2/
Ghosh, Rishab Aiyer, and Vipul Ved Prakash, 2000, “Orbiten Free Software Survey”, First Monday, volume 5, number 7 (July), http://www.firstmonday.org/issues/issue5_7/ghosh/
Ghosh, Rishab Aiyer, 2003, “Cooking-pot markets and balanced value flows”, in Collaboration and Ownership in the Digital Economy, Michael Century & Rishab Ghosh (ed.), MIT Press, forthcoming summer 2003
Ghosh, Rishab Aiyer and Paul David, 2003, “The nature and composition of the Linux kernel
developer community: a dynamic analysis”, SIEPR-Project NOSTRA Working Paper, draft available at http://dxm.org/papers/licks1/
Ghosh, Rishab A., Ruediger Glott, Bernhard Krieger & Gregorio Robles, 2003, “Community above Profits: Characteristics and Motivations of Open Source and Free Software Developers”,
MERIT/Infonomics Working Paper, draft available at http://floss.infonomics.nl/papers/
Grimm, Bruce T., Brent R. Moulton, and David B. Wasshausen, 2002, “Information Processing Equipment and Software in the National Accounts”, NBER/CRIW Conference on Measuring Capital in the New Economy, April, http://www.bea.doc.gov/bea/papers/IP-NIPA.pdf
Lerner, Josh and Jean Tirole, 2002, “Some simple economics of open source”, Journal of Industrial Economics, 50.2 (2002): 197-234.
Raymond, Eric S., 1998, “The Cathedral and the Bazaar”, First Monday, volume 3, number 3 (March),
http://www.firstmonday.org/issues/issue3_3/raymond/
Robles-Martínez, Gregorio. et al, 2001, “WIDI: Who Is Doing It?”, Technical University of Berlin,
http://widi.berlios.de/paper/study.html
Von Hippel, Eric. 2001. “Innovation by User Communities: Learning from Open Source Software,” Sloan Management Review, 42(4): 82-86.