“Odor Basics”,
Understanding and Using Odor Testing
Authored by:
Charles M. McGinley, P.E.
St. Croix Sensory, Inc.
Michael A. McGinley, MHS
St. Croix Sensory, Inc.
Donna L. McGinley
St. Croix Sensory, Inc.
Presented at
The 22
ndAnnual Hawaii Water Environment Association Conference
Honolulu, Hawaii: 6-7 June 2000
St. Croix Sensory Inc. / McGinley Associates, P.A. 13701 - 30th Street Circle North
Stillwater, MN 55082 U.S.A. 800-879-9231
[email protected] Copyright © 2000
ABSTRACT
Of the five senses, odor is the most evocative and least understood. Odor testing seems mysterious and odor data mythical to most practitioners. In millennium past the "practice of odor" was in the hands of wizards, magicians, and experts. For years engineers and operators have relied on “odor experts” to interpret odor testing results. Today odor, odor control, and odor nuisance are understandable subjects for plant operators, facility managers, engineering practitioners, and citizens.
Some most frequently asked questions of odor testing:
1. What is an “odor unit”?
2. Where does the result come from? 3. How accurate is the result?
4. Are there testing standards? 5. Aren’t the odor results subjective?
Odor is measurable and quantifiable using standard practices as published by the American Society of Testing and Materials (ASTM E679 and E544) and by the European Union. In 2000 the proposed European Normalization Standard, prEN 13725, will be implemented and become the de facto "International Standard" for odor/odour testing.
Frequently, odor testing is overlooked as a valuable tool for engineering and operations. This paper presents the "diary" of one odor sample from the sampled source through the odor laboratory. The data from the odor laboratory will also be viewed from the engineer's or facility manager's perspective for use in decision making at the facility.
KEYWORDS
INTRODUCTION
Community odors remain one of the top three complaints to air quality regulators and government bodies around the U.S. and internationally. The majority of all air pollution complaints are odor related.
Odors from a facility, such as a wastewater treatment plant, can affect the community. These odors commonly lead to nuisance complaints. Estimating the effects of odors from a facility often requires laboratory odor testing. In order to accomplish this testing, air samples from the facility are collected and shipped overnight to an odor-testing laboratory. Engineers and managers can use the odor test results to help in their decision making.
Odor testing in the laboratory is conducted to quantify an odorous air sample in terms of human perception. During normal breathing, chemical molecules in the air pass by the olfactory receptors in the top, back of the nasal cavity. The olfactory nerves signal the brain and create a psychophysical response. For the general population the olfactory response to odors is normally distributed. Therefore, a representative group of the population is called an odor panel (odor assessors).
The statistical concepts that are used for odor testing are accepted internationally. The statistical concepts are known as the "forced-choice method" and the "ascending concentration series method". These methods are used when presenting a dilute odor sample to odor panelists for determining detection and recognition thresholds. The device used to present the dilute odor sample to odor panelists is called an "olfactometer".
MAKING SENSE OF SMELL
Of the five senses, the sense of smell is the most complex and unique in structure and organization. While human olfaction supplies 80% of flavor sensations during eating, the olfactory system plays a major role as a defense mechanism by creating an aversion response to malodors and irritants. This is accomplished with two main nerves. The olfactory nerve (first cranial nerve) processes the perception of chemical odorants. The trigeminal nerve (fifth cranial nerve) processes the irritation or pungency of a chemical odorant.
During normal nose breathing only 10% of inhaled air passes up and under the olfactory receptors in the top, back of the nasal cavity. When a sniffing action is produced, either an involuntary sniff reflex or a voluntary sniff, more than 20% of inhaled air is carried to the area near the olfactory receptors due to turbulent action in front of the turbinates. These receptors are ten to twenty-five million olfactory cells making up the olfactory epithelium. Cilia on the surface of this epithelium have a receptor contact surface area of approximately five square centimeters due to the presence of many microvilli on their surface. Supporting cells surrounding these cilia secrete mucus, which acts as a trap for chemical odorants.
Chemical odorants pass by the olfactory epithelium and are dissolved (transferred) into the mucus at a rate dependent on their water solubility and other mass transfer factors. The more water-soluble the chemical, the more easily it is dissolved into the mucus layer. A “matching” site on the olfactory cells then receives the chemical odorant. The response created by the reception of a chemical odorant depends on the mass concentration or the number of molecules present. Each reception creates an electrical response in the olfactory nerves. A summation of these electrical signals leads to an “action potential.” If this action potential has high enough amplitude (a threshold potential), then the signal is propagated along the nerve, through the ethmoidal bone between the nasal cavity and the brain compartment where it synapses with the olfactory bulb.
All olfactory signals meet in the olfactory bulb where the information is distributed to two different parts of the brain. One major pathway of information is to the limbic system which processes emotion and memory response of the body. This area also influences the signals of the hypothalamus and the pituitary gland, the two main hormone control centers of the human body. The second major information pathway is to the frontal cortex. This is where conscious
sensations take place as information is processed with other sensations and is compared with cumulative life experiences for the individual to possibly recognize the odor and make some decision about the experience. The entire trip from the nostril to the signal in the brain takes as little as 500 milliseconds.
The best analogy to understand what is happening with odor perception in the olfactory system is that the receptor nerves are like keys on a piano. As a chemical odorant “hits” the piano
keyboard a tone is played. When multiple chemical odorants are present the result is a cord or specific perception. For example, if keys 1, 3, and 7 are “hit”, then the brain perceives “banana.” Likewise, if keys 4, 6, and 12 are “hit”, then the brain perceives “sewer.” The greater the
number of odorant molecules present (higher concentration), the louder the cord is played. The loudness of the cord is analogous to the intensity of the odor perception [McGinley, M.A. 1999].
Odor is a Psychophysical Phenomenon
Psychophysics involves the response of an organism to changes in the environment perceived by the five senses [Stevens 1960]. Some examples include how the human body perceives sound loudness, lighting brightness, or odor strength.
These psychophysical phenomena lead to sensory responses, which follow a “power law.” Apparent odor strength grows as a power function of the stimulus odor.
S. S. Stevens showed that this power law (Steven’s Law) follows the equation:
I = k Cn
Where I is the odor intensity (strength), C is the mass concentration of odorant (i.e.
milligrams/cubic meter, mg/m3), and k and n are constants that are different for every odorant [Stevens 1962]. As shown in Figure 1, this equation is a straight line,plotted on a log-log scale.
THE ODOR SAMPLE
Sample No. 101 is an odorous air sample collected from the exhaust fan of the pretreatment building scrubber at a wastewater treatment facility. The pretreatment building at the facility houses the screening and grit removal processes. The building scrubber has a roof top exhaust fan that discharges upward through a short stack attached to the fan. Make-up air to the building enters through a makeup air system that can preheat the incoming air. However, makeup air also enters through opened doors and windows.
The odor testing is part of an odor study at the wastewater treatment facility. The purpose of the Odor Study is to compare odors from various processes at the facility. Therefore, the Study's protocol requires a sample of exhaust air from the pretreatment building scrubber under "normal" operating conditions. The planners of the study must determine if "normal" operating conditions exist with the doors and windows open or closed. The person doing the sampling must
document the conditions of the building (doors and windows) and the processes within the building at the time of sampling. The conditions at the time of collecting Sample No. 101 must be documented so that the results will be in context to the Study's purpose.
Prior to the sample taking, the Sampler gathers together the needed sampling equipment:
1. Ladder,
2. Pliers or wrench to open the sample port;
3. Pitot tube/inclined manometer to measure velocity and pressure in the stack; 4. Thermometers (wet and dry bulb) to measure temperature of the exhaust air; 5. 10-liter Tedlar gas sample bag with label;
6. Vacuum case with vacuum pump;
7. Teflon sample line (from exhaust stack to vacuum case); 8. Shipping case; and
9. Portable instruments to measure specific chemicals or chemical groups.
In addition to collecting Sample No. 101 for odor testing, the Study's protocol may require a companion sample (ie. duplicate) to be collected in a Tedlar gas sample bag for analysis, ie. sulfur gas analysis, VOC's or air toxics.
The Sampler also needs the following documents ready for use prior to the sampling:
1. Sampling protocol for the study; 2. Air velocity data and calculation sheet; 3. Chain of Custody form;
4. Shipping case mailing label; 5. Express shipping documents; and
6. Phone number of the laboratory and the express shipper.
Following the air velocity, pressure and temperature measurements on the exhaust air stream, the Sampler prepares the sample tubing, bag, vacuum case and pump. With the 10-liter Tedlar sample bag labeled Sample No. 101, and with the bag valve open, the bag is placed into the vacuum case and the box sealed. With the Teflon sample tubing held in position inside the exhaust stack and connected to the vacuum case, the vacuum pump is turned on to create a vacuum in the case and bag.
The sample bag is first filled with the odorous air for "conditioning" the bag. The bag is filled to 1/3 full and held for at least one minute. The bag is then emptied using the pump to pressurize the vacuum case. The odorous air sample is discharged back to the exhaust stack through the Teflon sampling line.
Sample No. 101 is then collected in the sample bag using the vacuum case. When the sample bag is 2/3 full, the vacuum is released from the case and the sample flow stops. The sample line is disconnected and the bag is removed from the vacuum case after the bag valve is closed.
Sample No. 101 needs to be protected from sunlight and from potential puncture. The bag is placed inside a carrying bag. However, before moving the bag to the shipping box, the Chain of Custody record must be completed for Sample No. 101. The date, time and description of Sample No. 101 are recorded as well as the laboratory testing requested.
The protection of Sample No. 101 is ensured when placed inside the shipping box on its end. The sample bags must never be shipped on top of one another. Sufficient room must be available in the shipping box for each bag to expand approximately 20%.
The final steps of the Sampler, prior to dispatching Sample No. 101, involves completing the shipping documents (air bill number), calling the express shipping company (ie. FedEx) for a pickup and calling the odor laboratory to confirm sample collection was completed and to transmit the air bill tracking number.
Odor laboratories recognize the variable and uncontrolled nature of field conditions (ie. weather and equipment) and typically have flexible policies for cancellation. In the example case of Sample No. 101, the sampling was completed as planned with five other samples.
THE ODOR PANEL
For the Odor Study the protocol requires the odor testing to be conducted within a nominal 24 hour time period after sample taking. The shipping box arrives the morning after sample taking via express (ie. FedEx). Inspection of the shipping box and the samples involves noting any discrepancies on the documents and any damage to the sample bags. Review of the sampler's analytical orders on the Chain of Custody Record and comparison of the orders to the original work order minimizes errors and misunderstandings.
The custody of Sample No. 101 and the other samples is transferred to the designated "odor panel leader" for previewing and scheduling in the odor panel. All the samples from a sample set are scheduled for one odor panel that requires approximately three hours time.
The odor laboratory is an odor-free, "non-stimulating" space. Each odor panelist, when working on odor evaluations, focuses on the task of observing the odor sample as it is presented from the olfactometer. Noise and distracting activities in the evaluation area can break the focus of the odor panelist.
The waiting area of the panelists is separated, as much as possible, from the testing area. The panelists are provided water for drinking during the waiting time between sample testing,
however, eating, gum chewing or other beverages are not permitted. A comfortable and relaxing waiting area enhances a low stress environment for the panelists. A variety of activities should be available to the panelists to help occupy their time, ie. reading, puzzles, etc. Attention to the panelists' comfort and working environment nurtures their commitment and dedication to quality performance.
Odor panels consist of individuals (panelists) that are selected and trained following the "Guidelines for Selection and Training of Sensory Panel Members" (ASTM Special Technical Publication 758). Odor panelists are recruited from the community at large. A person who smokes, uses smokeless tobacco, who may be or is pregnant, or who has chronic allergies or asthma is not a candidate for the odor panel. The "standing odor panel rules" are part of the panelist's agreement to participate in odor testing.
The Odor Panel Rules are:
Panelists . . .
1. Must be free of colds or physical conditions that may affect the sense of smell; 2. Must not chew gum or eat at least 30 minutes prior to the odor panel;
3. Must refrain from eating spicy foods prior to the odor panel;
4. Must not wear perfume cologne or after shave the day of the odor panel; 5. Must wear unscented deodorant the day of the odor panel;
6. Must avoid other fragrance cosmetics, soaps, etc. the day of the odor panel; 7. Must have their hands clean and free of odors the day of the odor panel; 8. Must have their clothes odor free the day of the odor panel;
9. Must keep the odor panel work confidential; and
10. Must not bias the other panelists with comments about the observed samples.
Each odor panelist is tested to determine their individual olfactory sensitivity using standard odorants. The panelists receive training that consists of olfactory awareness, sniffing techniques, standardized descriptors, and olfactometry responses. Panelists are also required to attend an annual re-certification course.
From a pool of "on call" panelists, six to eight panelists are selected for a scheduled odor panel. Each odor panel should represent, as much as possible, a cross section of age and gender.
With the proper "care and feeding" (nurturing and training) of the odor panelists, the
communication between the panelists and the panel leader is clear, concise and efficient. A well-organized odor panel, that is conducted efficiently, ensures quality odor evaluations.
ODOR TESTING
The most common odor parameter determined during odor testing is “odor concentration” (odor strength). This determination is made using an instrument called an “olfactometer.” In the United States the standard followed for olfactometry is ASTM Standard of Practice E679-91, “Determination of Odor and Taste Threshold by a Forced-Choice Ascending Concentration Series Method of Limits.” In 2000, the European Union will be following a new standard, prEN 13725 – “Air Quality – Determination of Odour Concentration by Dynamic Olfactometry” (prEN refers to a proposed European Normalization Standard – the “pr” will be removed when the standard is accepted as expected in 2000). The following countries are bound by the CEN/CENELEC International Regulations to implement this European Standard: Austria, Belgium, Denmark, Finland, France, Greece, Germany, Iceland, Ireland, Italy, Luxembourg, Netherlands, Norway, Portugal, Spain, Sweden, Switzerland, and the United Kingdom. The new European standard is expected to be adopted in Australia, New Zealand, and much of the Pacific Rim. Therefore, “EN 13725” will become the de facto International Standard for odor/odour testing.
During an odor test, the odor panelist (assessor) sniffs a dilute sample of the odor as it is
discharged from the olfactometer as one of three sample presentations (one presentation with the dilute odor and two with odor free air). The assessor sniffs all three of the presentations and must select the one of the three that is different from the other two, even if they must guess. This statistical approach is called “triangular forced-choice.” The assessor declares to the test
administrator if the selection is a “guess”, a “detection” (the selection is different from the other two), or a “recognition” (the selection smells like something) as defined by ASTM E679-91.
The assessor is then presented with the next set of three presentation choices, one of which contains the diluted odor sample. However, this next set of three samples presents the odor at a higher concentration (e.g. two times higher). The assessor continues to additional levels of higher concentration (lower dilution) presentations following the “triangular forced-choice” procedure and the required designation of “guess”, “detect”, or “recognition”. This statistical approach of increasing levels of sample presentation is called “ascending concentration series.”
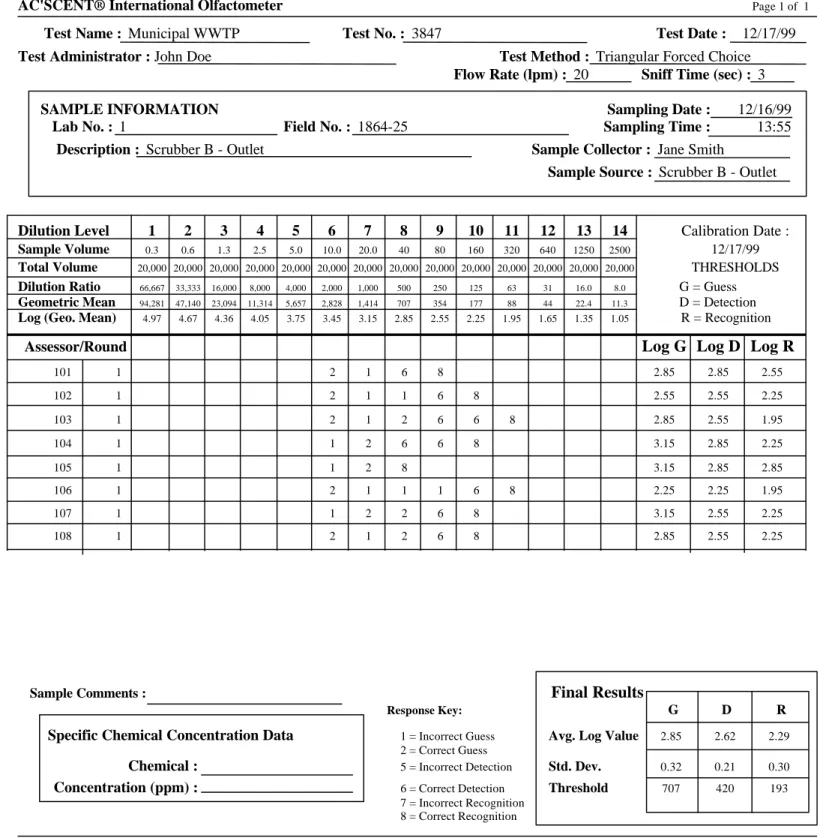
Therefore, “odor concentration” or odor strength is a number derived from the laboratory dilution of sample odors. The dilution ratio (total presentation volume divided by odor sample volume) at each sample presentation level is used to calculate the concentration of the evaluated sample. Figure 2 is an example of an odor evaluation data sheet from an odor laboratory. Note the response key at the bottom of this figure [ 1=incorrect guess, 2=correct guess, 5=incorrect detect, 6=correct detect, 7=incorrect recognition, and 8=correct recognition].
As an example, follow the results of Assessor 101 in Figure 2. This assessor did not indicate “detection” of the odor at dilution level 7 which is a dilution ratio of 1000, but did indicate a detection at the next highest odor concentration (lower dilution ratio) of 500 (two times more odor than 1000). The assessor’s individual estimated detection threshold is the geometric mean between 1000 and 500, or 707. The result of this statistical method is called the “best-estimate” threshold [McGinley, C.M. 1999].
(log 1000 + log 500)/2 = (3.0 + 2.7)/2 = 2.85 {102.85 = 707}
The geometric mean is used when calculating the “best estimate” threshold due to the lack of “equal variance” along the dilution ratio scale [Stevens 1962].
The example shown above alludes to a very important concept in analyzing odor testing data. The ascending concentration series followed during testing of odors is a geometric progression (each dilution level twice the previous level). Since each dilution ratio is half of the previous presentation (twice the amount of odor), the scale does not have an equal spread between values. Applying a logarithm base 10 transformation forces the presentation scale to have an equal spread between dilution levels or, in other words, equal variance along the logarithm scale [Dravnieks 1986].
The individual estimated thresholds of six to ten assessors are averaged to determine the detection threshold for which 50% of individuals will observe the presence of an odor. In the example in Figure 2, this average of 8 assessors’ transformed detection threshold estimate is 2.62 or 420 Odor Units (antilog of 2.62 = 420 O.U.). The “detection threshold” value that is obtained from odor testing is actually derived from dilution ratios, and is therefore dimensionless.
However, the pseudo-dimensions of “Odor Units” (O.U.) or “Odor Units per Unit Volume” are commonly applied. For example: “Odor Units per cubic meter.”
It should be noted that the dilution of the actual odor emission sample is the physical process that occurs in the atmosphere down wind of the odor source. The “receptor” (citizen in the
community) sniffs the diluted odor. The dilution ratio is an estimate of the number of dilutions needed to make the actual odor emission “non-detectable”. If the receptor detects the odor, then the odor in the atmosphere is above the receptor’s detection threshold level.
The pseudo-dimensions of “odor units per cubic meter” are commonly used for odor dispersion modeling, taking the place of “grams per cubic meter.” The odor concentration can be
multiplied by the air flow rate, cubic meters per second, resulting in a pseudo-dimension of “odor units per second,” analogous to grams per second. Because “odor concentrations” from
different source types can not be “added” nor can they be “averaged,” odor modeling must be conducted with caution. The resulting “odor concentration” value of “1”, calculated by a dispersion model, represents the odor detection threshold that was determined using the “best estimate criteria.” A value of less than 1 represents “no odor” or “sub-threshold.” A value of greater than 1 represents “odor” at a “supra-threshold” level.
Odorant Dose Causes Perceived Response
Odor Persistency is a term used to describe the rate at which an odor’s perceived intensity decreases as the odor is diluted (i.e. in the atmosphere downwind from the odor source). Odor intensities decrease with concentration at different rates for different odors. Odor intensity is related to the odorant concentrations by the “power law” (Steven’s Law): I = k Cn
Through logarithmic transformation this function can be plotted as a straight line:
Log I = n log C + log k
Therefore, the persistency of an odor can be represented as a “Dose-Response” function. The “Dose-Response” function is determined from intensity measurements of an odor at various dilutions and at full strength [ASTM E544-99]. Plotted as a straight line on a log-log scale, the result is a linear equation specific for each odor sample. Figure 3 is an example of an odor persistency graph (Dose-Response Graph) [Dravnieks 1980]. The odorant concentration (Dose), expressed as the log of the dilution ratio, and the odor intensity (Response), expressed as the log of n-butanol PPM, produces the log-log plot with negative slope. The slope of the line represents the relative persistency. The constant k is related to the intensity of the odor sample at full strength [Dravnieks 1986].
Odor Pleasure is Subjective
Hedonic Tone is a measure of the pleasantness or unpleasantness of an odor. [Hedonic Tone is derived from the word “hedonistic”, the Greek word hedone meaning pleasure.] The hedonic tone is independent of the odor’s character. An arbitrary scale for ranking odors by hedonic tone is the 21-point scale:
Unpleasant -10 --- 0 --- +10 Pleasant
An assessor uses her/his personal experience and memories of odors as a hedonic tone
referencing scale. During training, assessors become aware of their individual odor experience and memory referencing. The reported hedonic tone value by an odor testing laboratory is an average of individual hedonic tone values assigned by each assessor.
Webster’s Dictionary provides the following definition for subjective and objective:
Subjective: relying upon ones personal feelings or beliefs; relating to or arising within one’s self or mind in contrast to what is outside…
Objective: treating or dealing with facts without distortion by personal feelings or
prejudices; dealing with things external to the mind rather than with thoughts or feelings…
The assigning of a hedonic tone value to an odor by an assessor is “subjective” to the assessor. The assessor’s experiences and memories force their personal feelings and beliefs into the decision making process. Through training, assessors assign a hedonic tone and then set aside their personal feelings and make objective decisions regarding detection and recognition thresholds, intensity referencing using a butanol scale, and character identification using a category reference.
Odor Character is Objective
Odor character is a nominal (categorical) scale of measurement. Odors are characterized using a referencing vocabulary for Taste, Sensation, and Odor Descriptors. The perception of taste is experienced in the evaluation of certain odors. The four (4) recognized taste descriptors are salty, sweet, bitter, and sour. The Trigeminal Nerve (Fifth Cranial Nerve), located throughout the nasal cavity and the upper palate, and other nerves sense the presence of some odors (i.e. “feels like…” vs. “smells like…”). Eight (8) sensation descriptors include: itching, tingling, warm, burning, pungent, sharp, cool, and metallic.
Numerous standard odor descriptor lists are available to use as a referencing vocabulary. Eight recognized odor descriptor categories are illustrated as an “odor wheel”: Vegetable, Fruity, Floral, Medicinal, Chemical, Fishy, Offensive, and Earthy. Specific descriptors within each category are listed in the odor descriptor wheel shown in Figure 4. Taste, sensation, and odor descriptors can all be ranked in relative intensity on a 0 to 5 scale (faint to strong). The odor testing data can then be plotted on three separate spider graphs with the distance along each length of the spider graph representing the 0 to 5 scale. Three spider graphs are shown in Figure 5. Specific odor descriptors are represented on a histogram, which presents the percentage of assessors that assigned specific descriptors to the odor sample. An example histogram is also shown in Figure 5.
Through training, all assessors set aside their personal feelings and biases and make objective decisions regarding character identification by referencing standard designated categories.
SUMMARY
Sample No. 101 and the other odor samples from the sample set were tested by the odor panel to determine concentration, intensity, persistency, character and Hedonic tone. The results of testing Sample No. 101 are summarized below:
Detection Threshold 420
Recognition Threshold 190
Intensity as ppm n-butanol 33
Slope of Dose-Response Function (m) - 0.30
Intercept of Dose-Response Function (b) 1.52
Character Descriptors Sewer Ammonia Amine
REFERENCES
ASTM E544-99, Standard Practice for Suprathreshold Odor Intensity Measurement, American Society for Testing and Materials, Philadelphia, PA: 1999.
ASTM E679-91, Standard Practice for Determination of Odor and Taste Threshold By a
Forced-Choice Ascending Concentration Series Method of Limits, American Society for Testing
and Materials, Philadelphia, PA: 1991.
Dravnieks, Andrew and Frank Jarke, “Odor Threshold Measurement by Dynamic Olfactometry: Significant Operational Variables.” Journal of the Air Pollution Control Association, 30: 1284-1289. December 1980.
Dravnieks, Andrew, Walther Schmidtsdorf, and Morten Mellgaard, “Odor Thresholds by Forced-Choice Dynamic Triangle Olfactometry: Reproducibility and Methods of Calculation.” Journal of the Air Pollution Control Association, 36: 900-905. August 1986.
Mac Berthouex, Paul and Linfield C. Brown, Statistics for Environmental Engineers. Lewis Publishers (CRC Press), Boca Raton, FL: 1994.
McGinley, Charles M. and Donna L. McGinley, “Diary of an Odor Sample - Understanding Odor Testing.” Presented at the Virginia Water Environment Federation 1999 Education Seminar, Richmond, VA: November 4, 1999.
McGinley, Michael A. and Charles M. McGinley, “The ‘Gray Line’ Between Odor Nuisance and Health Effects.” Presented at the 92nd Annual Air and Waste Management Association Meeting & Exhibition, St. Louis, MO: June 20-24, 1999.
prEN 13725 – DRAFT: Air Quality – Determination of Odour Concentration by Dynamic
Olfactometry. European Committee for Standardization (CEN), September 1999.
Stevens, S.S., “The Psychophysics of Sensory Function.” American Scientist, 48: 226-253. 1960.
Stevens, S.S., “The Surprising Simplicity of Sensory Metrics.” American Psychologist, 17: 29-39. 1962.
Turk, Amos, Edward D. Switala, and Samuel H. Thomas, “Suprathreshold Odor Measurement by Dynamic Olfactometry: Principles and Practice.” Journal of the Air Pollution Control Association, 30:1289-1294. December 1980.
Webster’s Seventh New Collegiate Dictionary. G. & C. Merriam Company, Springfield, Massachusetts: 1963.
Figure 2: Odor Testing Data Sheet from
Odor Evaluation Laboratory
Olfactometer Evaluation Results
AC'SCENT® International Olfactometer Page 1 of 1
Test Name : Municipal WWTP Test No. : 3847 Test Date : 12/17/99 Test Administrator : John Doe Test Method : Triangular Forced Choice
Flow Rate (lpm) : 20 Sniff Time (sec) : 3
SAMPLE INFORMATION Sampling Date : 12/16/99
Lab No. : 1 Field No. : 1864-25 Sampling Time : 13:55
Description : Scrubber B - Outlet Sample Collector : Jane Smith
Sample Source : Scrubber B - Outlet
Dilution Level 1 2 3 4 5 6 7 8 9 10 11 12 13 14 Calibration Date :
Sample Volume 0.3 0.6 1.3 2.5 5.0 10.0 20.0 40 80 160 320 640 1250 2500 12/17/99
Total Volume 20,000 20,000 20,000 20,000 20,000 20,000 20,000 20,000 20,000 20,000 20,000 20,000 20,000 20,000 THRESHOLDS
Dilution Ratio 66,667 33,333 16,000 8,000 4,000 2,000 1,000 500 250 125 63 31 16.0 8.0 G = Guess
Geometric Mean 94,281 47,140 23,094 11,314 5,657 2,828 1,414 707 354 177 88 44 22.4 11.3 D = Detection
Log (Geo. Mean) 4.97 4.67 4.36 4.05 3.75 3.45 3.15 2.85 2.55 2.25 1.95 1.65 1.35 1.05 R = Recognition
Assessor/Round Log G Log D Log R
101 1 2 1 6 8 2.85 2.85 2.55 102 1 2 1 1 6 8 2.55 2.55 2.25 103 1 2 1 2 6 6 8 2.85 2.55 1.95 104 1 1 2 6 6 8 3.15 2.85 2.25 105 1 1 2 8 3.15 2.85 2.85 106 1 2 1 1 1 6 8 2.25 2.25 1.95 107 1 1 2 2 6 8 3.15 2.55 2.25 108 1 2 1 2 6 8 2.85 2.55 2.25
Sample Comments : Final Results
Response Key: G D R
Specific Chemical Concentration Data 1 = Incorrect Guess Avg. Log Value 2.85 2.62 2.29 2 = Correct Guess
Chemical : 5 = Incorrect Detection Std. Dev. 0.32 0.21 0.30
Concentration (ppm) : 6 = Correct Detection Threshold 707 420 193 7 = Incorrect Recognition
8 = Correct Recognition