Complexome Profiling Identifies
TMEM126B as a Component
of the Mitochondrial Complex I Assembly Complex
Heinrich Heide,
1,6Lea Bleier,
1,6Mirco Steger,
1Jo¨rg Ackermann,
2Stefan Dro¨se,
1Bettina Schwamb,
3Martin Zo¨rnig,
3Andreas S. Reichert,
4,5Ina Koch,
2Ilka Wittig,
1,*
and Ulrich Brandt
1,*
1Molecular Bioenergetics Group, Medical School, Cluster of Excellence Frankfurt ‘‘Macromolecular Complexes,’’ Goethe University, Theodor-Stern-Kai 7, 60590 Frankfurt am Main, Germany
2Molecular Bioinformatics Group, Institute of Computer Science, Faculty of Computer Science and Mathematics, Robert-Mayer-Straße 11–15, 60325 Frankfurt am Main, Germany
3Chemotherapeutisches Forschungsinstitut Georg-Speyer-Haus, Paul-Ehrlich-Straße 42–44, 60596 Frankfurt am Main, Germany 4Mitochondrial Biology, Buchmann Institute for Molecular Life Sciences, Goethe University Frankfurt am Main, Max-von-Laue-Straße 15, 60438 Frankfurt am Main, Germany
5Mitochondriale Biologie, Zentrum fu¨r Molekulare Medizin, Goethe Universita¨t Frankfurt am Main, Max-von-Laue-Straße 15, 60438 Frankfurt am Main, Germany
6These authors contributed equally to this work
*Correspondence:[email protected](I.W.),[email protected](U.B.) http://dx.doi.org/10.1016/j.cmet.2012.08.009
SUMMARY
Macromolecular complexes are essential players
in numerous biological processes. They are often
large, dynamic, and rather labile; approaches to
study them are scarce. Covering masses up to
30
MDa, we separated the native complexome of rat
heart mitochondria by blue-native and large-pore
blue-native gel electrophoresis to analyze its
con-stituents by mass spectrometry. Similarities in
migra-tion patterns allowed hierarchical clustering into
interaction profiles representing a comprehensive
analysis of soluble and membrane-bound complexes
of an entire organelle. The power of this
bottom-up approach was validated with well-characterized
mitochondrial multiprotein complexes. TMEM126B
was found to comigrate with known assembly factors
of mitochondrial complex I, namely CIA30, Ecsit, and
Acad9. We propose terming this complex
mitochon-drial complex I assembly (MCIA) complex.
Further-more, we demonstrate that TMEM126B is required
for assembly of complex I. In summary, complexome
profiling is a powerful and unbiased technique
allow-ing the identification of previously overlooked
com-ponents of large multiprotein complexes.
INTRODUCTION
Macromolecular assemblies of proteins of different size and
complexity play an essential role in a broad range of cellular
processes. Such complexes may exist as stable entities or
may form transient intermediates. Defining the composition
and functional dynamics of such assemblies are formidable
chal-lenges, but the number of suitable methods is rather limited.
Immunoprecipitation or tandem affinity protocols in
combina-tion with western blotting and mass spectrometry are widely
used to identify interaction partners of specific proteins.
How-ever, these approaches are limited to a selected subset of
the cellular interactome and provide hardly any insight into
the actual composition and biochemical properties of the
under-lying complexes. To overcome these limitations, fractionation of
the native complexes by mild nondestructive techniques like
density gradient centrifugation, size-exclusion chromatography,
and native electrophoresis is required. These approaches have
been successfully applied to define even very large multiprotein
complexes, e.g., the human centrosome (
Andersen et al., 2003
),
pyruvate dehydrogenase and other complexes from
chloro-plasts (
Olinares et al., 2010
), and respiratory chain
supercom-plexes in mitochondria (
Wittig et al., 2006b
). Mass spectrometric
analysis of samples fractionated by these techniques has been
applied to identify the constituents of whole organelles (
Foster
et al., 2006
) or multiprotein complexes (
Wessels et al., 2009
).
Density gradient centrifugation requires rather large amounts
of protein and suffers from low resolution. The use of better
resolving size-exclusion columns leads to significant sample
dilution and cannot be used for complexes larger than 5 MDa.
Therefore, blue-native electrophoresis (BNE) (
Wittig and
Scha¨g-ger, 2009
;
Wittig et al., 2006a
) is the method of choice for
sensi-tive and high-resolution fractionation of the ‘‘complexome’’ of
entire cells or subcellular compartments. It has been
demon-strated that even rather labile macromolecular assemblies can
be separated by BNE and analyzed directly by mass
spectrom-etry (
Wessels et al., 2009
;
Sokolova et al., 2010
;
Remmerie et al.,
2011
). With the recently introduced large-pore blue-native
elec-trophoresis (LP-BNE), now extremely large macromolecular
assemblies up to a molecular mass of
45 MDa can be
sepa-rated (
Strecker et al., 2010
).
Here, we report the analysis of the entire complexome of
intact rat heart mitochondria. Native complexes up to a size
of
30 MDa were separated by BNE and LP-BNE, and
complex-ome profiles of the proteins identified by label-free quantitative
mass spectrometry were constructed by hierarchical clustering.
This bottom-up complexome profiling analysis allowed us to
identify a number of soluble and membrane-bound
macromolec-ular assemblies from different mitochondrial sub-compartments.
We found TMEM126B as a previously overlooked component of
the mitochondrial complex I assembly factor (MCIA) complex
and show that this protein is indeed required for the formation
of respiratory chain complex I.
RESULTS
Validation of the Complexome Profiling Approach
To establish and validate the complexome profiling approach,
we used intact rat heart mitochondria as a readily available
and defined subcellular compartment containing a number of
well-characterized soluble and membrane bound multiprotein
complexes. Mitochondria were prepared from hearts of young
male Wistar rats. The respiration rate in the active state with
glutamate/malate was 220 nmol O
$
mg
1$
min
1, and the
respi-ratory control factor was >9, indicating high purity and intactness
of the mitochondria. After solubilization with the mild detergent
digitonin, and separation by BNE and LP-BNE,
second-dimen-sion SDS-PAGE showed the typical and well established (
Wittig
et al., 2006a
;
Wittig et al., 2006b
;
Strecker et al., 2010
) patterns of
the complexes of the mitochondrial oxidative phosphorylation
(OXPHOS) system, namely respiratory supercomplexes (S
4–S
1),
and individual complexes (I–V) as monomers and dimers (
Fig-ures 1
A and 1B). From the silver-stained gels, the presence of
a number of additional complexes was evident that are
diffi-cult to define by this classical two-dimensional electrophoretic
approach.
We cut native first dimension BNE and LP-BNE lanes into 60
even slices, subjected them to tryptic digest, and analyzed the
resulting peptides by online nano-LC/ESI mass spectrometry.
By matching spectra against the enhanced UniProt database
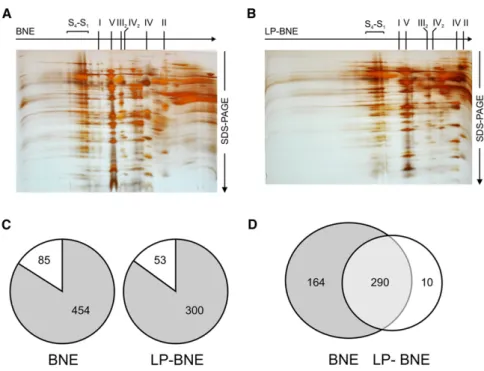
Figure 1. Separation of Mitochondrial Complexes by 2D BNE/SDS-PAGE and Assignment of Identified Proteins
S4–S1, respiratory supercomplexes as defined
(Wittig et al., 2006b); I, II, IV, OXPHOS complexes I, II, IV; III2, IV2, dimers of OXPHOS complexes III, IV.
(A) First dimension 4%–16% acrylamide BNE gel, second dimension 16% SDS Tricine PAGE, fol-lowed by silver staining.
(B) First dimension 3%–9% acrylamide LP-BNE gel, second dimension 16% SDS Tricine PAGE, followed by silver staining.
(C) Proteins were assigned to mitochondria using the MitoMiner 2.0 tool (Smith and Robinson, 2009) and by the Mitoprot II algorithm (Claros and Vincens, 1996); probability score > 0.5. Grey, mitochondrial proteins; white, nonmitochondrial proteins.
(D) Venn diagram illustrating the fraction of mito-chondrial proteins identified in both gel types.
for
Rattus norvegicus
(
UniProt
Consor-tium, 2012
), we identified a total of 539
proteins in the BNE gel and 353 proteins
in the LP-BNE gel. In both gel types, about 85% of the proteins
could be assigned to mitochondria, confirming the high purity of
the sample (
Figure 1
C). In total, 464 mitochondrial proteins were
identified, of which 63% were present in both gels (
Figure 1
D).
Based on their relative abundance in different gel slices, the
identified proteins were hierarchically clustered by uncentered
correlation and single linkage with the Cluster 3.0 program (
Eisen
et al., 1998
;
de Hoon et al., 2004
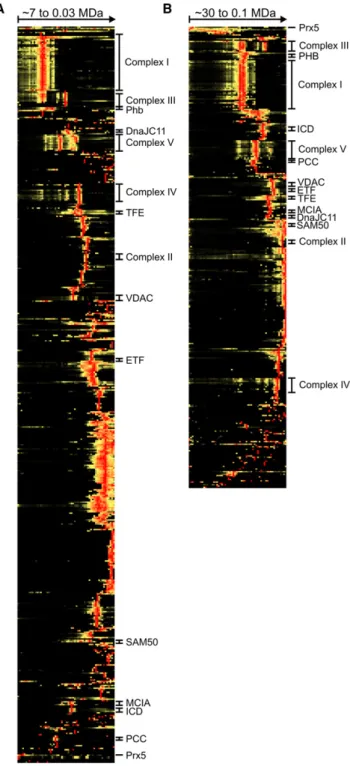
). From heat map illustrations of
the resulting profiles (
Figure 2
and
Table S1
, parts A and B,
available online), groups of comigrating proteins are
immedi-ately apparent, of which the multiprotein complexes I–V of the
OXPHOS system were most prominent. Reflecting their
pres-ence in supercomplexes of different composition, the subunits
of complexes I, III, and IV were present in a number of different
slices of the two gels. Also the previously reported formation of
complex V monomers, dimers, and higher oligomers was clearly
observed.
The respiratory chain complexes and their supercomplexes
have been used previously to calibrate native gel systems
(
Strecker et al., 2010
;
Wittig et al., 2010
;
Ladig et al., 2011
). A
plot of the calculated molecular masses against the slices of
the two gels, in which the respective complexes were identified
by complexome profiling, shows that the migration distance of
the complexes was proportional to the logarithm of their
molec-ular masses (
Figure S1
). Based on this calibration, we estimated
separation ranges up to
7 MDa for the BNE gel and up to
30
MDa for the LP-BNE gel, and we could assign approximate
masses to the individual gel slices analyzed by LC-MS/MS
(
Table S1
, parts A and B).
To validate our approach, we next determined which of the 90
constituent proteins of OXPHOS complexes I–V had been
iden-tified and how many of them were correctly grouped into the
respective complexes (
Table 1
). In the BNE gel, 91% and in
the LP-BNE gel, 86% of the known subunits were identified, of
which almost 90% where correctly grouped into their respective
complexes in both gels. The proteins not identified were either
highly hydrophobic subunits (e.g., cytochrome
b
of complex III;
subunits ND6 and ND4L of complex I) or were very small proteins
of masses <10 kDa (
Table S2
). Both types of proteins tend to
pose problems in a standard mass spectrometric analysis, since
they give rise to only very few detectable peptides.
Mitochondrial Complexes Identified by Complexome
Profiling
As evident from the heat map representations of the native gel
profiles (
Figure 2
), a number of other proteins seemed to form
large complexes. Based on their migration profile, they were
grouped together by hierarchical clustering. To explore the
potential of the complexome profiling approach, we analyzed
a selected number of these complexes in more detail. The
composition and characteristics of nine of these complexes
are summarized in
Table S3
, and their migration patterns are
shown in
Figure 3
.
The crystal structure of a 780 kDa
a
6b
6dodecamer of
pro-pionyl-CoA carboxylase of the mitochondrial matrix (
Figure 3
A)
has been solved recently (
Huang et al., 2010
). Indeed, this
complex was found to migrate in both gel types at an apparent
molecular mass that was very close to the calculated value.
This indicated that the mass calibration (
Figure S1
) was also valid
for soluble complexes. Mammalian NAD-dependent isocitrate
dehydrogenase of the citric acid cycle is known to form an
oligomeric complex with an
a
2b
1g
1subunit ratio of unknown
multiplicity (
Ramachandran and Colman, 1980
). Well-defined
apparent masses of 460 kDa in the LP-BNE and 300 kDa in
BNE (
Figure 3
B) suggested that at least a
a
6b
3g
3multimer was
present in rat heart mitochondria. This complex seemed to
have lost one tetrameric unit under the conditions of BNE, which
however was not observed as a separate entity. We conclude
that in LP-BNE larger and more labile complexes could be
retained, since also for the trifunctional enzyme, smaller
com-plexes were detected in BNE (
Figure 3
C). For this enzyme
complex of the fatty acid
b
-oxidation pathway, formation of an
a
4b
4octamer has been reported (
Uchida et al., 1992
). However,
this 508 kDa complex appeared as a minor component in
both native gels. Rather, the
a
2b
2tetramer seemed to be the
dominant species, although a small amount of the even larger
a
8b
8complex was also detectable at about 1,100 kDa. A
350 kDa complex in LP-BNE and a 170 kDa complex in BNE
most likely corresponded to
a
3b
2and
a
1b
2breakdown products
of larger species, as suggested by the relative intensities of the
two proteins. In BNE, monomers were also observed. Electron
transfer flavoprotein (ETF) shuttles reducing equivalents from
the
b
-oxidation to the respiratory chain. In the LP-BNE profile,
we observed complexes at apparent masses of about 250 kDa
and 460 kDa that could correspond to the
a
4b
4and
a
8b
8hetero-multimers of ETF (
Figure 3
D). In the BNE profile, the 60.5 kDa
Figure 2. Overview Heat Maps of Complete Complexome Profiles Positions of complexes are indicated. SeeFigure 3for abbreviations and text for further details. For heat maps including details of the identified proteins, see Table S1, parts A and B. BNE (A) and LP-BNE (B) are shown. See also Fig-ure S1andTable S1.
Table 1. Identification and Clustering Coverage of OXPHOS Complex Subunits
Complex Known Subunitsa
LP-BNE BNE
Identified Clustered Identified Clustered
I 45 40 37 42 38 II 4 4 3 4 4 III 11 9 7 10 9 IV 13 9 8 10 10 V 17 15 13 16 12 Total 90 77 68 82 73
See alsoTable S2.
heterodimer was detected, but the most prominent species
was a 100 kDa complex that in addition contained the 42 kDa
short chain acyl-CoA dehydrogenase, one of the physiological
electron donors of ETF. The interaction between ETF and one
of its electron donors, the medium chain specific acyl-CoA
dehydrogenase, was modeled earlier in a molecular docking
study (
Roberts et al., 1996
), but not observed experimentally.
We also detected a whole series of different multimeric
com-plexes of peroxiredoxin-5 ranging from 120 kDa to 24 MDa
(
Figure 3
E). Peroxiredoxin-5 is a major component of the
antiox-idant defense in the mitochondrial matrix and belongs to the
class of atypical 2-Cys peroxiredoxins (
Cox et al., 2010
). Redox
state-dependent formation of dodecameric toroids and
higher-ordered structures (filaments of laterally stacked toroids) has
been observed for typical 2-Cys peroxiredoxins (
Gourlay et al.,
2003
). In contrast, large multimeric structures, as observed
here, have not been described before for atypical peroxiredoxins
(
Cox et al., 2010
).
As the most prominent complex of the outer mitochondrial
membrane, we observed a 270–280 kDa complex of the voltage
dependent anion channel (VDAC) also known as mitochondrial
porin. This mass came up as the dominant species in both gel
types and fits well with the expected size of nonamers of all three
isoforms (
Figure 3
F). Smaller oligomeric states of VDAC with
variable stoichiometries have been reported before (
Zalk et al.,
2005
;
Gonc¸alves et al., 2007
). As an example of a more
compli-cated situation, we had a closer look at the complexes
contain-ing SAM50, a protein known to be involved in the assembly of
mitochondrial outer membrane proteins, including VDAC (
Koz-jak-Pavlovic et al., 2007
). Metaxin2 was proposed to be the
mammalian analog of yeast SAM35, but its association with
SAM50 has been challenged (
Kozjak-Pavlovic et al., 2007
). The
two proteins exhibited a very similar migration profile and,
sug-gesting a strong interaction, were grouped together by the
clus-tering algorithm in both native gels (
Figure 3
G).
Xie et al. (2007)
suggested interactions of these two proteins with several other
molecules including Metaxin1 and DnaJC11, which we also
identified in both gels. Metaxin1 and DnaJC11 indeed were
con-sistently found to group together and exhibited a profile that
partially overlapped with that of SAM50 and Metaxin2. While
the complexes migrating at around 250 kDa and 350 kDa
seemed to contain all four proteins, the 190 kDa complex lacked
DnaJC11, and the prominent peaks at around 120 kDa only
con-tained SAM50 and Metaxin2 (
Figure 3
G, bottom panel). In the
inner mitochondrial membrane, the prohibitins are known to
form a ring-like chaperone complex of a total mass of 1.0–1.3
MDa (
Nijtmans et al., 2000
;
Tatsuta et al., 2005
). We found these
multimeric structures in both profiles (
Figure 3
H). The LP-BNE
profile showed almost exclusively the larger variant apparently
containing 20 copies of each isoform of prohibitin, suggesting
that this is the predominant native state of the complex.
TMEM126B Is Part of the Mitochondrial Complex I
Assembly Complex
Another complex that could be assigned to the mitochondrial
matrix had an apparent mass of 320 kDa and contained the
two complex I assembly factors CIA30 (NDUFAF1) and Ecsit
(
Figure 3
I). Functional interaction between CIA 30 and Ecsit
and their presence in larger complexes has been reported, but
these complexes have not been characterized in any detail (
Vo-gel et al., 2007b
). In addition to the 320 kDa complex that we
observed in both gel types, a 540 kDa complex was found only
in the BNE profile. In this case however, it seemed that, rather
than from disintegration of the larger complex, this difference
re-sulted from the fact that we simply failed to detect this species in
LP-BNE. Even for the more abundant 320 kDa complex, the
number of identified peptides and the sequence coverage was
very low for both proteins in the LP-BNE profile (
Table S1
).
Acad9, a recently identified complex I assembly factor reported
to interact with CIA30 and Ecsit (
Nouws et al., 2010
), was also
found to comigrate with these proteins, suggesting that it was
also a component of this assembly factor complex. However,
Acad9 was not grouped with the others by hierarchical
clus-tering, because the migration profile differed due to a large
frac-tion of monomer present in the mitochondria.
Interestingly, we found that TMEM126B, a mitochondrial
transmembrane protein of so far unknown function also
clus-tered with CIA30 and Ecsit by virtue of its highly similar BNE
migration profile that it also shared with Acad9 (
Figure 3
I). To
test whether TMEM126B was indeed a previously overlooked
component of the complex I assembly machinery, we diminished
TMEM126B
expression in 143B osteosarcoma cells by
lentivi-ral shRNA transduction. Quantitative real-time PCR revealed
knockdown efficiencies of at least 60% for all six different
shRNAs sequences (data not shown). A first assessment at the
protein level by activity staining after high-resolution clear native
electrophoresis (hrCNE) (
Wittig et al., 2007
) revealed markedly
reduced amounts of complex I-containing supercomplexes
with three of the short hairpin RNAs (shRNAs) (V2LHS_175840,
V3LHS_365049, and V3LHS_365046;
Figure S2
A). In human
mitochondria, complex I is found exclusively as a component
of respiratory supercomplexes since it requires complex III for
stability (
Scha¨gger et al., 2004
;
Moreno-Lastres et al., 2012
). In
all three knockdown cell lines transduced with
TMEM126B
shRNA and exhibiting strong effects on complex I assembly,
the amount of
TMEM126B
mRNA was lowered by about 70%
(
Figure S2
B).
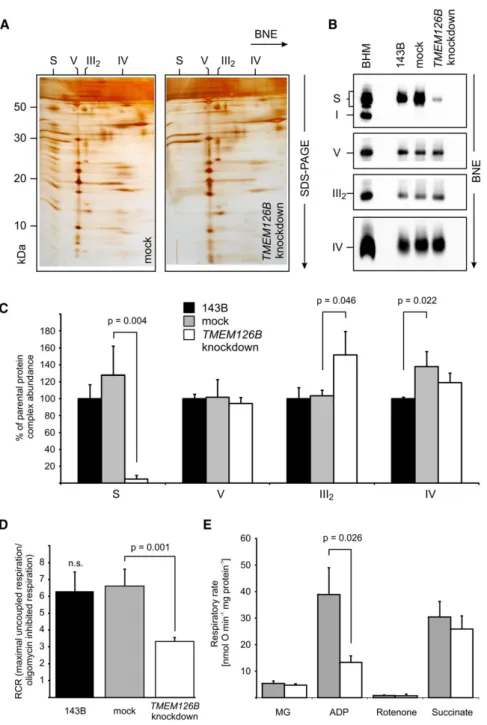
For a more detailed analysis of the effects of
TMEM126B
knockdown on respiratory chain assembly and function we
used the 143B cell line that had been lentivirally transduced by
shRNA V2LHS_175840; hardly any supercomplex pattern could
be observed in enriched mitochondrial membranes from these
TMEM126B
knockdown cells in silver-stained 2D BNE/Tricine
SDS gels (
Figure 4
A). This finding was confirmed by BNE
western blot (
Figure 4
B) and densitometric analysis. Compared
to mock-transduced 143B cells, a residual level of only 5%
complex I was present as component of respiratory
supercom-plexes in the
TMEM126B
knockdown cells (
Figures 4
B and
4C). In contrast,
TMEM126B
knockdown did not reduce the
levels of respiratory complexes III, IV, and V. We noted that
mock-transduced cells showed moderately higher levels of
supercomplexes and individual complex IV compared to 143B
parental cell line. The levels of complex III were significantly
higher in
TMEM126B
knockdown cells (
Figure 4
C), which we
attribute to the fact that less of the complex III dimer could be
integrated in the respiratory supercomplexes.
To
characterize
the
functional
consequences
of
the
by high-resolution respirometry. Consistent with the reduced
levels of complex I, the respiratory control ratio as an indicator
of tight coupling of oxidative phosphorylation and respiratory
excess capacity was reduced by about 50% (
Figure 4
D). To
further test whether the observed respiratory defect was indeed
exclusively due to a complex I deficiency, we went on to isolate
Figure 3. Migration Profiles of Selected Complexes
Each panel shows the relative abundance of identified proteins plotted against the apparent molecular mass for LP-BNE (top) and BNE (bottom) gels. The colors used for each protein are indicated as a legend in the respective plot. Corresponding heat map segments are shown above each plot. SeeTable S3and the main text for further details. propionyl-CoA carboxylase (PCC) complex (A), isocitrate-dehydrogenase (ICD) complex (NAD-dependent) (B), trifunctional enzyme (TFE) complex(C), electron-transferring flavoprotein (ETF) complex (D), peroxiredoxin-5 (Prx5) complex (E), voltage-dependent anion channel (VDAC) complex (F), SAM50/DnaJC11 complex, manually assembled (G) (see the main text for details), prohibitin complex (Phb) (H), and complex I assembly factor complex (I). Acad9 was added manually (see the main text). See alsoFigure S1andTable S3.
Figure 4. TMEM126B Knockdown Results in Complex I Defect
(A) Silver-stained 2D BNE/SDS tricine PAGE of enriched mitochondrial membranes.
(B) Representative BNE western blots of OXPHOS complexes in enriched mitochondrial membranes. CI-NDUFB8, CIII-Core2, and CV-a,b, were se-quentially decorated on the same blot. CIV-COX6 was detected on a second blot.
(C) Densitometric quantification of OXPHOS complexes in BNE Western blots. Assignment of complexes: S, supercomplex containing complex I, III2, and IV; III2, complex III dimer; IV, complex IV;
V, complex V/ATP synthase. BHM, bovine heart mitochondria as mass ladder.
(D) High-resolution respirometry of intact cells. The respiratory control ratio is expressed as ratio between maximally uncoupled respiration (after subsequent additions of 1mM FCCP) and oligo-mycin (2mg/ml) inhibited respiration.
(E) High-resolution respirometry of intact mito-chondria from mock andTMEM126Bknockdown cells. Substrates or inhibitors were added with the following concentrations: 4.8/5.6 mM malate/ glutamate, 2 mM ADP, 10mM rotenone, 5 mM succinate.
Data presented are the mean values of three independent experiments ± SD (C) or ± SEM (D and E). See alsoFigure S2.
intact mitochondria from cultured cells by
differential centrifugation.
High-resolu-tion respirometry revealed a reducHigh-resolu-tion in
respiration by about two-thirds after
TMEM126B
knockdown only when the
electrons were fed into complex I via the
NADH-linked
substrates
malate
and
glutamate in ADP-stimulated
mitochon-dria (
Figure 4
E). In contrast, succinate
driven respiration through complexes II,
III, and IV was unaffected.
Next, we asked whether in the absence
of TMEM126B the remaining complex I
assembly factors were retained as a
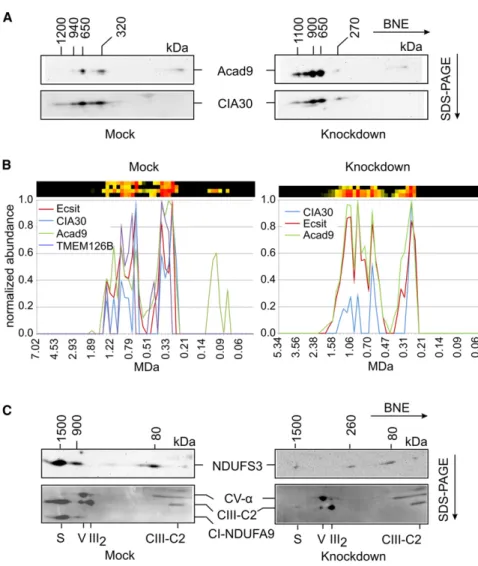
residual MCIA complex. Western blotting
of 2D BNE/SDS-PAGE gels from intact
mitochondria with Acad9 and
anti-CIA30 antibodies (
Figure 5
A) confirmed the presence of
a 320 kDa MCIA complex in mock-transduced cells. In
TMEM126B
knockdown cells we observed a complex
contain-ing Acad9 and CIA30, but at a somewhat lower mass of
270 kDa. In contrast to mitochondria from rat heart (
Figure 4
I),
in both samples complexes containing Acad9 and CIA30 were
detected also at higher masses above 600 kDa (
Figure 5
A). This
was also evident when we analyzed the 143B cell lines by
com-plexome profiling (
Figure 5
B). We reasoned that these larger
complexes represented intermediates of complex I assembly
that were present in detectable amounts only in the fast
prolifer-ating 143B cells, but not in the postmitotic heart muscle. We thus
checked for the presence of two complex I subunits, NDUFS3
and NDUFA9, in these complexes by western blotting (
Fig-ure 5
C). In mitochondrial membranes from mock-transduced
cells, both subunits were detected mostly at about 1,500 kDa,
representing their assembly into fully assembled complex I as
part of a respiratory supercomplex S1. NDUFS3 seemed to be
present also in a number of assembly intermediates with
complexes at about 80 and 900 kDa being most prominent, while
subunit NDUFA9 was only present in the 900 kDa band. In the
TMEM126B
knockdown cells only the early 80 kDa and
260 kDa assembly intermediates were detected by the NDUFS3
antibody. Consistent with the presence of a residual
5%
super-complex (
Figure 4
), a weak signal at 1,500 kDa was also detected
in the knockdown cells (
Figure 5
C). In the complexome profiles
(
Figure 5
B), we further noted that the relative abundance of
the larger complexes was different between the two cell
lines, as was the relative distribution of CIA30. On the other
Figure 5. Effect of TMEM126B Knockdown on the Other Assembly Factors of the MCIA Complex
(A) 2D BNE/SDS-PAGE western blots of intact mitochondria isolated from mock andTMEM126B knockdown cells. Blots were decorated first with anti-Acad9 and subsequently with anti-CIA30 antibodies. Mass calibration was derived from the complexome profiling analysis performed in parallel.
(B) Migration profiles of the MCIA complex assembly factors obtained by complexome pro-filing of intact mitochondria isolated from mock-transduced and TMEM126B knockdown cells. The profiles are presented as indicated in the legend toFigure 3. OXPHOS complexes were used for mass calibration (data not shown). (C) 2D BNE/SDS-PAGE western blots of enriched mitochondrial membranes of mock-transduced andTMEM126Bknockdown cells, decorated first with anti-complex I-NDUFS3 (top panel) and afterward with an antibody mix detecting subunits of complex I and several OXPHOS complexes that were used for mass calibration. CV-a,a-subunit of complex V; CIII-C2, core 2 protein of complex III; CI-NDUFA9, subunit NDUFA9 of complex I; S, supercomplex S1; V, complex V; III2, dimer of
complex III.
hand, Acad9 was detected by mass
spectrometry at lower masses only in
the mock-transduced cells, although
western blotting suggested that small
amounts were also present in the
knock-down cells (
Figure 5
A). These differences
cannot be explained at present and will
need further investigation.
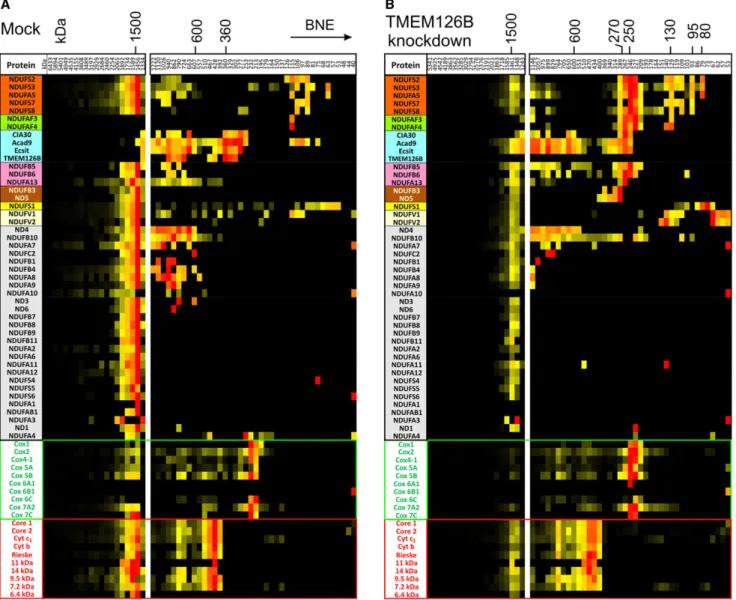
For a more comprehensive assessment of the complex I
assembly intermediates, we then analyzed the distribution of
complex I subunits and complex I assembly factors in the
com-plexome profiles of mock and knockdown cell lines (
Figure 6
).
For comparison, we also included the subunits of complexes III
and IV in this analysis. In the profile of mitochondria from mock
cells, 40 of 45 subunits of complex I were identified in a complex
of around 1,500 kDa. Confirming that this band corresponded to
respiratory supercomplex S1, eight proteins of complex IV and
10 proteins of complex III were found to comigrate with these
complex I subunits. Most of these proteins were also detected
at about the same mass in mitochondria from
TMEM126B
knockdown cells, but as expected at much lower abundance.
For complex IV, the monomer at about 220 kDa and for complex
III, the dimer at about 470 kDa became the dominating species.
Although the amount for many of the complex I subunits was too
low for detection in the mass range below 1,200 kDa, the majority
of them could be identified also here (
Figure 6
; note that for
better visualization the normalization of the protein amounts
were performed differently in the ranges above and below about
1,200 kDa). Like the proteins of the MCIA complex, the complex I
subunits seemed to be distributed over a wide mass range
re-flecting a number of different assembly intermediates. Several
important observations could be made that provided first
insights into the function of the MCIA complex. In the
mock-transduced cells, predominantly larger complex I assembly
intermediates were found that were much less abundant in the
TMEM126B
knockdown cells. Several smaller intermediates of
components of the Q module (
Figure 6
, orange) and the
mono-meric 75 kDa subunit NDUFS1 (
Figure 6
, yellow) were found in
both cell lines. Interestingly, as expected from earlier studies
(
Vogel et al., 2007a
), the assembly factors NDUFAF3 and
NDU-FAF4 (
Figure 6
, green) were found associated with the preformed
Q module at about 120–130 kDa. These factors were also
present in an
250 kDa complex that prominently accumulated
in the knockdown cells, suggesting that removal of TMEM126B
had stalled assembly at this stage. In line with current models
of complex I assembly (
Mckenzie and Ryan, 2010
), indications
for the accumulation of other intermediates were also found,
like an
270 kDa complex containing NDUFB6 (
Figure 6
, pink)
and a slightly larger complex containing subunit ND5 (
Figure 6
,
brown). Moreover, the so-called flavoprotein, containing
sub-units NDUFV1 and NDUFV2, that is known to be integrated at
a much later stage of assembly was found to accumulate in
the knockdown cells (
Figure 6
, light yellow). Overall, these
obser-vations demonstrate that complexome profiling will also be a
powerful tool to analyze the assembly process of multiprotein
complexes. However, a more detailed analysis of complex I
assembly would go far beyond the scope of the present study.
DISCUSSION
With the complexome profiling approach described here, it was
possible to analyze the whole set of multiprotein assemblies in a
subcellular compartment up to a molecular mass of
30 MDa.
Figure 6. Respiratory Chain Complexes, Complex I Assembly Intermediates, and Assembly Factors in Mitochondria
Mock-transduced cells (A) and TMEM126B knockdown cells (B). Manually assembled partial complexome profiles of complex I subunits and assembly factors are shown as heat map representation. For the supercomplexes (left panels), the profiles from both cell lines were normalized together to enable direct quantitative comparison. For visualization of complex I assembly intermediates present in very small amounts, below 1,200 kDa the profiles were normalized separately, omitting the slices containing the supercomplexes (right panels). The colors used to group some of the identified proteins are explained in the main text.
The proteomic profiles of the native gels yielded insight into the
size, composition, and stability of soluble and membrane-bound
complexes at very high resolution and sensitivity. The potential
of the method could be clearly demonstrated, given that already
the analysis of one sample with two different gel types under
otherwise identical conditions provided a remarkable number
of findings regarding the properties of different types of
mito-chondrial complexes. Not only prominent complexes like the
components of the mitochondrial OXPHOS system, but also
rather low abundant complexes, e.g., of the SAM50 system,
were detected. Application of the hierarchical clustering
ap-proach that grouped proteins together based on their specific
migration profile allowed us to differentially assign specific
pro-teins even to complexes of similar or virtually identical size (
Fig-ure 4
and
Table S3
).
Some of the analyzed complexes behaved differently in the
two gel types in the sense that they seemed to be less stable
in BNE. In combination with information on the composition
and size of the complexes also derived from the complexome
profiles, these differences in stability can deliver valuable
infor-mation on the network of protein-protein interactions. This is
exemplified here by the differential association of SAM50 with
the Metaxins and other proteins (
Figure 4
H). Thus, the use of
two types of native gels, the standard BNE (
Wittig et al., 2006a
)
and its large-pore variant LP-BNE (
Strecker et al., 2010
), not
only extended the covered mass range, but also demonstrated
another useful feature of the complexome profiling approach
that opens a broad range of potential applications to study the
dynamics and stability of macromolecular complexes. To this
end, for specific applications in addition to the gel type and
acrylamide gradient range, other experimental parameters like
amount and type of the cathode buffer, detergents, pH value,
and other additions used for solubilization can be varied to
exploit the full potential of the method.
Using complexome profiling, we found TMEM126B—a
mito-chondrial protein of unknown function—associated with a
com-plex I assembly factor comcom-plex (
Figure 4
I). Removal of this
protein by shRNA-mediated gene knockdown in a human cell
line almost completely and specifically abolished complex I
assembly and severely impaired mitochondrial respiration,
indi-cating that TMEM126B is indeed an essential component of
the complex I assembly machinery. Ecsit and CIA30 have been
shown to be associated with assembly intermediates of complex
I and to be involved in the assembly of its membrane arm (
Laz-arou et al., 2007
). Thus, it seems plausible that the crucial
func-tion of the membrane protein TMEM126B consists of recruiting
the hydrophilic proteins CIA30, Ecsit, and Acad9 to the
mem-brane to form a functional mitochondrial complex I assembly
complex. An earlier study showed that knockdown of Ecsit
re-sulted in decreased expression levels of CIA30 (
Vogel et al.,
2007b
). In contrast, knockdown of
TMEM126B
had apparently
no effect on the stability of the remaining soluble MCIA assembly
factors, which were found to still form a complex in the absence
of TMEM126B. Compared to the mock sample, the observed
mass shift in the
TMEM126B
knockdown cells most probably
re-sulted from loss of TMEM126B. In an earlier study, Vogel et al.
had also observed large complexes at 850, 600, and 500 kDa
containing the MCIA components Ecsit and CIA30 (
Vogel et al.,
2007b
). Remarkably, predominantly larger assembly
intermedi-ates of complex I were also found in mock-transduced 143B
cells but not in rat heart mitochondria. This may reflect a
charac-teristic difference between fast-proliferating cells and a
postmi-totic tissue. Although we could not perform a more detailed
anal-ysis of the complex I assembly process within this study, overall
our observations were in line with the current models of complex
I assembly as reviewed recently (
Mckenzie and Ryan, 2010
).
The identification of TMEM126B as a subunit of the MCIA
complex provides proof of principle that complexome profiling
allows the discovery of functionally important components of
macromolecular assemblies and assembly intermediates.
Com-plexome profiling can be easily adapted to study other
subcel-lular compartments than mitochondria or even the complexome
of whole cells from various sources. Moreover, the dynamics and
remodeling of macromolecular assemblies can now be studied
in detail by comparing the profiles of biological samples, e.g.,
in gene knockout and knockdown studies or to study disease
related changes in patients.
EXPERIMENTAL PROCEDURES Cell Culture
HEK293T (human embryonic kidney) cells were cultured in DMEM (GIBCO Laboratories, Grand Island, NY) supplemented with 10% fetal bovine serum, 1% glutamine, and 1% penicillin/streptomycin in an atmosphere of 5% CO2
at 37C. 143B osteosarcoma cells (ATCC number CRL-8303) and 143B cells transduced either with lentiviral shRNAmir vectorpGIPZtargetingTMEM126B (knockdown) orpGIPZnonsilencing control shRNAmir (mock) were grown in tissue-culture flasks or roller bottles in DMEM culture medium (Sigma), 2 mM L-glutamine, 1 mM sodium pyruvate, 0.1 mg/ml uridine, nonessential amino acids, and 10% fetal bovine serum in a humidified cell incubator at 37C under a 5% CO2atmosphere. For detachment, a Trypsin/EDTA solution
(0.05%/0.02%) was used.
Generation ofTMEM126BKnockdown Cell Lines
Viral particles of the human lentiviral pGIPZ shRNAmir TMEM126B set (RHS4531, Thermo Scientific) and nonsilencingpGIPZlentiviral shRNAmir control (RHS4346) were produced in HEK293T cells. Cell transfection was carried out with 5.4ml 10 mM polyethylenimine (PEI) permg DNA. HEK293T cells (23106
) were transfected with 2.5mg lentiviral shRNA construct together with 1.625mgp8.91(Zufferey et al., 1997) and 0.875mgpMD2.Gpackaging plasmids (Addgene, Cambridge, MA). Forty-eight and seventy-two hours after transfection, culture medium containing viral particles was supplemented with 8mg/ml polybrene, added to 143B target cells for infection, and centrifuged for 60 min, 340 g, 32C. 143B cells were transduced twice in 6-well plates at 1.53105cells per well. Successful knockdown ofTMEM126Bwas confirmed by quantitative real-time PCR. Transduced 143B cells were selected in culture medium supplemented with 2mg/ml puromycin.
Preparation of Mitochondria
Rat heart mitochondria were prepared as previously described (Dro¨se et al., 2006) from male Wistar rats (200–250 g) with all steps carried out at 4C. Mitochondria were resuspended in 300 mM sucrose, 10 mM Na+
/HEPES (pH 7.4), 0.2 mM EDTA, and 1 mg/ml fatty-acid free bovine serum albumin. Intact mitochondria from cell culture were isolated by differential centrifuga-tion. Cells were grown to confluence in tissue-culture roller bottles and harvested by trypsination and low-speed centrifugation (500 g, 10 min). All subsequent steps were carried out at 4C. The cell pellet (0.5–1.53108
cells) was washed twice, first with 0.9% NaCl solution and then with mitochondria isolation medium (250 mM sucrose, 1 mM EDTA, and 20 mM Tris/HCl [pH 7.4]). Subsequently, cells were disrupted with a 10 ml syringe and a 20G cannula (ten strokes in total), followed by a low-speed centrifugation step (1,000 g, 10 min) to remove nuclei, cell debris, and intact cells. The mitochon-dria containing supernatant was transferred to a new tube and centrifuged with high speed (6,000 g, 10 min). The resulting mitochondria were resuspended in
mitochondria isolation medium. Protein quantification was performed via the Lowry method.
High-Resolution Respirometry
Mitochondrial respiration was analyzed at 25C with an Oxygraph-2k system (OROBOROS Instruments, Innsbruck, Austria) and DatLab software. Rat heart mitochondria (0.3 mg protein) were added to 2 ml 250 mM sucrose, 10 mM Tris/HCl (pH 7.4), 10 mM potassium phosphate, and 10mM EGTA. The respi-ratory control factor was determined as the ratio between active state after the addition of 2 mM ADP and controlled state with 4.8 mM malate/5.6 mM glutamate.
Mitochondria isolated from cultured cells (0.29–0.66 mg protein) were added to 2 ml solution containing 200 mM sucrose, 10 mM Tris/HCl (pH 7.4), 10 mM potassium phosphate, 10 mM magnesium sulfate, 2 mM EDTA, and NADH-linked substrates 4.8 mM malate/5.6 mM glutamate, feeding in electrons at complex I. The active state was induced by 2 mM ADP. Subsequently, com-plex II-dependent respiration was determined in the presence of the comcom-plex I inhibitor rotenone (10mM) and 5 mM succinate. All respiratory rates were cor-rected for nonmitochondrial respiration by complete inhibition of the respira-tory chain by 2 mM potassium cyanide.
Respiration of Trypsin-harvested cells suspended in 2 ml cultivation medium (1.53106
/ml) was monitored at 37C, and the respiratory control ratio was determined as the ratio between maximally uncoupled respiration (after subse-quent additions of 1mM FCCP) and oligomycin-inhibited (2mg/ml) respiration. Blue-Native Gel Electrophoresis
For complexome profiling, rat heart mitochondria were solubilized with digi-tonin at a detergent/protein ratio of 9 g/g in 50 mM NaCl, 2 mM 6-aminohex-anoic acid, 1 mM EDTA, and 50 mM imidazole/HCl (pH 7.0). After centrifuga-tion (22,000 g, 20 min 4C), the solubilized mitochondrial proteins were applied to 0.530.15 cm gel wells (0.2 mg protein per lane) of a 4%–16% gradient BNE gel (Wittig et al., 2006a) and of a 3%–9% gradient LP-BNE gel (Strecker et al., 2010). Electrophoresis was started at 100 V and continued at 500 V after about 10 min. Duplicate 1D gel lanes were used for complexome profiling and second dimension 16% SDS Tricine gel electrophoresis (Scha¨gger, 2006) fol-lowed by silver staining (Rais et al., 2004). Blue-native gel electrophoresis for complexome profiling of isolated mitochondria from transduced 143B cells was performed alike, but a digitonin to protein ratio of 6 g/g and a 3.5%– 18% gradient BNE gel was used.
BNE for subsequent western blotting was performed with enriched mito-chondrial membranes from cell homogenates or isolated mitochondria from cell culture. Cells were harvested in PBS and homogenized in 83 mM sucrose, 3.3 mM Tris/HCl (pH 7.5), 1.6 mM 6-aminohexanoic acid, and 0.3 mM EDTA. Nuclei and cell debris were removed by low-speed centrifugation for 5 min, at 500 g. Mitochondrial membranes were sedimented by centrifugation (10,000 g, 10 min, 4C) and solubilized with digitonin (1 mg digitonin/10 mg cell wet weight) in 50 mM NaCl, 2 mM 6-aminohexanoic acid, 1 mM EDTA, and 50 mM imidazole/HCl (pH 7.0). After centrifugation (22,000 g, 20 min, 4C), the protein content was measured, and 0.02 mg solubilized mitochon-drial proteins were applied to 0.530.15 cm gel wells of a 4%–16% gradient BNE gel (Wittig et al., 2006a). Electrophoresis was started at 100 V and continued at 500 V after 10 min. BNE with intact mitochondria from cell culture was performed alike, but a digitonin to protein ratio of 6 g/g was used. 1D BNE gels were blotted or single lanes were loaded to SDS Tricine gels (16% acryl-amide) for second-dimension electrophoresis followed by silver-staining or 2D western blotting (Scha¨gger, 2006).
Western Blotting
1D BNE or 2D SDS gels were semidry electroblotted onto PVDF membranes as described (Wittig et al., 2006a;Scha¨gger, 2006), and BNE-blots were de-stained in methanol. The blots were blocked in PBS containing 0.1% Tween and 1% bovine serum albumin. For immunodetection of OXPHOS complexes or MCIA components, the membranes were decorated with the following primary antibodies: anti-NDUFB8 (monoclonal, Invitrogen), anti-NDUFS3 (monoclonal, Mitosciences MS112), anti-OXPHOS (monoclonal, Mitoscien-ces, MS603), anti-Acad9 (polyclonal, Sigma HPA037716), and anti-CIA30 (polyclonal, Sigma SAB1101401). Subsequently, the blots were incubated with the matching peroxidase-linked secondary antibodies (Sigma, against
IgG from rabbits or mice). ECL Chemiluminescence was detected by a ChemiDoc XRS device (Biorad) and quantified with the Quantity One software package (Bio-Rad).
In-Gel Tryptic Digests
The in-gel digests were done in perforated well plates, essentially following the protocol byCollins et al. (2008). In brief, the 1D BNE or LP-BNE gel lanes were incubated in fixing solution (50% methanol, 10% acetic acid, 10 mM ammo-nium acetate [pH 3]) for 60 min. After two washes for 30 min with ultrapure water, the gel lanes were cut in 60 even 2 mm slices starting at the Coomassie dye front. Each gel slice was diced in smaller pieces before they were trans-ferred into a well of a perforated 96-well plate (Proxeon, Denmark) containing 50ml AHC buffer (50 mM ammonium hydrogen carbonate). Then, the slices were washed twice with 100 ml 50% methanol/AHC buffer for 30 min at room temperature under gentle agitation to remove excess Coomassie dye. After removal of the buffer by centrifugation, the gel pieces were incubated for 60 min with 50ml 5 mM DTT in AHC, followed by the addition of 25ml 30 mM iodoacetamide and incubation for another 45 min. For dehydration, 85ml acetonitrile was added, and after 10 min, the solution was removed by centrifugation. The dehydrated gel pieces were swollen in 10ml 5 ng/ml trypsin in 50 mM NH4HCO3, 10% acetonitrile, 1 mM CaCl2for 30 min at 4C. Finally,
the gel pieces were completely covered with AHC buffer, and the proteins were digested overnight at 37C. The peptide-containing supernatants were collected by centrifugation into a fresh 96-well plate. The remaining peptides were extracted by 45 min incubation with elution solution (30% acetonitrile, 3% formic acid). After drying of the combined supernatants in a SpeedVac concentrator, the peptides were solubilized in 5% acetonitrile/0.5% formic acid for subsequent analysis by LC-MS.
Mass Spectrometry
Tryptic peptides were subjected to LC-MS/MS analysis in an Orbitrap XL mass spectrometer (Thermo) with an Agilent1200 nano-HPLC (high-performance liquid chromatography) at the front end. Peptides were separated on 3mm C18 reversed phase silica beads filled into a 75mm ID PicoTip emitter column (New Objectives) in 90 min HPLC runs using 60 min gradients of 5% to 50% acetonitrile with 0.1% formic acid, followed by a column wash with 90% aceto-nitrile and re-equilibration with 5% acetoaceto-nitrile for 15 min each. Eluted peptides were analyzed in positive mode by a mass spectrometry method programmed to fragment the top ten most abundant precursor ions using dynamic exclusion for 3 min with a resolution of 30,000 at 400Th. Single-charged precursor ions were rejected, and doubly and higher charged ions were fragmented in the linear ion trap by CID at 35% collision energy. For accurate mass measure-ments, the lock mass option was enabled at m/z 445.120025 (Olsen et al., 2005). It is important to note that all 60 samples from one gel lane were subse-quently analyzed under identical conditions without interruptions and with special attention to spray stability.
Protein Identification
The extraction of peak lists from RAW files and evaluation of spectra were per-formed with the Thermo Proteome Discoverer 1.2 environment with Mascot server 2.2 as the database search engine. The search parameters were set as follows: 8 ppm deviation on the precursor and 0.8 Da on fragment masses, fixed carbamidomethylation of cysteine, variable oxidation of methionine and trypsin as the protease (full tryptic with two missed cleavages allowed). Spectra were matched against theRattus norvegicusreviewed protein data-base (7,628 sequences) obtained from UniProt (UniProt Consortium, 2012). The database was manually inspected for the presence of all known OXPHOS proteins and supplemented with additional 54 missing subunits identified by sequence alignment of the known sequences from Mus musculus using BLAST (Altschul et al., 1990). For advanced analysis, spectra were also matched against the unreviewed UniProt and NCBI database, which enabled identification of TMEM126B. Spectra obtained from mitochondria of human 143B osteosarcoma cells were matched against the UniProtHomo sapiens re-viewed protein database. Spectra from the 60 gel slices of the complete gel lanes were batch-processed with Discoverer Daemon 1.2. The database search results were loaded as a multiconsensus report and filtered by the Mascot significance threshold filter set to 0.05. Keratins, hemoglobins and trypsin were removed from the list.
Label-Free LC/MS-Based Protein Quantification and Hierarchical Clustering
Peptide areas were extracted from the HPLC chromatograms with the precursor ions area detector node implemented into the Proteome Discoverer workflow with mass precision set to 3 ppm. For reconstruction of protein abundance profiles across the gel lane, the average areas of the three most abundant peptides per gel slice were exported from the Proteome Discoverer multiconsensus protein report to a MicrosoftExcel spreadsheet and used to construct protein abundance profiles. Peptides shared between similar proteins that were not unique were excluded with the Proteome Discoverer 1.2 proteins grouping option. The abundance distribution patterns of the iden-tified proteins were evaluated for similarities and hierarchically grouped by distance measures based on Pearson correlation coefficient (uncentered) and single linkage clustering using Cluster 3.0 software (Eisen et al., 1998; de Hoon et al., 2004). Clustered profiles were visualized with Microsoft Excel.
Statistical Analysis
Results shown as mean ± SD or SEM. Differences were considered significant with a p value<0.05 using an unpaired two-tailed Student’s t test.
SUPPLEMENTAL INFORMATION
Supplemental Information includes Supplemental Experimental Procedures, two figures, and three tables and can be found with this article online at http://dx.doi.org/10.1016/j.cmet.2012.08.009.
ACKNOWLEDGMENTS
We are indebted to Hermann Scha¨gger for many helpful suggestions and kindly providing antibodies. We thank Leo Nijtmans for helpful discussions. We are grateful for excellent technical assistance of Ilka Siebels, Gudrun Be-yer, and Maximillian Mattil. Funding by the Deutsche Forschungsgemeinschaft (SFB815 Projects A2, Z1) and the BMBF (0315584A: GerontoMitoSys and 01GM1113B: mitoNET) is gratefully acknowledged. This study was supported by the Excellence Initiative of the German Federal and State Governments (EXC 115).
Received: January 2, 2012 Revised: May 9, 2012 Accepted: August 17, 2012
Published online: September 13, 2012
REFERENCES
Altschul, S.F., Gish, W., Miller, W., Myers, E.W., and Lipman, D.J. (1990). Basic local alignment search tool. J. Mol. Biol.215, 403–410.
Andersen, J.S., Wilkinson, C.J., Mayor, T., Mortensen, P., Nigg, E.A., and Mann, M. (2003). Proteomic characterization of the human centrosome by protein correlation profiling. Nature426, 570–574.
Claros, M.G., and Vincens, P. (1996). Computational method to predict mitochondrially imported proteins and their targeting sequences. Eur. J. Biochem.241, 779–786.
Collins, M.O., Yu, J.S., and Choudhary, J.S. (2008). Analysis protein complexes by 1D-SDS-PAGE and tandem mass spectrometry. Protocol Exchange. Published online June 18, 2008. http://dx.doi.org/10.1038/nprot. 2008.123.
Cox, A.G., Winterbourn, C.C., and Hampton, M.B. (2010). Mitochondrial perox-iredoxin involvement in antioxidant defence and redox signalling. Biochem. J. 425, 313–325.
de Hoon, M.J.L., Imoto, S., Nolan, J., and Miyano, S. (2004). Open source clus-tering software. Bioinformatics20, 1453–1454.
Dro¨se, S., Brandt, U., and Hanley, P.J. (2006). K+-independent actions of diazoxide question the role of inner membrane KATP channels in mitochon-drial cytoprotective signaling. J. Biol. Chem.281, 23733–23739.
Eisen, M.B., Spellman, P.T., Brown, P.O., and Botstein, D. (1998). Cluster anal-ysis and display of genome-wide expression patterns. Proc. Natl. Acad. Sci. USA95, 14863–14868.
Foster, L.J., de Hoog, C.L., Zhang, Y.L., Zhang, Y., Xie, X.H., Mootha, V.K., and Mann, M. (2006). A mammalian organelle map by protein correlation profiling. Cell125, 187–199.
Gonc¸alves, R.P., Buzhynskyy, N., Prima, V., Sturgis, J.N., and Scheuring, S. (2007). Supramolecular assembly of VDAC in native mitochondrial outer membranes. J. Mol. Biol.369, 413–418.
Gourlay, L.J., Bhella, D., Kelly, S.M., Price, N.C., and Lindsay, J.G. (2003). Structure-function analysis of recombinant substrate protein 22 kDa (SP-22). A mitochondrial 2-CYS peroxiredoxin organized as a decameric toroid. J. Biol. Chem.278, 32631–32637.
Huang, C.S., Sadre-Bazzaz, K., Shen, Y., Deng, B.B., Zhou, Z.H., and Tong, L.A. (2010). Crystal structure of the alpha(6)beta(6) holoenzyme of propionyl-coenzyme A carboxylase. Nature466, 1001–1005.
Kozjak-Pavlovic, V., Ross, K., Benlasfer, N., Kimmig, S., Karlas, A., and Rudel, T. (2007). Conserved roles of Sam50 and metaxins in VDAC biogenesis. EMBO Rep.8, 576–582.
Ladig, R., Sommer, M.S., Hahn, A., Leisegang, M.S., Papasotiriou, D.G., Ibrahim, M., Elkehal, R., Karas, M., Zickermann, V., Gutensohn, M., et al. (2011). A high-definition native polyacrylamide gel electrophoresis system for the analysis of membrane complexes. Plant J.67, 181–194.
Lazarou, M., McKenzie, M., Ohtake, A., Thorburn, D.R., and Ryan, M.T. (2007). Analysis of the assembly profiles for mitochondrial- and nuclear-DNA-en-coded subunits into complex I. Mol. Cell. Biol.27, 4228–4237.
Mckenzie, M., and Ryan, M.T. (2010). Assembly factors of human mitochon-drial complex I and their defects in disease. IUBMB Life62, 497–502. Moreno-Lastres, D., Fontanesi, F., Garcı´a-Consuegra, I., Martı´n, M.A., Arenas, J., Barrientos, A., and Ugalde, C. (2012). Mitochondrial complex I plays an essential role in human respirasome assembly. Cell Metab.15, 324–335. Nijtmans, L.G.J., de Jong, L., Artal Sanz, M., Coates, P.J., Berden, J.A., Back, J.W., Muijsers, A.O., van der Spek, H., and Grivell, L.A. (2000). Prohibitins act as a membrane-bound chaperone for the stabilization of mitochondrial proteins. EMBO J.19, 2444–2451.
Nouws, J., Nijtmans, L., Houten, S.M., van den Brand, M., Huynen, M., Venselaar, H., Hoefs, S., Gloerich, J., Kronick, J., Hutchin, T., et al. (2010). Acyl-CoA dehydrogenase 9 is required for the biogenesis of oxidative phos-phorylation complex I. Cell Metab.12, 283–294.
Olinares, P.D.B., Ponnala, L., and van Wijk, K.J. (2010). Megadalton complexes in the chloroplast stroma of Arabidopsis thaliana characterized by size exclusion chromatography, mass spectrometry, and hierarchical clus-tering. Mol. Cell. Proteomics9, 1594–1615.
Olsen, J.V., de Godoy, L.M.F., Li, G.Q., Macek, B., Mortensen, P., Pesch, R., Makarov, A., Lange, O., Horning, S., and Mann, M. (2005). Parts per million mass accuracy on an Orbitrap mass spectrometer via lock mass injection into a C-trap. Mol. Cell. Proteomics4, 2010–2021.
Rais, I., Karas, M., and Scha¨gger, H. (2004). Two-dimensional electrophoresis for the isolation of integral membrane proteins and mass spectrometric iden-tification. Proteomics4, 2567–2571.
Ramachandran, N., and Colman, R.F. (1980). Chemical characterization of distinct subunits of pig heart DPN-specific isocitrate dehydrogenase. J. Biol. Chem.255, 8859–8864.
Remmerie, N., De Vijlder, T., Valkenborg, D., Laukens, K., Smets, K., Vreeken, J., Mertens, I., Carpentier, S.C., Panis, B., De Jaeger, G., et al. (2011). Unraveling tobacco BY-2 protein complexes with BN PAGE/LC-MS/MS and clustering methods. J. Proteomics74, 1201–1217.
Roberts, D.L., Frerman, F.E., and Kim, J.J.P. (1996). Three-dimensional struc-ture of human electron transfer flavoprotein to 2.1-A resolution. Proc. Natl. Acad. Sci. USA93, 14355–14360.
Scha¨gger, H. (2006). Tricine-SDS-PAGE. Nat. Protoc.1, 16–22.
Scha¨gger, H., de Coo, R., Bauer, M.F., Hofmann, S., Godinot, C., and Brandt, U. (2004). Significance of respirasomes for the assembly/stability of human respiratory chain complex I. J. Biol. Chem.279, 36349–36353.
Smith, A.C., and Robinson, A.J. (2009). MitoMiner, an integrated database for the storage and analysis of mitochondrial proteomics data. Mol. Cell. Proteomics8, 1324–1337.
Sokolova, L., Wittig, I., Barth, H.D., Scha¨gger, H., Brutschy, B., and Brandt, U. (2010). Laser-induced liquid bead ion desorption-MS of protein com-plexes from blue-native gels, a sensitive top-down proteomic approach. Proteomics10, 1401–1407.
Strecker, V., Wumaier, Z., Wittig, I., and Scha¨gger, H. (2010). Large pore gels to separate mega protein complexes larger than 10 MDa by blue native elec-trophoresis: isolation of putative respiratory strings or patches. Proteomics10, 3379–3387.
Tatsuta, T., Model, K., and Langer, T. (2005). Formation of membrane-bound ring complexes by prohibitins in mitochondria. Mol. Biol. Cell16, 248–259. Uchida, Y., Izai, K., Orii, T., and Hashimoto, T. (1992). Novel fatty acid beta-oxidation enzymes in rat liver mitochondria. II. Purification and properties of enoyl-coenzyme A (CoA) hydratase/3-hydroxyacyl-CoA dehydrogenase/3-ke-toacyl-CoA thiolase trifunctional protein. J. Biol. Chem.267, 1034–1041. UniProt Consortium. (2012). Reorganizing the protein space at the Universal Protein Resource (UniProt). Nucleic Acids Res.40(Database issue), D71–D75. Vogel, R.O., Dieteren, C.E.J., van den Heuvel, L.P.W.J., Willems, P.H.G.M., Smeitink, J.A.M., Koopman, W.J.H., and Nijtmans, L.G.J. (2007a). Identification of mitochondrial complex I assembly intermediates by tracing tagged NDUFS3 demonstrates the entry point of mitochondrial subunits. J. Biol. Chem.282, 7582–7590.
Vogel, R.O., Janssen, R.J., van den Brand, M.A.M., Dieteren, C.E.J., Verkaart, S., Koopman, W.J., Willems, P.H., Pluk, W., van den Heuvel, L.P., Smeitink, J.A., and Nijtmans, L.G. (2007b). Cytosolic signaling protein Ecsit also local-izes to mitochondria where it interacts with chaperone NDUFAF1 and func-tions in complex I assembly. Genes Dev.21, 615–624.
Wessels, H.J.C.T., Vogel, R.O., van den Heuvel, L., Smeitink, J.A., Rodenburg, R.J., Nijtmans, L.G., and Farhoud, M.H. (2009). LC-MS/MS as an alternative for SDS-PAGE in blue native analysis of protein complexes. Proteomics9, 4221– 4228.
Wittig, I., and Scha¨gger, H. (2009). Native electrophoretic techniques to iden-tify protein-protein interactions. Proteomics9, 5214–5223.
Wittig, I., Braun, H.P., and Scha¨gger, H. (2006a). Blue native PAGE. Nat. Protoc.1, 418–428.
Wittig, I., Carrozzo, R., Santorelli, F.M., and Scha¨gger, H. (2006b). Supercomplexes and subcomplexes of mitochondrial oxidative phosphoryla-tion. Biochim. Biophys. Acta1757, 1066–1072.
Wittig, I., Karas, M., and Scha¨gger, H. (2007). High resolution clear native elec-trophoresis for in-gel functional assays and fluorescence studies of membrane protein complexes. Mol. Cell. Proteomics6, 1215–1225.
Wittig, I., Beckhaus, T., Wumaier, Z., Karas, M., and Scha¨gger, H. (2010). Mass estimation of native proteins by blue native electrophoresis: principles and practical hints. Mol. Cell. Proteomics9, 2149–2161.
Xie, J., Marusich, M.F., Souda, P., Whitelegge, J., and Capaldi, R.A. (2007). The mitochondrial inner membrane protein mitofilin exists as a complex with SAM50, metaxins 1 and 2, coiled-coil-helix coiled-coil-helix domain-contain-ing protein 3 and 6 and DnaJC11. FEBS Lett.581, 3545–3549.
Zalk, R., Israelson, A., Garty, E.S., Azoulay-Zohar, H., and Shoshan-Barmatz, V. (2005). Oligomeric states of the voltage-dependent anion channel and cyto-chrome c release from mitochondria. Biochem. J.386, 73–83.
Zufferey, R., Nagy, D., Mandel, R.J., Naldini, L., and Trono, D. (1997). Multiply attenuated lentiviral vector achieves efficient gene delivery in vivo. Nat. Biotechnol.15, 871–875.