Impacts of climate change on ecosystem functioning: linking
aboveground and belowground responses
Sarah Christine Pierce
Department of Life Sciences Imperial College London
Silwood Park Campus Ascot
December 2015
A thesis submitted in fulfilment of the requirements for the degree of Doctor of Philosophy and the Diploma of Imperial College London
Abstract
Climate change is expected to include changes to rainfall patterns. For southern
England, this is likely to include decreased summer and increased winter rainfall patterns by the end of the 21st century. The aim of this research was to investigate the effects of altered precipitation patterns on ecosystem properties both above- and below-ground using a grassland experimental system in southeast England. The DIRECT experiments were established in 2008 and continued through 2013. This included three experiments assessing the effects of rainfall change on ecosystem functioning. The first crossed a summer rainfall reduction/winter rainfall increase scenario with plant functional trait diversity. The second considered the effects of two more extreme rainfall change scenarios, one an extended drought and one a shorter, more severe drought with occasional downpours. The third crossed rainfall change with increased nitrogen deposition in line with current levels experienced in parts of Europe.
By concurrently measuring a broad range of above- and below-ground properties during the 2012 and 2013 growing seasons, I assessed the effects of changes in annual
precipitation patterns. Drought during the growing season was linked to increased grass dominance and reduced ecosystem respiration, photosynthesis, and net ecosystem exchange, despite increases in winter precipitation. Effects on ecosystem functioning were most severe under extreme drought scenarios. Plant functional trait identity and diversity influenced response to drought, with increased diversity linked to higher plant cover in drought conditions. Increased nitrogen appeared to magnify the effects of drought on plant cover, while moderating the effects on CO2 flux. These results suggests that the levels of precipitation change predicted for England will negatively affect
biodiversity and carbon cycling in grasslands, but factors such as trait diversity and nutrient inputs must be taken into account to understand the range of possible outcomes for ecosystem functioning.
Acknowledgements
I would like to thank my supervisors, Dr Sally Power and Dr Thomas Bell for their support and encouragement even when progress was slow and difficult. Without their constant encouragement I could not have achieved so much.
For setting up the DIRECT projects and providing the groundwork for everything I have done here, I must thank Dr Sally Power (again), Dr Pete Manning, Dr Ellen Fry, and Dr Mark Lee, as well as everyone else who contributed to the early years of work at DIRECT. For supporting the molecular work completed at the Hawkesbury Institute for the
Environment, University of Western Sydney, I would like to thank my hosts, Professor Brajesh Singh and Dr Catriona Macdonald, the technicians, and the wonderful students and post docs who made me feel so welcome during my three month visit.
For helping me to maintain the experimental treatments at DIRECT and lab equipment, I am indebted to technicians Dennis Wildman and Paul Beasley. I am also deeply indebted to a large number of students, casual workers, lab mates, and friends who helped to keep these labour-intensive experiments ticking over. These include several fantastic undergraduate placement students who also assisted with data collection: Mike Massam, Emma Johnstone, Lauren Ratcliffe, Menelik Lee, and Heather Graham.
For both moral and practical support, I would like to thank my lab group, especially Shorok, Claire, Damian, Chris and Lara, and my friends in other groups, especially Adriana, Isabel, Jen, Kate, Helen H, Helen P, and Hannah.
As I have been and will continue to be throughout my life, I am eternally grateful to my family, and especially my parents, for loving me and supporting my ambitions even when this has meant moving thousands of miles away.
This PhD was supported by the Grantham Institute for Climate Change and the Natural Environment Research Council. Additional support for the molecular work was provided by the Society for General Microbiology and the Hawkesbury Institute for the
Declaration of Originality
I confirm that the written work within this thesis is my own. It has undergone revision following comments from my supervisors. I conducted the majority of the data
collection and lab work myself. Some data collection was undertaken by undergraduate placement students under my supervision, in particular summer soil moisture
measurements and soil sample preparation for laboratory analyses. I completed all statistical analyses following advice from Dr Markus Eichhorn. All the work presented here relies on field experiments developed by Dr Sally Power, Dr Pete Manning, Dr Ellen Fry, and Dr Mark Lee.
Copyright Declaration
The copyright of this thesis rests with the author and is made available under a Creative Commons Attribution Non-Commercial No Derivatives licence. Researchers are free to copy, distribute or transmit the thesis on the condition that they attribute it, that they do not use it for commercial purposes and that they do not alter, transform or build upon it. For any reuse or redistribution, researchers must make clear to others the licence terms of this work
Table of contents
Abstract ... 2
Acknowledgements ... 3
Declaration of Originality ... 5
Copyright Declaration ... 5
Tables and figures ... 9
Chapter 1: Introduction ... 11
1.1 Global change and ecosystem functioning ... 11
1.2 Biodiversity and ecosystem functioning ... 13
1.3 Plant diversity: species richness and functional traits ... 15
1.4 Aboveground-belowground feedbacks ... 17
1.5 The DIRECT Experiment ... 22
1.6 Aims and outline ... 25
Chapter 2: Rainfall change and plant trait diversity interact to influence ecosystem functioning over time ... 28
2.1 Abstract ... 28
2.1 Introduction ... 29
2.3 Methods ... 32
2.3.1 Study site and treatments ... 32
2.3.2 Field and laboratory measurements ... 33
2.3.3 Statistical analysis ... 36 2.4 Results ... 38 2.4.1 Soil moisture ... 40 2.4.2 Plant community ... 42 2.4.3 Root Biomass ... 43 2.4.4 CO2 flux ... 45
2.4.6 Litter decomposition... 48
2.4.7 Microbial community ... 50
2.5 Discussion ... 52
2.5.1 Drought effects on ecosystem functioning ... 52
2.5.2 Effects of plant functional traits... 53
2.5.3 Functional group determination of responses to drought ... 55
2.5.4 Conclusion ... 56
Chapter 3: Not resistant but resilient: Effects of extreme rainfall change on aboveground-belowground linkages and ecosystem functioning ... 57
3.1 Abstract ... 57
3.2 Introduction ... 58
3.3 Methods ... 59
3.3.1 Study site and treatments ... 59
3.3.2 Field and laboratory measurements ... 60
3.3.3 Statistical analysis ... 64 3.4 Results ... 64 3.4.1 Soil moisture ... 64 3.4.2 Vegetation composition ... 66 3.4.3 Litter decomposition... 67 3.5 Discussion ... 72
Chapter 4: Nitrogen addition moderates negative effects of drought in a grassland system ... 77
4.1 Abstract ... 77
4.2 Introduction ... 77
4.3 Methods ... 80
4.3.1 Study site and treatments ... 80
4.3.2 Field and laboratory measurements ... 81
4.3.3 Statistical analysis ... 84
4.4 Results ... 84
4.4.1 Rainfall and soil moisture ... 84
4.4.3 CO2 flux ... 87
4.4.4 Soil nutrients ... 88
4.4.5 Litter decomposition... 88
4.4.6 Microbial community analysis ... 89
4.5 Discussion ... 91
Chapter 5: Discussion ... 95
5.1 Overview... 95
5.2 Key findings ... 95
5.2.1 Effects of rainfall change treatments ... 95
5.2.2 Traits, diversity, and nutrients ... 98
5.3 Limitations and future research directions ... 100
5.4 Conclusions ... 102
References ... 104
Appendix 1: DIRECT site map ... 118
Appendix 2: Chapter 2 additional figures ... 119
Appendix 3: Additional project contributions during the PhD period ... 125
A 3.1 Plant diversity and microbial biomass ... 125
A 3.2 Diversity, extremes and ecosystem response (DExtER) ... 125
A 3.3 Non-destructive estimation of carbon and nitrogen budgets in an experimental grassland ... 127
Tables and figures
Table 1.1 DIRECT experimental treatments ... ...25
Table 2.1 Effects of plant functional group diversity on ecosystem responses.... ... 38
Table 2.2 Summary of responses of ecosystem measurements to climate and plant functional group treatments... 39
Table A2.1: Summary of ecosystem responses to climate and plant functional group treatments, 2012 and 2013...119
Table A2.2 Effects of plant functional group diversity on ecosystem responses...120
Figure 2.1 Soil moisture by climate treatment. ... 41
Figure 2.2 Vegetation cover and plant species richness ± SEM, September 2013. ... 43
Figure 2.3 Root biomass by depth± SEM, September 2013. ... 44
Figure 2.4 CO2 flux ± SEM by functional group presence, September 2013. ... 46
Figure 2.5 Soil carbon and nitrogen content, and C/N ratio by plant functional trait group presence, September 2013.. ... 49
Figure 2.6 Bacteria and fungi qPCR starting copy number abundance, and fungi/bacteria ratio of copy numbers, September 2013. .. ...51
Figure 3.1: Soil moisture by treatment, June-October 2013... 65
Figure 3.2: (a) Vegetation cover, September 2012, and (b) vegetation aboveground biomass, September 2013... 66
Figure 3.3: Litter decomposition in the field measured as percentage mass loss... 67
Figure 3.4: Ecosystem respiration by climate treatment in (a) September 2012 and (b) September 2013... 68
Figure 3.5: Net Ecosystem CO2 Exchange ± SEM in (a) September 2012 and (b) September 2013... 69
Figure 3.6: Extractable ammonium concentrations ± SEM by climate treatment throughout the summer 2012... 70
Figure 3.7: Extractable phosphate concentrations ± SEM by climate treatment throughout summer 2012... 71
Figure 3.8: NMDS of (a) bacteria and (b) fungi community... 72
Figure 4.1: Mean soil moisture by drought x nitrogen treatment for summer 2012... 85
Figure 4.3: (a) Ecosystem respiration, (b) Photosynthesis and (c) Net ecosystem CO2 Exchange ± SEM for September 2012... 87 Figure 4.4 NMDS of fungi community by climate and nitrogen treatments from June, July
and September 2012... 89 Figure 4.5 Fungi/bacteria ratio ±SEM, September 2012... 90 Figure 4.6 Soil microbial respiration measured as change in absorbance (±SEM) using MicroResp plates in September 2012... 90
Figure A2.1 Total vegetation and species richness by functional group and climate treatment, September 2012 and 2013... 116 Figure A2.2 Root biomass by depth and functional group and climate treatment, September 2012... 117 Figure A2.3 Net ecosystem exchange and ecosystem respiration by functional group and
climate treatment, September 2012 and 2013... 118 Figure A2.4 Soil extractable nutrients by functional group and climate treatment, September 2012 and 2013... 119 Figure A3.1 Extractable ammonium immediately before and after flood treatment,
summer 2012... 121 Figure A3.2 Soil (a) bacteria community and (b) fungal community by site, flood
treatment and date (post-flood, or one year later)... 121 Figure A3.3 Average vegetation carbon and nitrogen content by functional group based
on 290 plant samples... 122 Figure A3.4 Measured biomass vs biomass predicted from cover using a GLS approach for grasses and forbs/legumes... 123
Chapter 1: Introduction
1.1 Global change and ecosystem functioning
Human-induced global change is happening at an unprecedented rate. Climate change, eutrophication, and loss of biodiversity, among many other factors, are causing large-scale changes to the biosphere and we have very limited comprehension of the potential long-term consequences. As we increase our understanding of these changes
individually on particular species or habitats, the picture is further complicated by environmental feedbacks and interaction effects which are difficult to anticipate. Even focussing on just one or two change factors at a time is no simple task. Taking climate change as perhaps the most pressing challenge our world is facing, our confidence that it is occurring and what the general trends will be is high, but our ability to predict the precise repercussions for any specific area or ecosystem is hampered by the complexity of ecological interactions.
Based on recent evidence, the Intergovernmental Panel on Climate Change (IPCC) has stated that human influence on the climate is clear and changes have had widespread impacts on natural systems. There is high confidence that regional changes in
temperature have already affected physical and biological systems, and that this will continue throughout the century (IPCC 2007; IPCC 2014). Though there remains some uncertainty about the extent of change that will occur, mean global temperatures are expected to rise between 0.3-4.8oC by 2100, incidents of heatwave, flooding and
drought are expected to increase, and sea levels are expected to rise between 8 mm and 88 mm (IPCC 2014). However, the effects of climate change will not be spread evenly around the world, with the amount of warming and changes in precipitation patterns varying across regions (IPCC 2007). Models suggest that the UK will experience an
increase in mean annual temperature of 2-40C by 2080 as well as a 10-30% increase in rainfall during the winter months and a 20-30% decrease in rainfall during summer months, with an associated risk of increased winter flooding and summer droughts (Murphy et al. 2010).
In the 21st century, climate change is likely to increase the risk of extinction for 20-30% of plant and animal species (IPCC 2007). Major changes in ecosystem structure and function, species’ ecological interactions and shifts in species’ geographical ranges are expected to have negative impacts on biodiversity and ecosystem goods and services (IPCC 2007). In the past century, climate change has already affected biodiversity by changing species’ distributions, population sizes, phenology and increasing outbreaks of pests and diseases (Millennium Ecosystem Assessment 2005; Walther et al. 2002). Climate change can manifest through changes in mean temperature and precipitation or extremes across a variety of temporal and spatial scales, and it affects terrestrial
ecosystem processes through both direct and indirect effects on plants, soil organisms, and chemical processes (Shaver et al., 2000).
Climate change is not acting in isolation. Other global change drivers, such as eutrophication, are occurring at the same time and are known to affect ecosystem functioning. For example, anthropogenic nitrogen enrichment occurs around the world through direct application (e.g., agricultural fertilisation) and through atmospheric deposition of pollutants (e.g., ammonium, ammonia, and nitrous oxide). In temperate ecosystems, nitrogen deposition has been shown to negatively affect plant species diversity (see review by Bobbink et al., 2010). Studies of the effects of nitrogen deposition on ecosystems have primarily focussed on North American and European temperate regions, but there is increasing concern about effects on other ecosystems as well (Bobbink et al., 2010). Nitrogen deposition can affect ecosystems by changing
unfavourable for some species. It can also cause acidification which can influence plants directly or indirectly by changing micronutrient availability or releasing toxic metals such as aluminium (Bobbink et al., 2010).
Both nitrogen addition and increased plant biodiversity have been shown to decrease plant carbon/nitrogen ratio (Novotny et al. 2007). This could have important implications for herbivory and decomposition, thereby affecting food web dynamics and nutrient availability. However, no effect of N additions on C:N was found under elevated atmospheric CO2 conditions (Novotny et al. 2007), making it more difficult to predict what may happen under different global change scenarios. Studies have found that nitrogen addition also affects soil communities, including decreasing soil microbial biomass N and C, changing community structure, and inhibiting respiration (Lovell, Jarvis, and Bardgett 1995; Ramirez, Craine, and Fierer 2010; Ramirez, Craine, and Fierer 2012).
1.2 Biodiversity and ecosystem functioning
Biodiversity, defined as the variability among living things, including diversity within species and between species and ecosystems, contributes to ecosystem services and human wellbeing (Mace, Norris, and Fitter 2012). In terrestrial ecosystems, biodiversity affects processes including biomass production, nutrient and water cycling, soil formation and retention, and carbon sequestration (Millennium Ecosystem Assessment 2005). Biodiversity, in terms of species richness, evenness, composition and interactions, increases the resilience and resistance of ecosystems to environmental change (Chapin et al. 2000), and stabilises ecosystem productivity through extreme events (Isbell et al. 2015). While biodiversity loss may only have small effects in the short term, it could have a long-term impact on an ecosystem’s capacity to adjust to changing
environmental conditions (Millennium Ecosystem Assessment 2005). Recent work shows that the more ecosystem functions are examined, the more diversity is needed to
maintain them all (Zavaleta et al. 2010).
Increased biodiversity can influence ecosystem functioning by allowing interactions which result in production higher than would be expected with monocultures (overyielding), increasing the chance that key, very productive species will be present (selection), increasing the range of functional traits represented, thereby increasing resource use efficiency (niche-complementarity), or increasing stability by including a range of species with similar functions that respond differently to environmental change
(redundancy/insurance) (Chapin et al. 2000; Hooper et al. 2005; Hector et al. 2010; Dı́az and Cabido 2001). Zak et al (2003) found that soil microbial communities and the ecosystem processes they mediate are altered by the increased plant production
associated with greater diversity. Diaz and Cabido (2001) found that functional diversity strongly determines ecosystem functioning through selection effects,
niche-complementarity and redundancy, and suggested that species diversity within functional types may also play a role in the long-term stability of ecosystems under environmental change. It has also been pointed out that hypotheses like complementary and selection effects are not necessarily mutually exclusive, with both playing a part in enhancing ecosystem functioning (Hooper et al. 2005). Likewise, Hector et al. (2010) found that both population asynchrony and overyielding helped to stabilise productivity in an experimental grassland.
Many studies considering the effects of biodiversity on ecosystem functioning have focused only one or two trophic groups (Hooper et al. 2005). However there is
recognition that organisms from a wider range of trophic groups must be considered in order to understand the effects of biodiversity on ecosystem functioning (Roscher,
communities are increasingly common, while attempts to assess the importance of
invertebrate and plant diversity on ecosystem functioning are also increasing (Milcu et al. 2010; Nico Eisenhauer and Schädler 2011a).
1.3 Plant diversity: species richness and functional traits
As well as considering different trophic groups, it is important to look at diversity within trophic groups. For plants, this often means species richness or functional diversity. Plant functional groups have been defined as plant species that share similar function at the organismal level, similar responses to environmental factors and/or similar roles in the ecosystem (Cornelissen et al. 2003). Functional groups can be based on whole organism traits, such as growth form, leaf traits, such as specific leaf area, or
belowground traits, such as rooting depth, among many others. The traits used to group plants vary between studies in order to ensure good categorisation of the community and relevance for the study questions (Cornelissen et al. 2003).
Several studies have considered whether species richness or functional trait diversity in plants is more important for ecosystem functioning. Most found that plant functional characteristics are more important than species richness for the ecosystem processes such as decomposition, soil organic matter dynamics, nutrient uptake by microbes, and nutrient retention (Hooper et al. 2005). However, one recent grassland study suggests that species diversity may be more important than functional group or productivity for driving soil biota (Eisenhauer et al., 2011). Uncertainty about the relative importance of functional diversity vs. species richness for ecosystem functioning may spring from the myriad ways researchers define plant functional groups.
Numerous studies have tried to divide plant species into functional groups based on their traits in order to study the effects of functional diversity (Craine et al. 2002; Roscher, Schumacher, and Baade 2004). This has included grouping such as grasses, forbs and legumes (De Deyn et al. 2009), shrubs, grasses and bryophytes (Ward et al. 2009), or C3 grasses , C4 grasses, N-fixing dicotyledons and non-N-fixing dicotyledons (Wardle, Bonner, and Barker 2000). Common categories such as grasses, legumes and forbs are useful in some cases; however these groupings do not necessarily correlate with many plant traits important for ecosystem functioning (e.g., resource use efficiency, growth patterns, or productivity). For instance, in examining nitrogen cycling, Craine et al (2002) found that there was more variation within forb and C3 grass groups then between them, and suggested that legumes should be divided into cool and warm
season groups to better represent the differences in their physiology. More sophisticated methods consider plant traits in terms of their effects on or responses to particular ecosystem processes of interest (e.g., leaf N and P concentrations affect biogeochemical cycling, and respond to changes in resource availability and climate) (Cornelissen et al. 2003). Roscher et al. (2004) were interested in the effects of high species richness as well as functional diversity on a range of ecosystem properties. For their functional groups, they chose 17 variables, mostly focussing on aboveground morphology, but giving double weighting to legumes (Roscher, Schumacher, and Baade 2004). In contrast Fry et al. (2014) used eight variables, but focused on those most relevant to nutrient and water cycling, and Grigulis et al. (2013) used only five. These methods produced functional groups that are very different to each other and from the common grass, forb, and legume functional groups, but which were more appropriate for the research questions.
There is growing evidence that species richness, independent of functional richness, is itself important for ecosystem functioning (Nico Eisenhauer et al. 2011; Zavaleta et al.
indicates that it may be more accurate to consider plant functional traits in terms of a continuum, with each species contributing uniquely to ecosystem processes. However, functional groups provide a useful way to explore diversity effects in experimental studies, helping to identify which traits or groups of traits drive different processes in a way that would not be possible using random species assemblages.
1.4 Aboveground-belowground feedbacks
Terrestrial ecosystems are composed of aboveground and belowground systems linked by plants, and the feedback between the systems regulates community structure and ecosystem functioning, and will help determine ecosystem responses to climate change (Bardgett & Wardle, 2010). The web of interactions between plant and soil communities is complex. Plants input carbon and nutrients to the soil through litter deposits and root exudates, and create microhabitats for soil biota. These inputs vary depending on plant diversity, productivity and seasonality, and influence soil community composition, abundance and fungi/bacteria ratios (Bardgett et al., 1999). The composition of these inputs affects microbial and invertebrate community structure, including symbionts, herbivores, predators and detritivores (Bardgett & Wardle, 2010). The presence of plants has been shown to help buffer effects of climate variability on processes such as soil respiration, which could influence whether soils are a carbon source or sink
(Aanderud, Schoolmaster, and Lennon 2011).
Soil communities also provide feedback to plants, regulating their growth and community composition through nutrient and carbon cycling, soil formation, symbiosis, herbivory and disease (Bardgett & Wardle, 2010). A study by Lau and Lennon (2011) found that
Brassica rapa plants grown in soils with simplified soil communities were smaller, had reduced chlorophyll content, produced fewer flowers and were less fecund than plants
grown in more complex soils. Knowledge about how soil organism diversity affects processes including decomposition and nutrient cycling is still limited. While there is an increasing number of studies, the results appear very context-dependent. For example, studies of the composition of mycorrhizal fungi show that community composition and diversity influence plant community composition and productivity, but in inconsistent ways - positive, negative or neutral depending on soil fertility and plant species
considered (Hooper et al. 2005). Despite the complexity, some studies seem to indicate more general trends. Chapin et al. (2000) indicated that mycorrhizal fungi species richness is linked to increased plant productivity and phosphorus uptake, and that increased microbial richness is linked to increased plant litter decomposition.
Environmental factors, particularly water availability, also regulate soil communities. Many soil organisms are limited by precipitation and changes in water availability cause changes in population sizes of soil biota, with the effects of change intensifying over time (Blankinship, Niklaus, and Hungate 2011). Studies in several habitats suggest fungal communities are more resistant to drought and seasonal rainfall variation than bacterial communities (Hawkes et al. 2011, Californian meadow; Yuste et al. 2011, Mediterranean scrubland and forest). In an ecosystem with season drought, fungal communities were quick to change and to recover when conditions improved (Hawkes et al. 2011). Perhaps surprisingly, other work has shown that increasing precipitation also favoured fungi over bacteria (Blankinship, Niklaus, and Hungate 2011), which may suggest that fungi are more resilient to change than soil bacteria. That said, results are not always consistent and there has been little study of the effects of combined climate and biodiversity treatments on soil microbial community structure.
Climate change is likely to affect aboveground-belowground feedbacks through changes in temperature and water availability, and these changes may be affected by other
of carbon from soil, but an increase in woody plant tissue which mostly compensated for the losses from the soil in a deciduous forest study. Both climate and plant diversity have been shown to strongly influence soil microbial communities, which in turn regulate carbon and nutrient cycling. Active fungi and bacteria constitute 90-95% of
heterotrophic metabolism in soils (Bardgett et al., 1999), so understanding the
mechanisms that drive soil biota responses to environmental changes could help predict the effects of change on ecosystem functioning (Blankinship, Niklaus, and Hungate 2011).
Several studies in northern California have considered the effects of climate change on plant and soil communities. Hawkes et al. (2011) found that fungal communities in an experimental grassland prone to seasonal drought had more abundant, diverse and consistent communities under drought conditions. They also saw that changes in the communities due to drought/rainfall were rapid, reversible and repeatable. It is unclear if responses would be the same in an environment less prone to frequent water stress. In the same system, bacterial and archaeal communities were shown to be resilient to long term rainfall additions despite significant changes to the plant communities (Cruz-Martínez et al. 2009). Other studies in the region have suggested these grassland soil communities may be well adapted to a range of climatic extremes. Waldrop and
Firestone (2006) transplanted soil cores between grasslands and nearby oak forest and found that the microbial community in the soil from the forest changed very rapidly when moved to the grassland, while the grassland soil stayed the same under forest conditions. They attributed this to the fact that the grassland soils experience a much wider range of temperatures and soil wetting/drying seasonally while the forest soil conditions are more stable throughout the year. This suggests that microbial
communities will change quickly when environmental conditions differ from those to which the community is accustomed (Waldrop and Firestone 2006a) and is supported by additional work emphasising the importance of soil microclimate for soil microbial
communities (Waldrop and Firestone 2006b). If a soil community experiences climatic variation outside of what is ‘normal’ for its habitat, then community level change is likely, along with associated changes in ecosystem functioning.
Changes in soil communities may affect plant diversity and ecosystem functioning. For example, decomposition rates are regulated by soil faunal communities, which both influence and are influenced by plant communities (Hooper et al. 2005). High soil fertility tends to promote fast bacteria-driven decomposition pathways while low fertility promotes slower fungal pathways (Bardgett et al. 1999). These different pathways have implications for nutrient cycling and availability, but as discussed above, bacteria/fungi ratio is affected by climate as well as fertility. Microbial biomass is determined by plant productivity but the effects can vary greatly depending on the plant species present. For example, a short lab study by Bardgett et al. (1999) found that Holcus lanatus caused an increase in the proportion of soil fungi over bacteria. They also found that Lolium perene
had a negative effect on soil microbial diversity measured by phospholipid-derived fatty acid (PLFA) assay. Many plant effects on soils are inconsistent over time, perhaps because of changes in rhizodeposition seasonally and as plants age and develop. It is not clear whether these results would be replicated in a longer term field scale
experiment, but it highlights the importance of understanding links between the aboveground and belowground systems.
Climatic changes can affect both aboveground and belowground processes. A study by Knapp et al. (2002) showed that increased rainfall variability resulted in decreased aboveground net primary productivity (ANPP) and decreased soil CO2 flux. While
decreasing soil CO2 flux may reduce ecosystem carbon loss in the short term, it may also indicate reduced belowground productivity. Coupled with decreased aboveground NPP, it appears that increased rainfall variability will decrease C inputs to the soil overall in this
belowground responses to increased rainfall variability were greatest in the driest years, suggesting greater effects with drought (Knapp et al. 2002).
Yuste et al. (2011) found that fungi were much more resistant than bacterial communities to seasonal variation in rainfall. Fungi were better able to adapt to
seasonal changes and coped better under a 10 year drought experiment, indicating that increased drought under climate change could result in increasingly fungi-dominated soil communities (Yuste et al. 2011).
If water stress affects the soil invertebrate community, it could have negative impacts on food web composition, decomposition rates and feedbacks for plants. For example, earthworms have been shown to act synergistically with fungi to increase nutrient supply and benefit plants (Eisenhauer et al. 2010), but are very vulnerable to dry conditions. If invertebrates are lost due to climate change, it could reduce system stability. Studies of the DIRECT plots by De Palma (2011) showed that the density of soil invertebrates, especially mites, was strongly influenced by the high variability rainfall treatment. De Palma (2011) also found that plant diversity played an important role in determining diversity of collembolan communities and that it may help mediate effects of climate change.
Higher invertebrate decomposer diversity may also increase the stability of ecosystem functions, though evidence is somewhat inconsistent (Eisenhauer & Schädler, 2011; Milcu et al., 2010). If invertebrates are lost due to climate change, it could reduce system stability. Studies show soil food web composition, rather than diversity of
organisms within trophic levels, drives decomposition and plant production (Hooper et al. 2005). Soil invertebrates have been shown to affect plant succession and evenness in a microcosm experiment, with effects increasing over time (De Deyn et al. 2003). The presence of soil invertebrates had profound effects on above ground plant biomass for
different species, allowing subordinate late successional species to increase. As this experiment was conducted using sterilised soils, it does not consider the effects of interactions between soil microbial communities and plants or soil invertebrates.
1.5 The DIRECT Experiment
The DIRECT (DIversity, Rainfall and Elemental Cycling in a Terrestrial ecosystem) project was developed in 2008 on a grassland site at Silwood Park, Berkshire, UK. It includes three experiments looking at the effects of climate change in conjunction with other global change drivers at levels that are likely to be experienced in this region by the end of the 21st century. These are:
1. Diversity experiment: summer drought and increased winter rainfall in combination with a gradient of plant trait diversity (Chapter 2);
2. Extremes experiment: extended spring and summer drought with increased winter rainfall and highly variable drought/downpour summer rainfall regimes (Chapter 3); and
3. Nitrogen experiment: summer drought and increased winter rainfall in combination with increased rates of nitrogen deposition (Chapter 4) (Table 1.1, see Appendix 1.1 for diagram of DIRECT).
Ambient precipitation was used as a control in all of the DIRECT experiments. Plots were covered with a transparent sloping roof at 0.9-1.4 m above ground level during the spring/summer treatment periods. Ambient control plots roofs had holes to allow precipitation to flow through to the plot while maintaining a similar microclimate to the climate change plots. Climate change plot roofs intercepted all precipitation and channelled it into storage vessels for redistribution. For winter precipitation additions, extra water was collected in trays and added to the relevant plots as soon possible after rainfall events.
The diversity experiment at DIRECT (Chapter 2) used plant functional trait groupings to assess the effects of altering functional diversity on ecosystem responses to climate stress at the field scale (Ellen L. Fry et al. 2013; Ellen L. Fry, Power, and Manning 2014). Grasslands are relevant study systems as they are extensive biomes, have a large carbon storage capacity, are highly productive, species rich and very responsive to interannual variability in precipitation (Knapp et al. 2002). At DIRECT, native plant species were assessed according to eight different traits relevant to C, N and water cycling: specific leaf area (SLA), leaf nitrogen content (LNC), nitrogen fixation ability, leaf stomatal conductance rates (Gs), above- and belowground biomass (AGB and BGB), leaf photosynthetic rate, and perennation. This resulted in three functional groups: (1) perennial grasses, forbs and legumes, (2) caespitose grasses and tall forbs, (3) annual forbs, grasses and legumes (Fry et al., 2013).
Functional groups were exposed to an ambient rainfall treatment and a drought treatment individually and in all possible trait group combinations. The “drought” treatment consisted of a summer rainfall reduction and a winter addition. Summer (June, July and August) reductions were approximately 30%. This was done by
collecting all ambient rainfall and reapplying 50% when rainfall was less than 20 mm in 24 h, and 100% when rainfall was more than 20 mm in 24 h. Winter (December, January, February) additions were 15%, collected beside the plots. These climate change treatments were based on climate model projections for southeast England (Murphy et al. 2010).
In the extremes experiment (Chapter 3), the extended drought treatment was similar to the climate treatment above, but the summer reduction was extended into the spring to cover the period from March through August. The highly variable treatment had the same winter addition, but the summer treatment (June, July, and August) was conducted
by storing all ambient precipitation less than 20 mm in 24 h, then adding all stored precipitation when ambient precipitation levels were higher than 20 mm in 24 h. Any stored water remaining at the end of August was discarded.
A nitrogen deposition study (Chapter 4) involved applying 2.742 g ammonium nitrate in 5 l rainwater approximately twice per month to four ambient climate plots and four drought plots containing the full plant species mix. This is equivalent to 40 kg N ha-1 yr-1. Nitrogen levels were based on the upper level of nitrogen deposition in European non-forest ecosystems (Dentener et al. 2006). In addition, four ambient and four drought plots were used as controls, with a 5 l of rainwater applied at the same time as nitrogen on the addition plots (Lee, Manning, Walker, & Power, 2014). Drought
Table 1.1 DIRECT experimental treatments. Each of the three experiments consisted of an ambient control and one or more rainfall change treatments. The diversity
experiment also contained plant trait group diversity treatments and the nitrogen deposition experiment crossed rainfall change treatments with nitrogen addition. Numbers indicate the number of replicates for each treatment within each experiment. There were 56 plots in the diversity experiment, 12 in the extreme climate experiment and 16 in the nitrogen experiment, for a total of 84 plots across all DIRECT experiments.
Plant Diversity Treatment
Functional groups present: 1 2 3 1&2 1&3 2&3 1,2&3 Replicates
Cl im a te T rea tm ent Diversity experiment Ambient 4 4 4 4 4 4 4 28 Summer drought, winter flood 4 4 4 4 4 4 4 28 Extreme climate experiment Ambient - - - 4 4 Spring + summer drought - - - 4 4 Summer high variability - - - 4 4 Nitrogen deposition experiment N + ambient - - - 4 4 N + drought - - - 4 4 Control + ambient - - - 4 4 Control + drought - - - 4 4 Total replicates 8 8 8 8 8 8 36 84
1.6 Aims and outline
The aim of this project was to investigate the effects of changing precipitation patterns, as anticipated for the end of the 21st century, on ecosystem properties both above- and below-ground using a grassland experimental system. I considered the effects of precipitation change using three experiments in the DIRECT study system assessing the importance of plant functional trait identity and diversity, extreme rainfall change
scenarios, and nitrogen deposition respectively. The aim was to improve understanding of the sensitivity and stability of above- and below-ground ecosystem properties to
altered rainfall patterns over time while taking other important variables into account. The outcomes from each of these three experiments are described in the following chapters.
Chapter 2 covers the climate change – plant trait diversity experiment, which looked at changing rainfall patterns in conjunction with plant functional trait identity and diversity treatments. I assessed changes in the plant and soil communities as well as soil nutrient content and carbon flux. Plant functional trait identity and diversity were both important for explaining ecosystem properties under drought conditions.
Chapter 3 describes the extreme change experiment, which incorporated three different rainfall treatments on plots which began with the full complement of grassland species and were allowed to develop without manipulation of the plant community. Both the extended drought and variable drought/downpour treatments were linked to changes in ecosystem properties compared to ambient. The variable treatment in particular resulted in a switch from net CO2 uptake to net CO2 release in the system at the end of the growing season, which could have important implications for carbon storage in the long term.
Chapter 4 describes the outcomes of the climate change – nitrogen deposition
experiment. This involved crossing rainfall change in the form of summer drought/winter addition with increased nitrogen deposition. Both drought and nitrogen deposition were linked to changes in ecosystem properties, but nitrogen appeared to moderate the negative effects on CO2 flux which were seen under drought conditions.
Chapter 5 summarises the findings from the previous chapters and places them in the context of the the current understanding in the literature, drawing conclusions from across the experiments and making suggestions for future work.
Chapter 2: Rainfall change and plant trait diversity interact to influence ecosystem functioning over time
2.1 Abstract
Climate change is expected to cause changes to rainfall patterns. For southern England, this is expected to result in decreased summer rainfall and increased winter rainfall by the end of the 21st century. Plant species may respond to these changes with shifts in abundance and diversity, resulting in potential consequences for ecosystem functioning which may not be realised immediately. Presented here are the results from years 4 and 5 of the DIRECT climate change and plant trait diversity experiment. This experiment links altered rainfall patterns (-30% summer rainfall, +15% winter rainfall) with three plant functional trait groupings in a fully factorial design. The results indicate clear significant effects of changing rainfall regimes on soil moisture, soil nitrogen and root biomass. Plant functional trait group (FG) treatments were found to play an important role in determining plant productivity and ecosystem carbon flux. Importantly,
interactions between climate treatment and FG treatments influenced soil carbon and nitrogen, root biomass and fungal abundance, and FG diversity was linked to vegetation cover and extractable nitrogen levels. These results suggest an increase in the scope and magnitude of ecosystem responses to treatments compared to the first years of the experiment (Fry et al., 2013), as well as introducing belowground measures to provide a more complete picture of the effects on the ecosystem. This work highlights the
importance of long term monitoring in ecological research, and further elucidates the significance of functional trait identity and diversity in understanding ecosystem responses to environmental change.
2.1 Introduction
Climate change is expected to affect ecosystem community structure and function in a variety of ways, but predicting the implications for specific systems is hampered by the complexity of interactions in natural systems and the time scales involved (Weltzen et al. 2003). Even focusing on a single aspect of climate change, such as precipitation, results in multifaceted changes in ecosystem properties which are difficult to anticipate.
Precipitation change itself can imply very different things – reductions or increases in rainfall and changes in the intensity, length or periodicity or water stress experienced – resulting in variable effects. Furthermore, the effects of precipitation change are likely to be strongly influenced by the structure and diversity of the plant community that is present.
A number of studies have considered the effects of altered precipitation regimes on plant productivity and community structure. For example, the review by Jentsch et al. (2007) noted the importance of extreme events, such as severe drought, in causing species shifts which are maintained long after the original event, but also highlighted the need for better understanding of the effects of extreme weather events on biodiversity and ecosystem functioning. Chimner et al. (2010) focused on seasonality of precipitation and found that winter snowfall had important implications for plant productivity and ecosystem function in a Wyoming grassland, particularly in years with dry summer conditions. This was because the snow allowed for slow percolation rather than fast runoff and resulted in higher soil moisture that was maintained into the summer months. In terms of periodicity, Fay et al. (2003) found that redistribution of rain into fewer, more intense events resulted in species-specific decreases in aboveground NPP and increases in root:shoot ratio in a Kansas prairie, leading to changes in competition and the
suggestion that periodicity of rainfall may be as important for ecosystems as total amount.
Plant functional traits are known to influence ecosystem properties and processes such as nitrogen and carbon storage, decomposition and microbial community structure (de Vries et al. 2012; Orwin et al. 2010; Garnier et al. 2004; Sandra Lavorel et al. 2011). Plant traits can explain ecosystem effects such as biogeochemical cycling and
susceptibility to disturbance as well as individual plant responses (S Lavorel and Garnier 2002). While many plant functional traits can be seen as falling along a continuum (Wright et al. 2004), separating species into a manageable number of groups with shared traits allows for assessment of the importance of those traits in field studies (Ellen L. Fry, Power, and Manning 2014).
For southern England, models have predicted changes in precipitation in the form of decreased summer rainfall and increased winter precipitation (Murphy et al. 2010). Using the DIRECT diversity-climate change experiment, established in June 2008, we examined the effects of altered precipitation regimes in conjunction with plant functional trait identity and diversity treatments on grassland structure and functioning. Fry et al. (2013)’s results from the first three years of this project show that soil moisture levels were affected by the climate treatments, but with a lag of 2-3 months. Summer drought treatments slowed C and N cycling, and were associated with decreased net ecosystem CO2 exchange, ecosystem respiration, and living plant cover. In addition, drought treatment effects varied depending on which plant functional trait groups were present. For example, perennial grasses had higher process rates and higher nutrient stocks when soil moisture was high, but were more greatly affected by climate change treatments than caepitose grasses or annuals.
While this provides an interesting insight into the early effects of changing rainfall patterns in communities of contrasting functional trait identity and under different levels
direction of responses - will continue over a longer treatment period. Short duration studies have shown no or variable effects of plant diversity on ecosystem processes (Butenschoen, Scheu, and Eisenhauer 2011; R. D. Bardgett et al. 1999), while longer-term studies have shown that it can take up to four years for soil communities to
become fully established and stabilise (N Eisenhauer et al. 2010). Other studies suggest the effects of climate or biodiversity treatments may not become apparent for several years, or indeed may switch after a number of years (Suttle, Thomsen, and Power 2007). Long term studies are necessary in order to assess ecosystem resilience to change and to detect potential cumulative treatment effects (Silvertown et al. 2010). This uncertainty around long term effects emphasises the necessity for long term study of changes in precipitation patterns in order to elucidate the repercussions of such changes for plant productivity and ecosystem functioning.
With this in mind, this chapter presents the results of two further years of
experimentation at the DIRECT study site, and extends the breadth of responses measured to examine longer term responses, both above- and below-ground in this experiment. Variables monitored included plant and soil microbial community structure, abundance and activity, soil nitrogen and phosphorus levels, and carbon flux and
storage. These parameters were measured concurrently near the end of the growing season for two years in order to better explain observed changes in ecosystem function.
Four hypotheses were developed, following on previous results reported by Fry et al. (2013). Expected outcome were:
(1)Reduced plant cover in summer drought treatments as drought inhibits plant growth. These changes are mirrored by changes in other ecosystem properties, such as reductions in CO2 flux in summer drought treatments.
(2)Severity of drought effects on productivity and ecosystem properties (e.g., CO2 flux and soil nutrient levels) depends on which plant functional trait groups are
present, with FG3 (containing mostly small annuals) being most susceptible to drought.
(3)Effects of drought on productivity and ecosystem properties are less pronounced in treatments with higher plant trait diversity.
(4)Effect of the caespitose grass group (FG2) on ecosystem properties increases as the group becomes more established. This group was not well established during the first years of the experiment (Fry et al., 2013), so effects on ecosystem processes were not apparent.
2.3 Methods
2.3.1 Study site and treatments
The study was conducted on the DIRECT field site which includes 56 experimental plots with plant functional diversity and climate manipulation treatments (Fry et al., 2013 and described in Chapter 1). In brief, plant species were divided into 3 functional groups: FG1: perennial grasses and forbs (23 species), FG2: caespitose grasses (6 species), and FG3: annuals (28 species). Diversity treatments were maintained by weeding annually in the spring. The two climate treatments were based on precipitation: (1) year-round ambient precipitation and (2) -30% summer rainfall/+15% winter rainfall (hereafter referred to as ‘Drought’ to reflect the decreased summer rainfall). All measurements to investigate changes in plant and soil community composition and process rates were taken in September 2012 and September 2013 to help elucidate aboveground-belowground linkages late in the growing season following the end of the summer
drought part of the climate manipulation. Timing was decided due to the known time lag in drought effects on soil moisture (Fry et al. 2013). Methods are outlined below and are consistent with previous work on the DIRECT site by Fry et al. (2013).
2.3.2 Field and laboratory measurements
Soil moisture was measured in the field using a theta probe attached to a soil moisture meter. Four readings per plot were taken at each sampling period, one from each
quadrant, at least 30 cm from the edge of the plot. The mean of these reading was used for analysis.
Vegetation surveys were conducted in September using a 1 m2 quadrat placed in the centre of the plots, and percentage living plant cover was estimated for each species present. Total cover of >100% reflects layering of plants in very productive years.
CO2 fluxes were measured in each plot twice in September 2012 and 2013, using a Ciras-1 Infra-Red Gas Analyser (PP Systems International Inc., Amesbury, MA, USA) with a Perspex chamber cuvette (299 cm2 area, 8958 cm3 volume). Each plot contained a previously installed collar inserted 5 cm into the soil and the cuvette was placed over this to create a seal. Net ecosystem CO2 exchange (NEE) measurements were taken over two minute periods in full sunlight between 10am and 5pm. For ecosystem respiration (Reco), the cuvette was covered by an opaque sheet, allowed to equilibrate for one minute and then measured in the same way as NEE. Soil moisture, photosynthetically active radiation and soil temperature were measured at the same time and used as covariates in the statistical analysis.
Four 2.5 cm diameter, 10 cm deep soil samples were combined from each plot in September 2012 and 2013. Samples for each plot were homogenised and sieved to 2 mm. From this fresh soil sample, 20 g was frozen for later qPCR and TRFLP analysis, 30 g was used to determine soil extractable nutrient concentration as described below, and
20 g was weighed and oven dried at 80oC for 24 h, then re-weighed to determine water content. This dried soil was then used to determine soil carbon, nitrogen and
phosphorus levels, as described below.
Plant available nitrogen (NH4+ and NO3-/NO2-) was extracted using Allen’s (1989) method by adding a 1 molar KCl extractant to 20 g fresh soil and agitating for one hour. Plant available phosphorus (PO4+) was extracted using Truogs methods by mixing 10 g fresh soil with 150 ml Truogs solution (6 g (NH4)2SO4, 10 ml 0.05M H2SO4, 2 l dH2O) and agitating for 30 minutes. Mixtures were filtered using Whatman No 1 filter paper and analysed using a Skalar SAN++ continuous flow analyser (Skalar Analytical Systems B.V, Breda, Netherlands). If analysis could not be completed within 24 h of extraction,
extracts were frozen at -20oC until analysis could be completed.
Additional soil was dried at 80oC to constant weight and milled for 3 min at 250 rpm using a ball mill. Half of each sample was sent to the Forest Research laboratories at Alice Holt, Surrey, for total carbon and nitrogen determination by total combustion analysis. The remainder was used to determine total phosphorus and nitrogen
concentrations by acid digest. 250 mg dried, milled soil was used for Kjedhal digestion. One selenium tablet and 3 ml 98% sulphuric acid were added to the samples. Samples were digested for 30 minutes at 250oC, then at 400oC for two hours using a Gerhardt Kjeldatherm KB40S digestion block (C. Gerhardt GmbH & Co KG Analytical Systems, Konigswinter, Germany). The block was cooled before each sample was diluted with approximately 15 ml dH2O and mixed. Samples were filtered into 25 ml volumetric flasks, diluted to volume, and stored at 4oC until analysis. Digests were further diluted (150 µl digest in 285 µl dH2O) and analysed using a Skalar SAN++ continuous flow analyser.
To assess litter decomposition, samples of the dominant plant species, Holcus mollis, were collected and dried to constant weight at 70oC. Samples were cut into pieces approximately 2 cm in length and 2.00 g were placed into mesh litter bags with a 1 mm aperture. Two litter bags were placed in each plot in March 2012. One bag from each plot was collected in September 2012 and the second in March 2013. After collection, litter remaining in the bags was dried at 70oC to constant weight and weighed to
determine percentage mass loss. In September 2013, depth of litter was measured at 6 locations in each plot to assess differences in litter accumulation between treatments.
For microbial community analysis, frozen soils were defrosted and total nucleic acids were extracted using MoBio PowerMax DNA Extraction Kit (MoBio Laboratories, Carlsbad, CA, USA) following the manufacturer’s instructions, then stored at -70oC until analysis. DNA content of extracts was quantified using a NanoDrop 2000 UV-Vis
Spectrophotometer (Thermo Fisher Scientific Inc) and 2µl sample.
Multiplex terminal restriction fragment length polymorphism (M-TRFLP) was used to assess soil microbial community structure as described by Singh et al. (2006), using bacterial primers 63F and 1087R and fungal primers ITS 1F and ITS4. DNA was amplified using Polymerase Chain Reaction (PCR) as described in Fry et al. (2015) using reagents from Bioline (MA, USA), Bovine Serum Albumin from Promega (WI, USA), and primers from Invitro Technology (VIC, AU). A Bio-Rad DNA Dyad Cycler (Bio-Rad, NSW, AU) was used for all PCRs. ChargeSwitch PCR Clean-Up Kits (Invitorgen, VIC, AU), were used to purify PCR products. An ABI3500 Genetic Analyser (Invitro Technology) was used to resolve terminal restriction fragments (TRFs), which were then analysed using Genemapper (Invitro Technology) and binned using T-REX (trex.biohpc.org).
Quantitative PCR (qPCR) was conducted to assess relative bacterial and fungal
1F (Fierer et al. 2005) using a Rotor-Gene 6000 cycler (Corbett Life Science, NSW, AU). Full methods were identical to those presented in Fry et al. (2015).
For the September 2012 sampling period, soil microbial basal respiration of field fresh soil was determined by colorimetric assessment of CO2 production using MicroResp plates (James Hutton Institute, Aberdeen, Scotland). For 2013 samples, soil activity was determined by ATP quantification using BacTiter-Glo Microbial Cell Viability Assay
(Promega Corporation). This assay contains a luciferase enzyme that binds to ATP and emits a luminescent signal which was detected using a Synergy 2 plate reader with Gem5TM ready control and data analysis software (BioTek Instruments Inc).
2.3.3 Statistical analysis
Data were analysed with linear mixed effects models (LME) from the nlme package in R (Pinheiro et al. 2015). Block (four levels) was included as a random effect in all models. Where there was more than one measure per plot, plot was also included as a random effect nested within block. Fixed effects included climate treatment (two levels), plant functional trait groups (FGs) as presence/absence data, and all two-way interactions. For CO2 flux data, photosynthetically active radiation, soil temperature and soil moisture were also included as fixed effects in the maximal model. Models were simplified based on Akaike information criterion (AIC) upon deletion from the maximal model as
described in Crawley (2007). Fixed effects terms were removed if AIC decreased on deletion, or increased by less than 2 and terms had an estimated p>0.05. Minimal models were then refitted using REML, and t and p values obtained from the lme summary. Models were checked graphically for conformity with model assumptions. If assumptions were not met, data were transformed and models were re-run. To check for importance of functional group diversity, data were re-analysed the using the same
presence/absence. While soil moisture for individual dates was analysed using LME as described above, soil moisture was also analysed using a general linear mixed model (GAMM) to examine trends over time. Multivariate data were analysed using the anosim function of the vegan package in R with 999 permutations and block included as strata.
The total number of plots in the experiment was 56, so in a fully-factorial model of drought x plant functional trait group treatments, n=4. This leaves a high risk of Type II error, so all results indicating p<0.1 are presented below to help indicate developing trends.
2.4 Results
Results collected from September 2012 and 2013 are summarised below and in Tables 2.1 and 2.2. The results presented assess the importance of the plant functional trait groups (FGs) on a presence/absence basis to further minimize the risk of Type II error. While each FG combination occurs only 8 times in the experiment (4 times in ambient treatments and 4 times in drought treatments), each individual FG is actually present in 16 plots and absent in 12. By comparing effects in this way, it is possible to see the effects of the individual FGs in greater detail. Plots presenting the fully-factorial FG combinations are presented in Appendix 2, along with alternative results summary tables.
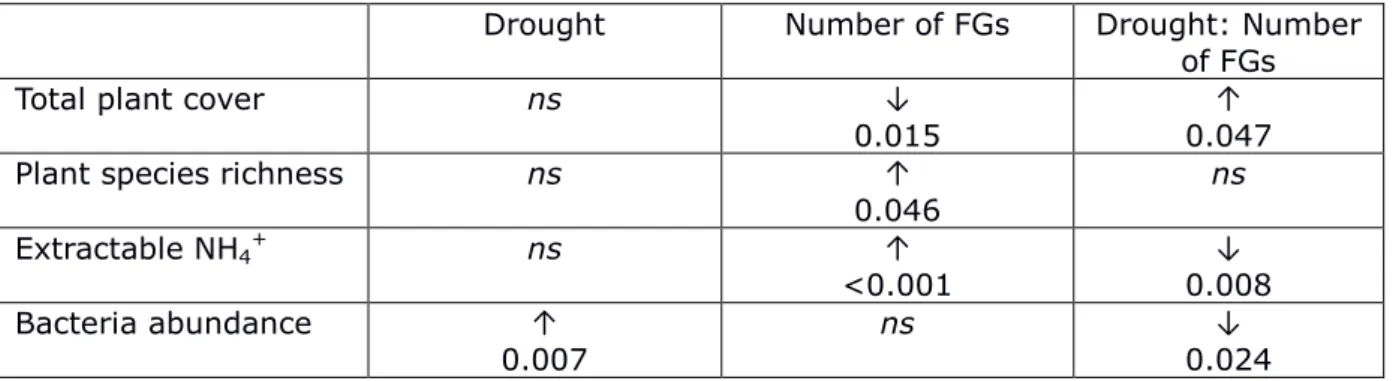
Table 2.1 Effects of plant functional group diversity on ecosystem responses. All p<0.1 are presented, along with arrows representing the direction of change.’ ns’ indicates effects were not significant (p>0.1).
Drought Number of FGs Drought: Number of FGs
Total plant cover ns ↓
0.015 0.047 ↑
Plant species richness ns ↑
0.046 ns Extractable NH4+ ns ↑ <0.001 0.008 ↓ Bacteria abundance ↑ 0.007 ns 0.024 ↓
Table 2.2 Summary of responses of ecosystem measurement to climate and plant functional group treatments, September 2013. All p<0.1 are presented, along with arrows representing the direction of change. Blank boxes indicate effects were not significant (p>0.1). drought FG1 FG2 FG3 drought: FG1 drought: FG2 drought: FG3 FG1: FG3
Total plant cover ↓
0.018 Grass cover ↓ 0.006 Legume cover ↓ 0.039 Plant species richness ↓ 0.047 Total root biomass
(0-20 cm) ↑ 0.073 0-5 cm ↑ 0.079 5-10 cm ↑ 0.018 NEE *↓ 0.010 ↓ 0.024 Reco ↑ 0.008 ↑ 0.050 ↑ 0.071 ↓ 0.011 Psyn *↓ 0.008 ↑ 0.010 Extractable NH4+ ↑ 0.017 ↑ 0.047 ↑ 0.017 ↓ 0.023 ↓ 0.087 Extractable NO3- ↑ 0.028 ↓ 0.004 Total soil N ↑ 0.022 ↓ 0.010 Total soil C ↑ 0.037 ↑ 0.040 ↓ 0.024 C/N ratio ↑ 0.023 Bacteria abundance ↑ 0.084 ↓ 0.015 Fungi abundance ↑ 0.084 ↓ 0.069 ↓ 0.010
* indicates direct effect of lower soil moisture rather than drought treatment. This was used as a covariate for CO2 flux measurements, along with PAR and soil temperature.
2.4.1 Soil moisture
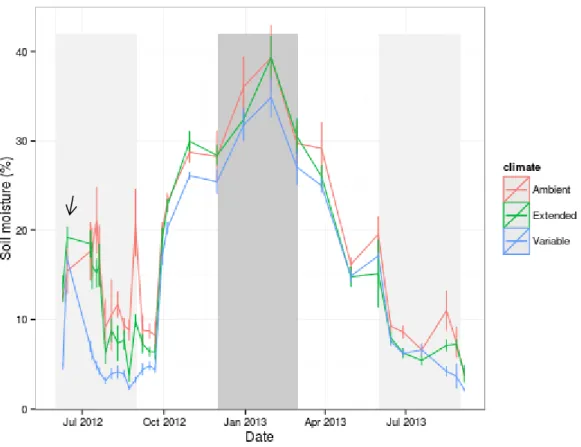
Over the period from July 2012 until September 2013, soil moisture was 1.63% lower in climate change compared to ambient plots (p<0.001). Soil moisture was also 0.6% lower in plots containing plant functional group 1 (FG1) (p=0.005). This was despite higher soil moisture in the ‘drought’ treatment over the winter due to the increased winter precipitation treatment (Figure 2.1).
The lower soil moisture during the summer in the drought treatment was maintained for approximately one month after the end of the drought treatment in 2012. This is despite an unusually wet summer in 2012. The mean Jun-Aug rainfall at Silwood for the 20 years before DIRECT began (1987-2007) was 150.7 mm ± 12.8 mm (Silwood
Weather Station, unpublished). In 2012, the rainfall during this period was 255.2 mm, and the drought plots received 145.5 mm rain.
Figure 2.1 Soil moisture by climate treatment. Light grey regions indicate timing of summer drought treatments. Dark grey region indicates timing of winter rainfall additions. Error bars represent 1 SEM. Soil moisture over time was highly significantly different between climate treatments (p<0.001), resulting in significantly lower moisture during summer drought treatments and for
approximately 1 month after the treatment end, with the exception of one date following a rain event in early August 2013. Moisture in February 2013 was higher in the 'drought' treatment, reflecting the increased winter rainfall in this treatment.
2.4.2 Plant community
In September 2012 the mean vegetation cover across treatments was 94% and there was no significant difference in total vegetation cover between any of the climate or plant diversity treatments. Grass cover was on average 10% lower when FG3 was present, but this was only significant at the 10% level (p=0.082). Legume cover was 5.7% lower when FG1 was present (p=0.040). In September 2013, mean vegetation cover across treatments was 86%. Despite lower overall cover compared to 2012, the treatment trends were maintained and the influence of functional groups was more apparent. Total vegetation cover was 5.8% lower in plots where FG3 was present (p=0.018), and grass cover was 12.8% lower in this treatment (p=0.006). Legume cover was 3.2% lower when FG1 was present (p=0.039). Plant functional group diversity (i.e., the number of functional groups present) was important for plant cover, with higher plant cover under drought conditions when more functional groups were present.
Plant functional group identity influenced total species number. In 2012, species number per plot ranged from 1 to 9 species. Species richness was higher by an average of 2.2 species when both FG1 and FG2 were present (p=0.004). Species richness was lower by an average of 1.7 species under drought treatment when FG1 was present (p=0.025). In 2013, species richness per plot ranged from 2 to 9 (Figure 2.2). The interaction between climate treatment and FG1 was maintained (p=0.047), resulting in an average of 1.6 fewer species in drought treatment when FG1 was present, but the effects of the other functional groups were not apparent.
Figure 2.2 Vegetation cover and plant species richness ± SEM, September 2013. FG3 was linked to lower vegetation cover, and FG1 was linked to lower species richness under drought conditions.
2.4.3 Root Biomass
Total root biomass (0-20 cm soil depth) was marginally influenced by climate and FG3, resulting in an increase of 6633 g m-2 when FG3 is present under drought conditions (p=0.073). Surface root biomass (0-5 cm soil depth) was lower when FG1 was present in ambient conditions, and higher in drought conditions (p=0.079), resulting in an average of 3400 g higher surface root biomass in drought conditions when FG1 was present. Shallow root biomass (5-10 cm) was 1220 g higher when FG1 was present (p=0.018). Deeper root biomass (10-20 cm) was not significantly affected by the treatments.
a b
a a
b
Figure 2.3 Root biomass by depth± SEM, September 2013. The top row shows the total root biomass from 0-20 cm depth, and the following two rows indicate biomass at different depths within this range. While FG3 was correlated with increases total root biomass (0-20 cm depth) under drought conditions, only FG1 was important at smaller depth subdivisions (0-5 cm and 5-10 cm).
a a
b b
a a
b b
2.4.4 CO2 flux
Net ecosystem CO2 exchange (NEE), respiration, and photosynthesis were affected by soil temperature and date of measurement, but not by the climate or diversity
treatments in 2012.
In 2013, the magnitude of NEE was increased (i.e., NEE became more negative) with presence of FG2 (p=0.026) and increasing soil moisture (p=0.012). Although there was a significant effect of soil moisture but not climate treatment on NEE, soil moisture was 2.3% lower in the drought treatment when NEE was measured (p=0.006). Drought was associated with a non-significant reduction in NEE magnitude of 0.5 µmol m-2 sec-1.
Ecosystem respiration was increased by each plant functional group presence
individually, but decreased when FG1 and FG3 were present together (FG1 p=0.008, FG2 p=0.0503, FG3 p=0.0714, FG1:FG3 p=0.0114). Photosynthesis showed a similar trend to NEE, with FG2 presence and increasing soil moisture resulting in higher
photosynthesis (p=0.0101 and p=0.0082, respectively). Drought was associated with a 2.7 µmol m-2 sec-1 reduction in photosynthesis, but this was not significant.
Figure 2.4 CO2 flux ± SEM by functional group presence, September 2013. A general trend for lower CO2 flux under drought conditions was not statistically significant, though soil moisture and FG presence were.
a b
a a a
a
b b b
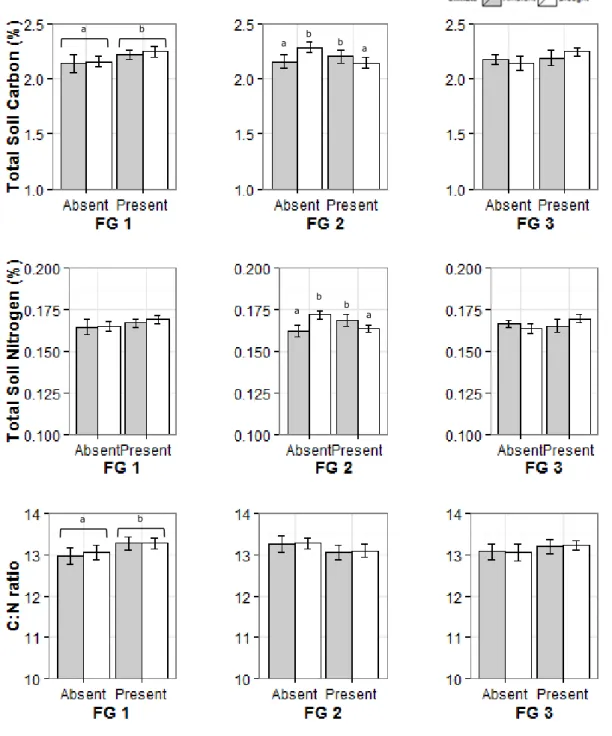
2.4.5 Soil nutrients and carbon
There was no difference in extractable nitrate/nitrite or ammonium between any of the treatments in September 2012, but September 2013 revealed a very different picture. Nitrate/nitrite levels were higher in the presence of FG3 (p=0.0276), except under drought conditions (p=0.0037). Ammonium levels were higher with each functional group individually (p<0.05), but lower when FG1 or FG3 was present in drought
treatments (p<0.023, and p=0.087, respectively). Increased plant functional trait group diversity (number of FGs present) was associated with lower ammonium levels under drought conditions. There was no difference in extractable or total phosphate between the treatments.
Total soil nitrogen concentration averaged 0.161% across treatments in 2012, and 0.166% in 2013. In 2012, drought had a small, marginally significant effect on total soil nitrogen, decreasing concentrations by 0.007% (p=0.060). In 2013, soil nitrogen concentration was 0.014% lower when FG2 was present in drought plots (p=0.010, Fig. 2.5).
Total soil carbon concentration across treatments averaged 2.09% in 2012 and 2.19% in 2013. In 2012, carbon was significantly influenced by FG1**, FG2*, FG3**, and
FG1:FG2*, and marginally by climate† and FG2:FG3† (**p<0.01, *p<0.05, †p<0.1). Presence of the FGs individually increased soil carbon by around 0.3%, but FG1 and FG2 in combination, or FG2 and FG3 in combination appeared to counteract this effect. In 2013, the influence of climate was more apparent and the influence of the FGs was somewhat diminished. Carbon concentrations were higher by 0.13% under drought conditions compared to ambient (p=0.0366), however when FG2 was present under drought conditions, carbon concentrations were lower (p=0.0237). Soil carbon
concentrations were also slightly higher when FG1 was present (+0.09%, p=0.0402), and the C:N ratio was 0.28 higher in plots containing FG1 (p=0.0232, Fig. 2.5).
2.4.6 Litter decomposition
Litter bags that were in the field for six months from March 2012 to September 2013 had significantly greater mass lass in drought plots compared to ambient climate (p=0.006). Mass loss was also significantly higher in plots that did not contain plant FG3 (p=0.017). However, these early treatment differences disappeared after 12 months of in-situ