UCLA
UCLA Previously Published Works
Title
A statistical simulator scDesign for rational scRNA-seq experimental design.
Permalink
https://escholarship.org/uc/item/1jp3s23n
Journal
Bioinformatics (Oxford, England), 35(14)
ISSN
1367-4803
Authors
Li, Wei Vivian
Li, Jingyi Jessica
Publication Date
2019-07-01
DOI
10.1093/bioinformatics/btz321
Peer reviewed
eScholarship.org
Powered by the California Digital Library
A statistical simulator scDesign for rational
scRNA-seq experimental design
Wei Vivian Li
1and
Jingyi Jessica Li
1,2,*
1
Department of Statistics, University of California, Los Angeles, CA 90095-1554, USA and
2Department of Human
Genetics, University of California, Los Angeles, CA 90095-7088, USA
*To whom correspondence should be addressed.Abstract
Motivation:
Single-cell RNA sequencing (scRNA-seq) has revolutionized biological sciences by
re-vealing genome-wide gene expression levels within individual cells. However, a critical challenge
faced by researchers is how to optimize the choices of sequencing platforms, sequencing depths
and cell numbers in designing scRNA-seq experiments, so as to balance the exploration of the
depth and breadth of transcriptome information.
Results:
Here we present a flexible and robust simulator, scDesign, the first statistical framework
for researchers to quantitatively assess practical scRNA-seq experimental design in the context of
differential gene expression analysis. In addition to experimental design, scDesign also assists
computational method development by generating high-quality synthetic scRNA-seq datasets
under customized experimental settings. In an evaluation based on 17 cell types and 6 different
protocols, scDesign outperformed four state-of-the-art scRNA-seq simulation methods and led to
rational experimental design. In addition, scDesign demonstrates reproducibility across biological
replicates and independent studies. We also discuss the performance of multiple differential
ex-pression and dimension reduction methods based on the protocol-dependent scRNA-seq data
gen-erated by scDesign. scDesign is expected to be an effective bioinformatic tool that assists rational
scRNA-seq experimental design and comparison of scRNA–seq computational methods based on
specific research goals.
Availability and implementation:
We have implemented our method in the R package scDesign,
which is freely available at https://github.com/Vivianstats/scDesign
.
Contact:
[email protected]
Supplementary information:
Supplementary data
are available at
Bioinformatics
online.
1 Introduction
The emergence and rapid development of single-cell RNA-sequencing (scRNA-seq) technologies offer unprecedented opportu-nities for investigating transcriptional mechanisms underlying biological and medical phenomena at the individual-cell resolution (Haqueet al., 2017;Wagneret al., 2016). While bulk RNA sequenc-ing has been widely used to capture the average transcriptome infor-mation in a batch of cells (Li and Li, 2018b), scRNA-seq allows the investigation of transcriptome variation across thousands to millions of cells. The scRNA-seq technologies have enabled researchers to in-vestigate fundamental biomedical questions,such as cellular com-position of various tissues and cell types, cell differentiation trajectories, and spatial and temporal dynamics of single cells. Important discoveries have been made from scRNA-seq data and
have advanced our understanding of diseases, such as neurological disorders (Skene et al., 2018) and tumorigenesis (Tirosh et al., 2016).
Since the first scRNA-seq study was published in 2009 (Tang et al., 2009), more than 20scRNA-seq experimental protocols have been developed. An effective experimental design requires careful consideration of the target research question as well as the experi-mental budget, and a typical design in practice consists of two steps. First, researchers need to select a proper protocol among the avail-able ones, and the primary consideration is the choice between a tag-based protocol that allows the integration of unique molecular identifiers (UMIs) (Kiviojaet al., 2012) and a full-length protocol that captures full-length transcripts and allows the addition of the External RNA Control Consortium (ERCC) spike-ins (Bacher and
VCThe Author(s) 2019. Published by Oxford University Press. i41
This is an Open Access article distributed under the terms of the Creative Commons Attribution Non-Commercial License (http://creativecommons.org/licenses/by-nc/4.0/), which permits non-commercial re-use, distribution, and reproduction in any medium, provided the original work is properly cited. For commercial re-use, please contact [email protected]
Bioinformatics, 35, 2019, i41–i50 doi: 10.1093/bioinformatics/btz321 ISMB/ECCB 2019
Kendziorski, 2016). The tag-based protocols [e.g. Drop-seq (Macoskoet al., 2015)]are usually used to obtain a broad but shal-low view of the transcriptomes across many cells, while the full-length protocols [e.g. Smart-seq2 (Picelli et al., 2013)] provide a deeper account of the gene expression in fewer cells. For example, a study about gene expression dynamics during stem cell differenti-ation requires accurate gene expression measurements, so it should opt for a full-length protocol. In contrast, in a study aiming to iden-tify a previously unknown cell phase during the differentiation, it is necessary to sequence a large number of cells using a tag-based protocol to capture the transient phases. In the second step, to opti-mize an experiment with a selected protocol and a fixed budget, researchers need to choose between exploring the depth or breadth of transcriptome information, which sums up to determining the ap-propriate number of cells to sequence.
However, in contrast to the classical experimental design (Quinn and Keough, 2002) guided by certain theoretical optimality (e.g. the maximum power of a statistical test), the scRNA-seq experimental design is impeded by various sources of data noises, making a rea-sonable theoretical analysis tremendously difficult (Kolodziejczyk et al., 2015;Pierson and Yau, 2015). Especially, scRNA-seq data are characterized by excess zeros resulted fromdropoutevents, in which a gene is expressed in a cell but its mRNA transcripts are un-detected. As a result, many commonly used statistical assumptions are not directly applicable to modeling scRNA-seq data. For ex-ample, Baran-Galeet al.proposed using a Negative Binomial model to estimate the number of cells to sequence, so that the resulting ex-periment is expected to capture at least a specified number of cells from the rarest cell type (Baran-Galeet al., 2017). However, the esti-mation accuracy depends on the idealized Negative Binomial model assumption, which real scRNA-seq data usually do not closely fol-low (Supplementary Fig. S1). There is also a theoretical investigation of the cell-depth trade-off based on the Poisson assumption of gene read counts and a specific list of genes of interests (Zhanget al., 2018). In contrast to model-based design approaches (Dumitrascu et al., 2018), multiple scRNA-seq studies used descriptive statistics to provide qualitative guidance instead of well-defined optimization criteria for experimental design (Gru¨n and van Oudenaarden, 2015;
Rizzettoet al., 2017). However, because the descriptive statistics were proposed from diverse perspectives, their resulting experimen-tal designs are difficult to unify to guide practices. For example, one study reported that the sensitivity of most protocols saturates at ap-proximately one million reads per cell (Ziegenhainet al., 2017), while another study found that the saturation occurs at around 4.5 million reads per cell (Svenssonet al., 2017). The reason for this dis-crepancy is that the two studies defined the sensitivity in different ways: the first study used the gene detection rate, while the second study used the minimum number of input RNA molecules required for confidently detecting a spike-in control (Jianget al., 2011).
In this article, we propose a statistical simulator scDesign for optimizing scRNA-seq experimental design from the perspective of detecting differentially expressed (DE) genes between two biological conditions (determined before an experiment) or two cell states (inferred after an experiment), a major scRNA-seq data analysis task. Given a pre-defined significance level [e.g. a false discovery rate (FDR)], the power of an scRNA-seq experiment for detecting DE genes is jointly determined by the sensitivity of detecting gene expression, the accuracy of measuring gene expression and the num-ber of cells sequenced for each cell state. For each protocol and a specified total sequencing depth (i.e., the total number of reads in an scRNA-seq experiment), the cell-wise sequencing depth (i.e. the expected number of reads per cell) decreases as the cell number
increases (Haqueet al., 2017). However, existing power analysis methods for scRNA-seq experiments unrealistically assume a fixed cell-wise sequencing depth, which does not change as the cell num-ber varies (Viethet al., 2017;Ziegenhainet al., 2017). Therefore, the practical scRNA-seq experimental design calls for a new ap-proach that accounts for various characteristics and constraints of a real scRNA-seq experiment.
ScDesign is a simulation-based experimental design framework that has multiple advantages in real practice. First, scDesign is protocol- and data-adaptive. It learns scRNA-seq data characteris-tics from rapidly accumulating public scRNA-seq data generated under diverse settings. For example, 1976 series of scRNA-seq data-sets are currently available in the Gene Expression Omnibus (GEO) database (Edgar et al., 2002). There are also newly developed scRNA-seq databases,such as SCPortalen (70 studies with 67 146 cells) (Abugessaisa et al., 2018), scRNASeqDB (36 studies with 8910 cells) (Caoet al., 2017) and the Single Cell Portal (43 studies with 496 366 cells). Second, scDesign generates synthetic data that well mimic real scRNA-seq data under the same experimental set-tings, providing a basis for using its synthetic data to guide practical scRNA-seq experimental design. Third, scDesign is flexible in accommodating user-specific analysis needs. Users can apply scDesign to evaluate the performance of downstream analysis, such as gene differential expression and cell clustering, under various ex-perimental settings at no exex-perimental cost. Assisted by the evalu-ation results, users will be able to design an scRNA-seq experiment based on the setting that leads to the best performance according to their specified criteria.
2 Materials and Methods
2.1 The statistical framework of scDesign
We develop scDesign based on a statistical generative framework that utilizes both existing real scRNA-seq data and reasonable assumptions mimicking various experimental processes. In contrast to the existing simulation methods for scRNA-seq data, scDesign constructs a Gamma-Normal mixture model to account for dropout events. This is motivated by the successful applications of our previ-ously developed imputation method, scImpute, for recovering drop-out gene expression values in scRNA-seq data (Li and Li, 2018a). This mixture model allows scDesign to overcome the dropout hurdle in learning key gene expression characteristics from real scRNA-seq data (Supplementary Fig. S1), so that scDesign generates synthetic data highly similar to real data in multiple aspects. Depending on whether the task is to design an scRNA-seq experiment to sequence one or two batches of cells, scDesign has the corresponding one-state mode (Supplementary Fig. S2a) or the two-state mode (Supplementary Fig. S2b). In the one-state mode, scDesign leverages the information in a real scRNA-seq dataset from one biological condition (e.g. treatment or control) or one cell state (e.g. T cells) to generate a single scRNA-seq dataset given an experimental setting, i.e. a pre-specified total sequencing depth and a cell number. From the real scRNA-seq dataset, scDesign first estimates two cell-wise and three gene-wise parameters, which jointly define the key charac-teristics of scRNA-seq data. Second, scDesign simulates ideal gene expression levels for new cells of the same biological condition or cell state based on the estimated gene expression parameters. Third, scDesign introduces missing values to mimic the actual dropout events in an scRNA-seq experiment. Fourth, scDesign outputs a syn-thetic gene expression matrix with entries as read counts. In the two-state mode, scDesign leverages the information in two real
scRNA-seq datasets from different biological conditions or cell states to generate two scRNA-seq datasets given an experimental setting. In this two-state mode, the simulation by scDesign mimics an experiment where two groups of cells from two biological condi-tions or cell states are sequenced together (Supplementary Fig. S2b).
2.2 scDesign for scRNA-seq data simulation
In this section, we describe how scDesign generates simulated RNA-seq data given existing real scRNA-RNA-seq data from a certain cell state. These simulated count matrices capture the characteristics of real count matrices, and they thus can be used to assist the development of computational methods and evaluate the performance of those methods under user-specified settings. We introduce how to simu-late a single count matrix below. Please refer to theSupplementary Materialfor simulating multiple count matrices following a differen-tiation path.
Given a real single-cell count matrix withIgenes andJ0cells,
our goal is to generate a new count matrix withIgenes andJcells, under the constraint that the new matrix has a total of S reads (Supplementary Fig. S2a). BothJandSare user-specified parame-ters. This resembles the real scenario where both the cell number and the total read number (i.e. the total sequencing depth) need to be specified before an scRNA-seq experiment.
2.2.1. Step 1: Estimate parameters from real scRNA-seq data Denote the real single-cell count matrix byXreal, whoseIrows and
J0columns represent the genes and cells, respectively. About the two
cell-wise parameters, for each celljwe estimated its library size as
^ s0j¼ XI i¼1 Xreal ij ; j¼1;. . .;J0;
and its cell-wise dropout rate as
^ q0j¼ 1 I XI i¼1 I Xreal ij ¼0 n o ; j¼1;. . .;J0:
Then we fit the cell library sizes ^s01;. . .;^s0J0 using a truncated Normal distribution, and the estimated mean and standard devi-ation (SD) are denoted asl^sand^rs, respectively.
To estimate the three gene-wise parameters, we first normalized the read counts given their corresponding library sizes and then per-formed a logarithmic transformation on the normalized values. The transformed matrix is denoted asXlog, where
Xijlog ¼log10 medianf^s01;. . .;^s0Jg ^ s0j Xreal ij þ1:01 ! :
Using the Gamma-Normal mixture model described in the scImpute method (Li and Li, 2018a), we estimated the gene-wise dropout rate and mean and SDof gene expression. The mixture model considers the expression levels of geneias independently and identically distributed random variableXilog1 ;. . .;XiJ0log following the density function
fiðxÞ ¼k0iGammaðx;a0i;b0iÞ þ ð1k0iÞNormalðx;l0i;r20iÞ; wherek0iis genei’s dropout rate,a0iandb0iare the shape and rate parameters of the Gamma distribution andl0iandr0iare the mean and SD of the Normal distribution. The Gamma component describes the gene expression distribution when dropout occurs, while the Normal component represents the distribution of actual gene expression levels. We use multiple real scRNA-seq datasets to
demonstrate that this mixture model outperforms the widely used Negative Binomial model in terms of goodness of fit to real data (Supplementary Fig. S1). The parameters in this model can be esti-mated by the Expectation-Maximization (EM) algorithm and the resulting dropout rate, mean and SD estimates are denoted as
^
k0i;l^0iand^r0i, respectively. We then used a Gamma distribution to fit the estimated gene mean expression levels ^l01;. . .;^l0I and denoted the estimated shape and scale parameters ask^0and^h0.
To summarize, we estimated two cell-wise parameters including the cell library size ^s0j and the cell-wise dropout rate q^0j (j¼1;. . .;J0), and three gene-wise parameters including the mean expression ^l0i, the SD ^r0i and the gene-wise dropout rate ^k0i (i¼1;. . .;I).
2.2.2. Step 2: Simulate ideal gene expression values
In this step, we simulated the ideal expression values independently for each gene without considering varying cell library sizes and the dropout issue. For each genei(i¼1;. . .;I), we first simulated its mean expressionliGammaðk^0;^h0Þ, then we simulated its SD by stratified sampling from the binned observations, which we proc-essed from the real count matrix. Specifically, we divided the esti-mated gene mean expression valuesf^l01;. . .;^l0IgintoBintervals, and we use^l0ðkÞ to denote thekth order statistic off^l01;. . .;l^0Ig. Then, the first interval is 1;l^0ð1Þþ
^ l0ðIÞ^l0ð1Þ B i , thebth interval (1<b< B) is ^l0ð1Þþ ^ l0ðIÞ^l0ð1Þ B ðb1Þ;^l0ð1Þþ ^ l0ðIÞ^l0ð1Þ B b i and the Bth interval is ^l0ð1Þþ ^ l0ðIÞl^0ð1Þ B ðB1Þ;þ1 i . We define^z0i¼bif ^
l0i belongs to thebth bin, and similarly we definezi¼ bif li
belongs to thebth bin. We simulated the SDriof geneiby sampling
from the stratified gene SDs estimated from the real data: riUniformðf^r0i0: ^z0i0¼zi;i0¼1;. . .;IgÞ. Finally, we generated the ideal expression matrix Xideal, where Xideal
ij i:i:d:
Normalðli;r2iÞ;j¼1;. . .;J.
2.2.3. Step 3: Introduce dropout events
In this step, we introduced dropout events into the synthetic count matrix, while accounting for the variability of both gene-wise and cell-wise dropout rates. The cell-wise dropout rate in a synthetic cell
jwas simulated asqji:i:d:Uniformðf^q01;. . .;q^0J0gÞ;j¼1;. . .;J. For each genei(i¼1;. . .;I), we simulated its gene-wise dropout rateki
by sampling one value from the stratified dropout rates estimated from the real data: kiUniformðf^k0i0: ^z0i0¼zi;i0¼1;. . .;IgÞ. Then, we simulated the number of dropout events of gene i:
niBinomialðJ;kiÞ. In other words, geneiwas affected by the drop-out events innicells. Thesenicells were sampled without
replace-ment from the cell populationf1;2;. . .;Jg, with celljbeing selected with probability qj
PJ j¼1qj
. We denote the sampling results byIij, with
Iij¼1 indicating that geneiis a dropout in celljandIij¼0
indicat-ing that geneiis successfully amplified in cellj,j¼1;. . .;J. Then we obtained the synthetic count matrix with dropout eventsXdrop, whereXdropij ¼ ½10Xideal
ij IfIij¼0g1:01; and½x is the nearest integer tox.
2.2.4. Step 4: Simulate the final count matrix
We first simulated the library size of each synthetic cell j:
sji:i:d:Normalð^ls;r^2sÞ;j¼1;. . .;J, and then we calculated the expected proportion of each entry in the count matrix
Pij¼ sjXdropij PI i¼1 PJ j¼1sjXdropij :
Finally, we obtained the final synthetic count matrixXsyn, which is constrained by the sequencing depthS, by simulating its counts from the multinomial distribution: ðXsyn11;. . . ;X
syn 1J ;. . .; X syn I1;. . .; XsynIJ Þ Multinomial S;ðP11;. . .;P1J;. . .;PI1;. . .;PIJÞ :
2.3 scDesign for scRNA-seq experimental design
ScDesign aims to determine the best number of cells to sequence given a fixed sequencing depth, such that the resulting RNA-seq data are optimized for differential gene expression analysis. We de-note the two real count matrices asXreal1, withIrows (genes) andJ01columns (cells), andXreal2, withIrows (genes) andJ02columns
(cells). Without loss of generality, we assume that the two matrices, which represent two cell states, have the same genes listed in the same order. We introduce how to simulate a synthetic count matrix for each state with scDesign in two scenarios, and the procedure is then repeated with varying cell numbers to obtain synthetic data for power analysis (Supplementary Material).
2.3.1 Scenario (1)
In scenario (1), we assume that cells from the two cell states are pre-pared as separate libraries and sequenced independently. Given
Xreal1andXreal2, the goal of scDesign is to generate a synthetic count matrix withIgenes andJ1cells for state 1, and a synthetic count
ma-trix withIgenes andJ2cells for state 2. Cell states 1 and 2 have
sequencing depths of S1 and S2, respectively. For each state
gðg¼1;2Þ, we follow Section 2.2 to simulate a count matrixXsynIJ;gg. The only difference is in step 2, where we directly setlgi ¼l^g0i and
rgi ¼^rg0i;i¼1;. . .;I, instead of simulating new parameters. This is to ensure that the rows in the two simulated matrices still represent the same set of real genes, and the power analysis based on the simu-lated data is biologically meaningful.
2.3.2 Scenario (2)
Now we consider the case where the two cell states are jointly sequenced. Suppose that the two cell states are mixed in one bio-logical sample, and the experimental setting is thatJcells are to be sequenced to generateSRNA-seq reads in total. We assume that the two cell states present in fractions ofp1andp2in the sample,
re-spectively. That is, 0< p1 < 1;0< p2 < 1 and p1þp2 1. Whenp1þp2 <1, there are more than two cell states present in the same sample. The goal of scDesign in scenario (2) is to simulate count matrices for the two selected cell states, based on a real count matrix of each state (Supplementary Fig. S2b).
1. Determine cell numbers.
We denote the numbers of cells from state 1, state 2 and the remaining states asJ1,J2and Jr, respectively. These numbers
were sampled from a Multinomial distribution:
ðJ1;J2;JrÞ Multinomial
J;ðp1;p2;1p1p2Þ
: 2. Simulate count matrices with dropout events.
Following steps 1–3 in Section 2.2, we simulated two count matricesXdrop1IJ1 andX
drop2
IJ2 for cell states 1 and 2, respectively. The only difference is in step 2, where we directly set lgi ¼^lg0i and
rgi ¼^rg0i;i¼1;. . .;I, to ensure that the rows in the synthetic count matrices represent the same set of real genes.
3. Simulate the final count matrices.
We first simulated the library sizes of the cells in the two states:
s1 j Normal ^ l1s;ð^r1sÞ 2 ;j¼1;. . .;J1; s2 j Normal ^ l2s;ð^r2sÞ 2 ;j¼1;. . .;J2;
where^l1s and^r1s are estimated fromXreal1, and^l2s and^r2s are esti-mated fromXreal2. Then we combined the two count matrices to ob-tain the expected proportion matrixPIðJ1þJ2Þ:
Pij¼ Zij PI i¼1 PJ1 j0¼1s1j0X drop 1 ij0 þ PI i¼1 PJ2 j00¼1s2j00X drop 2 ij00 ; where Zij¼s1jX drop 1 ij if 1 j J1, and Zij¼s2jJ1X drop 2 iðjJ1Þ if
J1 < j J1þJ2. The firstJ1columns and the lastJ2columns inP
give the expected proportions of genes in cell states 1 and 2, respect-ively. We further assume that the total number of reads from the two states together isS0¼ ½SðJ1þJ2Þ=J, where½xdenotes the near-est integer tox. Then we simulated the final count matrixXsynIðJ1þJ2Þ
constrained by the sequencing depth from a Multinomial distribu-tion:ðXsyn11;. . .;X syn 1ðJ1þJ2Þ;. . .;X syn I1;. . .;X syn IðJ1þJ2ÞÞ Multinomial S0; ðP11;. . .;P1ðJ1þJ2Þ;. . .;PI1;. . .;PIðJ1þJ2ÞÞ
:The final count matrix of cell state 1 and state 2 are XsynIJ1;1 (X
syn;1 ij ¼X syn ij ) and X syn;2 IJ2 Xsynij ;2¼X syn iðjþJ1Þ , respectively.
3 Results
3.1 scDesign captures key characteristics of scRNA-seq
data
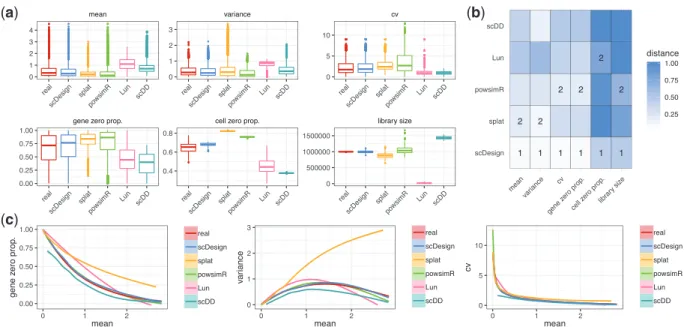
We first demonstrate that scDesign accurately captures six key char-acteristics of real scRNA-seq data, so it serves as a reliable data simulator to assist scRNA-seq experimental design and to compare relevant computational methods. To assess the simulation perform-ance of scDesign as compared with four other simulation methods, splat, powsimR, Lun and scDD, we compared the simulated data generated by each method with the real data from various protocols. Both splat and powsimR are software packages for simulating scRNA-seq data (Vieth et al., 2017; Zappia et al., 2017); Lun denotes the simulation design introduced by Lunet al.(Lunet al., 2016); scDD denotes the simulation method designed to evaluate the DE method scDD (Korthaueret al., 2016). We considered six experimental protocols:Smart-seq2 (Picelliet al., 2013), Drop-seq (Macosko et al., 2015), 10x Genomics (Zheng et al., 2017), Fluidigm C1 (SMARTer) (Pollenet al., 2014), inDrop (Kleinet al., 2015) and Seq-Well (Gierahnet al., 2017), and we collected three real scRNA-seq gene expression datasets of distinct cell types from each protocol (Supplementary Table S1). In summary, we used 18 real count matrices of 17 cell types from human and mouse to evalu-ate the five simulation methods.
For each real count matrix, we randomly split the columns (cells) into two subsets of equal sizes, one used to estimate gene expression parameters and simulate a new count matrix with the same dimen-sions, and the other used to evaluate the simulation results. We com-pared each pair of real and simulated count matrices in terms of six summary statistics, including four gene-wise statistics [the count mean, the count variance, the count coefficient of variation (cv) and
the gene-wise zero proportion) and two cell-wise statistics (the li-brary size and the cell-wise zero proportion) (Supplementary Material). Our results show that scDesign well mimics real scRNA-seq experiments based on all the six experimental protocols, even though those protocols generate data with distinct properties. For example, data from Smart-seq2 and Fluidigm C1 have relatively larger library sizes and smaller count cvs (Fig. 1a and
Supplementary Figs S3 and S4), while data from the other four pro-tocols have smaller library sizes and larger zero proportions (Supplementary Figs S5–S8). We measured the similarity between each summary statistics’ empirical distributions in real and the cor-responding simulated data by each simulation method, using the Kolmogorov–Smirnov (KS) distance, whose value is between 0 and 1 and a smaller value indicates greater similarity (Supplementary Material). Comparing the KS distances of the five methods, we found that scDesign performs the best for five protocols: Smart-seq2, Fluidigm C1, Seq-Well, Drop–seq and inDrop (Fig. 1band
Supplementary Figs S3–S5, S7 and S8), while scDesign and powsimR perform comparably for 10x Genomics (Supplementary Fig. S6). In summary, scDesign is ranked the best in 84 comparisons and the second best in 20 comparisons, among all the 108 compari-sons (6statistics for each of the 18 datasets). In addition, our results also show that scDesign is able to preserve the relationships between genes’ expression mean and expression variance, expression cv and zero proportion (Fig. 1c). The demonstrated advantage of scDesign is rooted in its ability to incorporate both parametric and non-parametric methods to simulate scRNA-seq data. By constructing a mixture model to account for the dropout events, scDesign explicitly models the gene-wise parameters from the real data. When generat-ing cell-wise parameters for the simulated cells, scDesign uses differ-ent sampling techniques for each parameter to capture its distribution characteristic. In terms of the method stability, scDesign, Lun and splat successfully estimated simulated data for all the 18 datasets, while scDD encountered errors with 5datasets, and powsimR had errors with 4 datasets.
3.2 scDesign guides rational scRNA-seq experimental
design
Given a fixed sequencing depth in designing an scRNA-seq experi-ment, scDesign assists users in predicting the optimal number of cells for sequencing. In the context of gene differential expression ana-lysis of two cell states, the cell number is optimal if its resulting scRNA-seq data lead to the most accurate detection of DE genes, where the accuracy depends on a user-specified criterion, e.g. a stat-istical test’s power given a significance level. We consider two scen-arios: (1) cells from the two cell states are prepared as two separate libraries and sequenced independently; (2) cells from the two cell states are prepared in the same library and sequenced together. Scenario (1) includes many studies that investigated cells collected at two differentiating time points, cells of the same tissue type from patients and healthy subjects or cells of the same type but exposed to different experimental treatments (Jaitinet al., 2014; Shekhar et al., 2016). The experimental design under scenario (1) aims to se-lect the optimal cell numbers simultaneously for two libraries, so that the subsequent DE analysis becomes the most accurate given a user-specified criterion. Scenario (2) includes many scRNA-seq stud-ies that sequenced anin vivotissue sample, e.g. the peripheral blood mononuclear cell sample (Zhenget al., 2017), which is composed of a mixture of cell subtypes. In scenario (2), DE analysis is performed on a pair of known or putative cell subtypes within the sequenced sample. We consider the experimental design to optimize the DE analysis between two pre-selected cell subtypes under scenario (2).
In scenario (1), the constraints are the total sequencing depths of the two cell states, and scDesign aims to determine the optimal cell number for each cell state, among a set of candidate cell numbers. ScDesign simulates a new count matrix of each state based on a real count matrix of the same state, for each pre-specified sequencing depth and cell number. Once obtaining the simulated count matrices corresponding to various candidate cell numbers, scDesign assesses the accuracy of DE gene identification using five measures: preci-sion, recall, true negative rate, F1 score (the harmonic mean of
(
a
)
(
c
)
(
b
)
Fig. 1.Comparison of scRNA-seq simulation methods based on the Smart-seq2 protocol. (a) The gene-wise expression mean, expression variance, expression coefficient of variation, zero proportion and the cell-wise zero proportion and library size in both real (monocytes) and simulated datasets. (b) The KS distances between the six statistics in the real and simulated data. The best and second best simulation methods with respect to each statistic are respectively marked with 1 and 2 in the heatmaps. (c) The empirical relationships between the key statistics in the real and simulated data
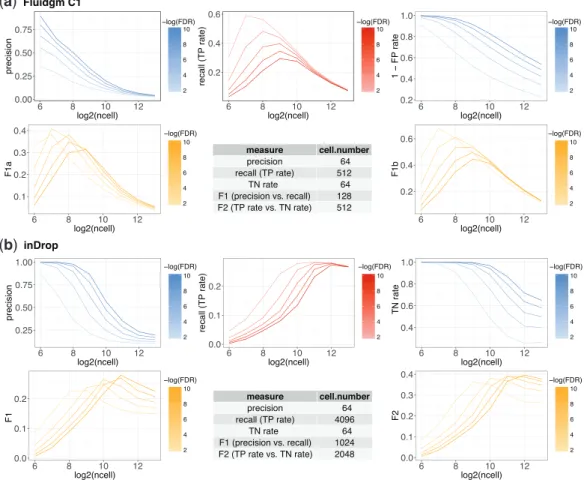
precision and recall) and F2 score (the harmonic mean of true nega-tive rate and recall) (Supplementary Table S2). We applied scDesign to optimize the designs of 14 example experiments (Supplementary Table S3). In every experiment, we set the sequencing depth to 100 million reads, and consideredeight candidate cell numbers per cell state: 64, 128, 256, 512, 1024, 2048, 4096 and 8192. The DE genes between two cell states were identified using the two-samplet-test.
Our results suggest that given a selected criterion in the DE ana-lysis, the optimal cell number is jointly determined by multiple tech-nical factors, including the experimental protocol and the variation introduced by sequencing, as well as biological factors, such as the intra- and inter-state cellular heterogeneity. Two factors are notable. First, when cells of the same two states are sequenced, the optimal cell number varies with protocols. For example, between two sub-types of glial cells: astrocytes and oligodendrocytes, 512 cells per state is the optimal cell number that maximizes the recall in DE ana-lysis when Fluidigm C1 is used, but the number becomes 4096 per state when inDrop is used (Fig. 2). If users choose the F1 score as the criterion, the optimal cell number per state is 128 and 1024 for Fluidigm C1 and inDrop, respectively. Therefore, Fluidigm C1 and inDrop require vastly different cell numbers to reach the same level of accuracy in DE analysis, and inDrop generally needs more cells than Fluidigm C1. This result is reasonable, since inDrop is a tag-based protocol that is advantageous in capturing more cells but dis-advantageous in measuring each cell accurately, compared with the full-length protocol Fluidigm C1. Second, under the same protocol, the optimal cell number depends on the transcriptome similarity of
the two cell states. For instance, with Smart-seq2, 512 cells need to be sequenced per state to maximize the recall in identifying DE genes between two dendrocyte subtypes, but only 256 cells per state are needed when dendrocytes are compared with monocytes (Supplementary Fig. S9). If the goal is to maximize the F2 score, the optimal cell number for comparing the two dendrocyte subtypes remains 512 per state, but the number reduces to 128 for comparing dendrocytes with monocytes. It is worth noting that the optimal cell number for both comparisons becomes 64, the smallest candidate cell number, when the criterion is the precision or the true negative rate (Supplementary Table S3). The reason is that only the genes with strong DE signals are detectable with a small sample size (cell number) in any statistical testing. Hence, with a reasonable lower bound on the cell number, the DE genes detected at a smaller cell number have a higher precision. Unlike the precision, the largest re-call in DE analysis is mostly achieved at a medium to large cell num-ber. In all the experimental designs we evaluated, the recall rate of DE genes first increases with the cell number and then decreases after reaching a peak (Fig. 2andTable S3). These results demon-strate the trade-off between the cell number and the cell-wise library size in scRNA-seq experiments. A combination of a small cell num-ber and a large cell-wise library size ensures the identification of the DE genes with strong DE signals (i.e. achieving a high precision rate), but the small cell number may prohibit the detection of the DE genes with small to medium DE signals (i.e. sacrificing the recall rate). On the other hand, a combination of a reasonably large cell number and a small cell-wise library size increases the recall rate in
(
a
)
(
b
)
Fig. 2.Power analysis for DE studies comparing astrocytes and oligodendrocytes scenario (1). The thresholds on the FDRs to identify DE genes are denoted in the color legends. The table summarizes the optimal cell number according to each measure. (a) The Fluidigm C1 protocol and (b) the inDrop protocol
detecting DE genes but compromises the precision rate due to high dropout rates (Supplementary Fig. S10). We also performed the DE analysis by replacing the two-samplet-test with an scRNA-seq DE method MAST (Finaket al., 2015) (Supplementary Table S4). The optimal cell number remains 64 per state when the criterion is the precision. The optimal cell numbers defined by the recall have small differences from thet-test results, but the scale and trend remain largely consistent.
In scenario (2), the constraint is the total sequencing depth of one experiment with at least two cell states, and the goal is to deter-mine the optimal total cell number for that experiment given a cri-terion in DE analysis. ScDesign simulates a new count matrix of each cell state based on a real count matrix from the same state, with pre-specified total sequencing depth, total cell number and cell proportions of the two cell states of interest. We applied scDesign to evaluate the designs of 12 example experiments (Supplementary Table S5). In every experiment, we set the sequencing depth to 100 million reads and considered six cell numbers: 512, 1024, 2048, 4096, 8192 and 16 384. We estimated the cell proportions of the two cell states from the corresponding real data (Supplementary Table S5). In practical applications of scDesign, the cell state pro-portions can be inferred from pilot studies, public data or literature (Gierahnet al., 2017;Macoskoet al., 2015).
In contrast to scenario (1), the optimal total cell number in scen-ario (2) depends on an additional factor: the cell state proportions, aside from the technical and biological factors we have discussed. The two cell states of interest may present in various proportions de-pending on biological conditions and experimental protocols, and larger cell state proportions in general reduce the demand of a larger total cell number. For example, the estimated cell state proportions of astrocytes and oligodendrocytes in a human brain sample are 19.2% and 14.9%, respectively (Darmaniset al., 2015), and 1024 cells are needed to maximize the recall with Fluidigm C1 (Supplementary Fig. S11). In a mouse visual cortex sample, how-ever, the estimated proportions of the same two cell types are 8.8% and 13.1%, respectively, and 16 384 cells are required to achieve the highest recall with inDrop (Supplementary Fig. S11). Given an experimental protocol, the optimal total cell number depends on both the two cell state proportions and the magnitude of gene ex-pression differences between the two cell states. For example, the proportions of CD4 cells, CD8 cells and B cells in a human periph-eral blood mononuclear sample are 17.2%, 10.2% and 7.3%, re-spectively (Gierahnet al., 2017). Two important facts about this experiment are: first, the proportion of CD8 cells is higher than the proportion of B cells; second, the magnitude of gene expression
differences is larger between CD4 and B cells than between CD4 and CD8 cells. With the Seq-Well protocol, the DE analysis of CD4 versus B cells only needs 4096 cells to achieve the highest F1 score. On the other hand, the DE analysis of CD4 versus CD8 requires 16 384 cells to maximize the F1 score (Supplementary Fig. S12). To fur-ther assess the effects of cell state proportions on DE analysis, we synthesized CD4 and B cells with multiple hypothetical cell propor-tions: 10%;20%;30% and 40% (Supplementary Fig. S13), among which the mixture of 40% B cells and 2030% CD4 cells led to the minimum cell number required to maximize the recall and preci-sion. Determining the optimal cell state proportions given a total cell number is especially useful when the cell states of interest can be enriched by fluorescence-activated cell sorting (Jaitinet al., 2014) or flow cytometry (Yen-Reiet al., 2016) before the sequencing step.
3.3 scDesign demonstrates reproducibility across
studies
In addition to evaluating the results of scDesign across different cell types and scRNA-seq protocols, we also analyzed the experimental designs of the same cell types and protocols but different datasets, in attempt to assess the reproducibility of scDesign.
First, we applied scDesign to optimize the pairwise DE analysis between the oligodendrocyte precursor cells (OPCs) and three other brain cell types: differentiation-committed oligodendrocyte precur-sors (COPs), myelin-forming oligodendrocytes (MFOs) and newly formed oligodendrocytes (NFOs). Two real datasets were collected for each cell type, and the two datasets were generated using the Fluidigm C1 protocol but from different brain regions: dorsal horn and hypothalamus (Marqueset al., 2016). We applied scDesign in scenario (1), assuming a total sequencing depth of 50 million reads for each cell type. In each experiment, we assumed that the libraries of the two cell types have the same number of cells, and we consid-ered five candidate cell numbers per cell type: 64 128, 256 512 and 1024. The experimental design based on the two brain regions lead to highly consistent results. Both designs show that in a DE analysis between OPCs and COPs, the optimal number of each cell type is 64 if selected by precision or true negative rate, 512 by F2 score and 1024 by recall or F1 score (Fig. 3); to better compare OPCs and MFOs or NFOs, the optimal number of each cell type is 64 if selected by precision, recall or true negative rate, 128 by F2 score and 64 by F1 score (Supplementary Fig. S14). In fact, not only do the two designs identify the same optimal cell number in each case, but they also reveal highly consistent trends about how DE accuracy changes as the number of sequenced cells increases (Fig. 3 and
Supplementary Fig. S14). This example implies the reproducibility of scDesign when taking input data from biological replicates.
Second, we applied scDesign to optimize the pairwise DE ana-lysis between three retina cell types: muller glia, amacrine and rods. Two real datasets were collected for each cell type, and the two datasets were generated using the Drop-seq protocol in two inde-pendent studies (Macoskoet al., 2015; Shekharet al., 2016). We applied scDesign in scenario (1), assuming a total sequencing depth of 100 million reads for each cell type. In each experiment, we assumed that the libraries of the two cell types have the same num-ber of cells and considered six candidate cell numnum-bers per cell type: 64, 128, 256, 512, 1024 and 2048. The experimental design based on the single-cell studies lead to highly similar results (Supplementary Fig. S15). As in the first example, both designs iden-tified the same optimal cell number regardless of the DE criterion used. The only exception was in the comparison between the muller glia and rods: using the Macoskoet al.data, the best cell number is Fig. 3.Reproducibility of scDesign based on data from different brain regions.
The DE studies compare OPCs and COPs based on scRNA-seq data from two brain regions: dorsal horn and hypothalamus. When identifying the DE genes, the threshold set on the FDR rate is 1010. They-axis of each line are divided by the maximum value of that line for normalization
512 by F1 score and 1024 by F2 score, while using the Shekharet al.
data, the best cell number is 1024 by F1 score and 512 by F2 score. Such discrepancy is not suprising since we only evaluated a few can-didate cell numbers, and the two input datasets inevitably differ in qualities as they came from two studies. Overall, this example dem-onstrates the reproducibility of scDesign when taking input data from independent studies to design scRNA-seq experiments.
3.4 scDesign assists scRNA-seq method development
In addition to assisting single-cell experimental design, scDesign can also simulate scRNA-seq data to benchmark various computational methods for differential gene expression analysis, single cell cluster-ing analysis, gene expression dimension reduction, etc. Due to excess zeros resulting from dropout events and the fact that each gene’s ex-pression level in each cell is only measured once, the ground truth of individual genes’ expression levels in single cells cannot be accurate-ly estimated from scRNA-seq data. Also, cellular identities of indi-vidual cells are difficult to pre-determine in most experiments. Lacking the aforementioned ground truth encumbers the develop-ment of computational methods to decipher information from scRNA-seq data. Direct evaluation of computational methods relies on experimental validation, which is often unavailable for computa-tionalists, and indirect interpretation from downstream analysis is used instead as a not-so-ideal substitute. Empowered by its ability to generate synthetic scRNA-seq data that well mimic real scRNA-seq data and have ground truth information, scDesign provides a flex-ible framework to benchmark computational methods for various scRNA-seq data analysis tasks.We first demonstrated the application of scDesign to evaluating DE methods. We considered a baseline DE method, i.e. the two-samplet-test, and four DE methods [MAST (Finak et al., 2015), SCDE (Kharchenkoet al., 2014), DESeq2 (Loveet al., 2014) and edgeR (Robinsonet al., 2010)]specifically designed for scRNA-seq data. Here both DESeq2 and edgeR denote their single-cell-adapted versions, where gene expression values are weighted by the weights estimated from a zero inflated Negative Binomial model before the statistical testing step (Van den Bergeet al., 2017) . We evaluated scDesign using real scRNA-seq data of six cell types: dendrocytes (Smart-seq2, 63.6% zero count), oligodendrocytes (Fluidigm C1, 62.9% zero count), interneurons (inDrop, 75.3% zero counts), ret-inal ganglions (Drop–seq, 78.3% zero counts), enterocytes (10x Genomics, 82.0% zero counts) and natural killer cells (Seq-Well, 88.0% zero counts) (Supplementary Table S1). Based on the real data of each cell type, we simulated a pair of count matrices, with one matrix representing the given cell type and the other including up-regulated and down-regulated genes (Supplementary Material). In the first setting, we set the percentage of DE genes to 5% and sampled the fold changes of those DE genes’ expression values uni-formly from the interval½2;5. Then we evaluated the performance of the five DE methods by comparing the areas under their preci-sion–recall curves (Supplementary Fig. S16). With Smart-seq2 and Fluidigm C1, MAST and SCDE were the only two methods that achieved better accuracy than the two-samplet-test, but overall the three methods had comparable precision and recall. With inDrop and 10x Genomics, edgeR became the best DE method, followed by MAST and SCDE. With Drop-seq and Seq-Well, the most accurate method was SCDE, and the baseline two-samplet-test had poor per-formance. These simulation results suggest that scRNA-seq data from the 10x, inDrop, Drop-seq and Seq-Well protocols need more specialized statistical modeling in the DE analysis, compared with Smart-seq2 and Fluidigm C1. In the second setting, we set the
percentage of up-regulated and down-regulated genes in each com-parison to 10% and sampled the fold changes of these DE genes uni-formly from the interval½4;5. Since the magnitude of fold changes increased, the DE methods overall demonstrated improved accuracy (Supplementary Fig. S17), but the relative accuracy of the five DE methods was consistent with that under the first setting.
We next demonstrated the application of scDesign to comparing dimension reduction methods. We considered four methods: princi-pal component analysis (PCA), t-distributed stochastic neighbor embedding (tSNE) (Maaten and Hinton, 2008), independent com-ponent analysis (ICA) (Hyva¨rinen and Oja, 2000) and ZINB-WaVE (Rissoet al., 2018). We evaluated scDesign based on the same real scRNA-seq data used in the comparison of DE methods. Based on the real data of each cell type, we simulated a set of synthetic count matrices, representing multiple cell states following a differentiation path (Supplementary Material). For the Smart-seq2 and Fluidigm C1 protocols, we simulated four cell states with two states each hav-ing 80 cells and the other two each havhav-ing 50 cells. For the other four protocols, we simulated five cell states with two states each having 300 cells and the other three each having 100 cells. In each case, we first simulated the cell state at the starting point of differen-tiation based on the real data, and then we simulated each of the three subsequent cell states with 1% of up-regulated and down-regulated genes from its previous state. In addition, we sampled the fold changes of those DE genes’ expression values uniformly from
½2;5. Among the four dimension reduction methods, ZINB-WaVE had the best performance in grouping cells into biologically mean-ingful clusters based on the C1 data, followed by the tSNE method (Supplementary Fig. S18). Based on the Smart-Seq2 data, PCA had the best performance in the 2D space, followed by ZINB-WaVE (Supplementary Fig. S19). However, the comparison results were different for droplet-based protocols. The tSNE method led to the most accurate cell clusters for the Drop-seq, inDrop, 10x and Seq-Well protocols, followed by ICA or PCA (Supplementary Figs S20– S23). In addition to the clustering performance, another factor worth noting is that PCA, ICA and ZINB-WaVE generate compar-able cellcell distances after dimension reduction, but tSNE does not. The above results demonstrate the capacity of scDesign in help-ing developers evaluate compethelp-ing computational methods for the same purpose (e.g. DE analysis or dimension reduction), and in assisting users to select the appropriate method for analyzing scRNA-seq data from a specific protocol.
4 Discussion
The scRNA-seq technologies have become an essential tool for studying various biological and biomedical problems, but one unre-solved challenge is how to balance the trade-off between exploring the depth or breadth of transcriptome information in experimental design. We introduce scDesign, the first statistical and computation-al simulator that enables rationcomputation-al and practiccomputation-al scRNA-seq experi-mental design. By integrating statistical assumptions and real scRNA-seq datasets from public repositories into its generative framework, scDesign is able to mimic real experimental processes and simulate synthetic scRNA-seq datasets that well capture gene expression characteristics in real data. In addition, scDesign is a flexible and reproducible simulator that is capable of modeling protocol-specific scRNA-seq data generated under multiple biologic-al and experimentbiologic-al conditions. We conducted a comprehensive comparison of scDesign and four other scRNA-seq simulation meth-ods based on datasets from 17 different cell types and 6
experimental protocols. The comparison suggests that scDesign gen-erates synthetic data with the largest resemblance to real scRNA-seq data regardless of cell types and protocols.
Using its simulated data, scDesign performs power analysis on differential gene expression analysis to provide a quantitative and objective standard for designing future experiments. In the context of differential gene expression analysis between two cell states, scDesign suggests an optimal cell number given a fixed sequencing depth, in the trade-off between a deeper sequencing of a smaller number of cells or a shallower sequencing of a larger number of cells. Specifically, we demonstrated the application of scDesign in two scenarios, where cells from the two states are sequenced as two separate libraries or as one pooled library. We evaluated the experi-mental designs for 14 and 12 scRNA-seq studies under the two scen-arios, respectively. Our results for the first time demonstrate how the optimal experimental design for DE analysis depends on the scRNA-seq protocol and the intra- and inter-cell state transcriptome heterogeneity. In addition, our results revealed a general phenom-enon that a deeper sequencing of a smaller number of cells leads to a higher precision in DE analysis. In contrast to the precision, maxi-mizing the recall of DE analysis requires finding a balance between the cell-wise sequencing depth and the cell number, because our results show that the recall first increases and then decreases as we increase the cell number with the total sequencing depth fixed. ScDesign enables researchers to design effective scRNA-seq experi-ments without pre-experimental costs in an objective manner, for example, guided by the expected power in downstream DE analysis. In addition, we demonstrate that scDesign leads to reproducible ex-perimental design for target cell states given data generated in differ-ent studies.
Aside from enhancing future experimental design, another main contribution of scDesign is to assist computational method develop-ment for scRNA-seq. Since large-scale benchmark data are not yet available in the field, computationalists typically rely on scRNA-seq datasets from public repositories to test and evaluate new methods and algorithms. However, quality control and normalization of real data are themselves ongoing research questions, making the evalu-ation results in many method papers not comparable nor reprodu-cible (McCarthyet al., 2017;Ziegenhainet al., 2017). To tackle this challenge, scDesign allows users to generate synthetic scRNA-seq datasets with user-specified experimental protocols, sequencing depths, cell states, cell numbers, as well as pre-specified DEgenes. Given that scDesign generates synthetic data that have known truth and well mimic real data, users can leverage its synthetic data to comprehensively evaluate computational and statistical methods in a flexible, reproducible and comparable way. For example, we com-pared five DE methods (the two-sample t-test, MAST, SCDE, DESeq2 and edgeR) and four dimension reduction methods (PCA, tSNE, ICA and ZINB-WaVE) using synthetic data generated by scDesign. Those comparison results provide useful guidance for researchers to select the most appropriate computational method to analyze real data.
We expect scDesign to assist scRNA-seq experimental design for a vast array of available experimental protocols. ScDesign incorpo-rates real scRNA-seq data into its statistical framework to make flexible decisions based on the protocol and cell states used in the target study. If the real data of the two cell states are not generated from the same experiment, it is recommended to first correct the batch effect before applying scDesign (Butleret al., 2018;Haghverdi et al., 2018). To extend scDesign’s ability to evaluate experimental designs for cell states whose scRNA-seq data are not yet publicly
available, a future direction is to incorporate bulk RNA-seq data of the same type as a surrogate to estimate the gene expression parame-ters. Otherwise, pilot experiments need to be conducted to collect data for experimental design, which is also a widely adopted prac-tice (Chatterjeeet al., 2018). Another future extension of scDesign is to find the optimal design in the context of other types of down-stream analyses besides the differential gene expression analysis, such as the detection of novel cell sub-types or the recovery of tem-poral transcriptome trajectories (Dumitrascuet al., 2018). For in-stance, we may jointly learn the proportions and the gene expression profiles of multiple cell states from real scRNA-seq data and use them as input into our simulation framework to evaluate how the power of detecting rare cell types changes with experimental param-eters. Given time-series scRNA-seq data, the scDesign framework can be modified to conduct ANOVA or more advanced statistical analysis to objectively select cell numbers for multiple time points. It is also possible to generalize the simulation framework of scDesign to account for more complex trajectories in the cell differentiation process (Cannoodtet al., 2019;Papadopouloset al., 2019). We ex-pect scDesign to be an effective bioinformatic tool that assists ra-tional scRNA-seq experiment design and benchmarks competing scRNA–seq computational methods based on specific research goals.
Funding
This work was supported by the following grants: UCLA Dissertation Year Fellowship (to W.V.L.); and National Science Foundation [DMS-1613338, DBI-1846216]; National Institutes of Health/NIGMS [R01GM120507]; PhRMA Foundation Research Starter Grant in Informatics; Johnson & Johnson WiSTEM2D Award and Sloan Research Fellowship (to J.J.L.).
Conflict of Interest: none declared.
References
Abugessaisa, I.et al. (2018) SCPortalen: human and mouse single-cell centric database.Nucleic Acids Res.,46, D781–D787.
Bacher, R. and Kendziorski, C. (2016) Design and computational analysis of single-cell RNA-sequencing experiments.Genome Biol.,17, 63.
Baran-Gale, J.et al. (2017) Experimental design for single-cell RNA sequenc-ing.Brief. Funct. Genomics,17, 233–239.
Butler, A.et al. (2018) Integrating single-cell transcriptomic data across differ-ent conditions, technologies, and species.Nat. Biotechnol.,36, 411.
Cannoodt, R. et al. (2019) Dynbenchmark: accuracy, scalability,
robustness and usability of single-cell trajectory inference methods. In:
Single Cell Biology, Breckenridge, CO, January 13, 2019.
Cao, Y.et al. (2017) scRNASeqDB: a database for RNA-seq based gene
ex-pression profiles in human single cells.Genes,8, 368.
Chatterjee, A.et al. (2018) A guide for designing and analyzing RNA-seq data. InGene Expression Analysis. Humana Press, New York, NY, pp. 35–80. Darmanis, S.et al. (2015) A survey of human brain transcriptome diversity at
the single cell level.Proc. Natl. Acad. Sci. USA,112, 7285–7290. Dumitrascu, B.et al. (2018a) GT-TS: experimental design for maximizing cell
type discovery in single-cell data. bioRxiv, doi:10.1101/386540.
Edgar, R.et al. (2002) Gene Expression Omnibus: NCBI gene expression and
hybridization array data repository.Nucleic Acids Res.,30, 207–210. Finak, G.et al. (2015) Mast: a flexible statistical framework for assessing
tran-scriptional changes and characterizing heterogeneity in single-cell RNA sequencing data.Genome Biol.,16, 278.
Gierahn, T.M.et al. (2017) Seq-well: portable, low-cost RNA sequencing of
single cells at high throughput.Nat. Methods,14, 395.
Gru¨n, D. and van Oudenaarden, A. (2015) Design and analysis of single-cell sequencing experiments.Cell,163, 799–810.
Haghverdi, L.et al. (2018) Batch effects in single-cell RNA-sequencing data are corrected by matching mutual nearest neighbors.Nat. Biotechnol.,36, 421. Haque, A.et al. (2017) A practical guide to single-cell RNA-sequencing for
biomedical research and clinical applications.Genome Med.,9, 75. Hyva¨rinen, A. and Oja, E. (2000) Independent component analysis:
algo-rithms and applications.Neural Netw.,13, 411–430.
Jaitin, D.A. et al. (2014) Massively parallel single-cell RNA-seq for
marker-free decomposition of tissues into cell types.Science,343, 776–779. Jiang, L.et al. (2011) Synthetic spike-in standards for RNA-seq experiments.
Genome Res.,21, 1543–1551.
Kharchenko, P.V.et al. (2014) Bayesian approach to single-cell differential ex-pression analysis.Nat. Methods,11, 740–742.
Kivioja, T.et al. (2012) Counting absolute numbers of molecules using unique molecular identifiers.Nat. Methods,9, 72.
Klein, A.M.et al. (2015) Droplet barcoding for single-cell transcriptomics
applied to embryonic stem cells.Cell,161, 1187–1201.
Kolodziejczyk, A.A.et al. (2015) The technology and biology of single-cell RNA sequencing.Mol. Cell,58, 610–620.
Korthauer, K.D.et al. (2016) A statistical approach for identifying differential distributions in single-cell RNA-seq experiments.Genome Biol.,17, 222. Li, W.V. and Li, J.J. (2018a) An accurate and robust imputation method
scim-pute for single-cell RNA-seq data.Nat. Commun.,9, 997.
Li, W.V. and Li, J.J. (2018b) Modeling and analysis of RNA-seq data: a review from a statistical perspective. arXiv preprint arXiv: 1804.06050.
Love, M.I.et al. (2014) Moderated estimation of fold change and dispersion
for RNA-seq data with DESeq2.Genome Biol.,15, 550.
Lun, A.T.et al. (2016) Pooling across cells to normalize single-cell RNA
sequencing data with many zero counts.Genome Biol.,17, 75.
Maaten, L.V.D. and Hinton, G. (2008) Visualizing data using t-SNE.J. Mach.
Learn. Res.,9, 2579–2605.
Macosko, E.Z.et al. (2015) Highly parallel genome-wide expression profiling of individual cells using nanoliter droplets.Cell,161, 1202–1214. Marques, S.et al. (2016) Oligodendrocyte heterogeneity in the mouse juvenile
and adult central nervous system.Science,352, 1326–1329.
McCarthy, D.J.et al. (2017) Scater: pre-processing, quality control, normal-ization and visualnormal-ization of single-cell RNA-seq data in R.Bioinformatics,
33, 1179–1186.
Papadopoulos, N.et al. (2019) PROSSTT: probabilistic simulation of single-cell RNA-seq data for complex differentiation processes.Bioinformatics. Picelli, S.et al. (2013) Smart-seq2 for sensitive full-length transcriptome
profil-ing in sprofil-ingle cells.Nat. Methods,10, 1096.
Pierson, E. and Yau, C. (2015) ZIFA: dimensionality reduction for zero-inflated single-cell gene expression analysis.Genome Biol.,16, 241. Pollen, A.A.et al. (2014) Low-coverage single-cell mRNA sequencing reveals
cellular heterogeneity and activated signaling pathways in developing cere-bral cortex.Nat. Biotechnol.,32, 1053.
Quinn, G.P. and Keough, M.J. (2002) Experimental Design and Data
Analysis for Biologists. Cambridge University Press, Cambridge, England. Risso, D.et al. (2018) A general and flexible method for signal extraction from
single-cell RNA-seq data.Nat. Commun.,9, 284.
Rizzetto, S.et al. (2017) Impact of sequencing depth and read length on single cell RNA sequencing data of t cells.Sci. Rep.,7, 12781.
Robinson, M.D.et al. (2010) edger: a bioconductor package for differential expression analysis of digital gene expression data. Bioinformatics,26, 139–140.
Shekhar, K.et al. (2016) Comprehensive classification of retinal bipolar neu-rons by single-cell transcriptomics.Cell,166, 1308–1323.
Skene, N.G.et al. (2018) Genetic identification of brain cell types underlying schizophrenia.Nat. Genet.,50, 825–833.
Svensson, V.et al. (2017) Power analysis of single-cell RNA-sequencing
experiments.Nat. Methods,14, 381.
Tang, F.et al. (2009) mRNA-seq whole-transcriptome analysis of a single cell.
Nat. Methods,6, 377.
Tirosh, I.et al. (2016) Dissecting the multicellular ecosystem of metastatic melanoma by single-cell RNA-seq.Science,352, 189–196.
Van den Berge, K et al. (2017) zinger: unlocking RNA-seq tools for
zero-inflation and single cell applications. bioRxiv, doi:10.1101/157982.
Vieth, B. et al. (2017) powsimr: power analysis for bulk and single cell
RNA-seq experiments.Bioinformatics,33, 3486–3488.
Wagner, A.et al. (2016) Revealing the vectors of cellular identity with
single-cell genomics.Nat. Biotechnol.,34, 1145.
Yen-Rei, A.Y.et al. (2016) A protocol for the comprehensive flow cytometric analysis of immune cells in normal and inflamed murine non-lymphoid tis-sues.PLoS One,11, e0150606.
Zappia, L.et al. (2017) Splatter: simulation of single-cell RNA sequencing
data.Genome Biol.,18, 174.
Zhang, M.J.et al. (2018) One read per cell per gene is optimal for single-cell RNA-seq. bioRxiv, doi:10.1101/389296.
Zheng, G.X.et al. (2017) Massively parallel digital transcriptional profiling of single cells.Nat. Commun.,8, 14049.
Ziegenhain, C.et al. (2017) Comparative analysis of single-cell RNA sequenc-ing methods.Mol. Cell,65, 631–643.