NBER WORKING PAPER SERIES
GENDER DIFFERENCES IN SEEKING CHALLENGES: THE ROLE OF INSTITUTIONS
Muriel Niederle Alexandra H. Yestrumskas
Working Paper 13922
http://www.nber.org/papers/w13922
NATIONAL BUREAU OF ECONOMIC RESEARCH 1050 Massachusetts Avenue
Cambridge, MA 02138 April 2008
Muriel Niederle thanks the NSF and the Sloan Foundation for generous support, and the Institute for Advanced Study at Princeton and the economics department at Harvard for its hospitality. The experiments in this paper are part of Alexandra Yestrumskas's honors thesis at Stanford (Yestrumskas 2004). The views expressed herein are those of the author(s) and do not necessarily reflect the views of the National Bureau of Economic Research.
NBER working papers are circulated for discussion and comment purposes. They have not been peer-reviewed or been subject to the review by the NBER Board of Directors that accompanies official NBER publications.
© 2008 by Muriel Niederle and Alexandra H. Yestrumskas. All rights reserved. Short sections of text, not to exceed two paragraphs, may be quoted without explicit permission provided that full credit,
Gender Differences in Seeking Challenges: The Role of Institutions Muriel Niederle and Alexandra H. Yestrumskas
NBER Working Paper No. 13922 April 2008
JEL No. C91,J0,J16,J24
ABSTRACT
We examine whether women and men of the same ability differ in their decisions to seek challenges. In the laboratory, we create an environment in which we can measure a participants performance level (high or low), where a high performance level participant has on average higher earnings from solving a hard rather than an easy task, and vice versa. After we identify each participant's performance level, they choose the difficulty level (easy or hard) for the next two tasks (only one of which will be chosen for payment). Although there are no gender differences in performance, or beliefs about relative performance, men choose the hard task about 50 percent more frequently than women, independent of performance level. Gender differences in preferences for characteristics of the tasks cannot account for this gender gap. When we allow for a flexible choice high performing women choose the hard task significantly more often, at a rate now similar to the decision of men. Such a flexible choice makes challenging choices easier when participants are either risk averse, or uncertain about their ability. Our results highlight the role of institution design in affecting choices of women and men, and the resulting gender differences in representation in challenging tasks.
Muriel Niederle Department of Economics 579 Serra Mall Stanford University Stanford, CA 94305-6072 and NBER [email protected] Alexandra H. Yestrumskas Harvard Law School Cambridge
MA
I. INTRODUCTION
Even though women have made significant advances in terms of catching up economically with men, gender differences in wages and in representation in high profile jobs remain (e.g. Bertrand and Hallock 2001). The most common hypotheses for the gender disparity are discrimination and gender differences in abilities and in preferences for types of jobs (in terms of both field, as well as workload).1 The psychological literature suggests that women and men may differ in other dimensions that affect economic decisions. Women and men seem to differ in their self-perception of ability in many domains (Beyer 1990, and Beyer and Bowden 1997). Furthermore, these perceptions of competence are intimately tied to expectancies, aspirations, persistence and preference for challenging tasks (e.g. Boggiano, Main and Katz 1988, Cutrona et al 1994, Elliot and Dweck 1988 and Harackiewic and Elliot 1993). Hence, women are found to have lower expectancies of future performance than males in many areas of achievement (e.g. Beyer 1990, Elliot & Harackiewicz 1994). Women are not only often less certain about their abilities, they are also found to be more risk averse, and less willing to explore and test their abilities (see also Dweck 2000 and Byrnes, Miller and Shafer 1999). It follows that if women and men have different perceptions about their own abilities to perform in new environments, and different tendencies to act on such perceptions, they are likely to make different choices.
If women shy away from more challenging tasks, then they may be underrepresented given their actual abilities, which in turn may result in gender differences in economic outcomes. In this paper, we study whether for a given ability women and men differ in their preference to perform a more challenging task. We study the impact of these differences on economic outcomes, and place special emphasis on understanding underlying causes. Finally, we also investigate which changes in institutions can affect the choices of women and men, such that choices reflect the participants’ performance levels rather than their gender.
To study gender differences in preferences for harder tasks, we want to eliminate other factors that are presented as causes for why women may shy away from challenging
1
See Black and Strahan (2001), Goldin and Rouse (2000), Altonji and Blank (1999). For a general overview of gender differences in labor market outcomes, see Blau and Kahn (2000).
tasks. These are in general issues of greater time commitment of challenging tasks and differences in ability. We therefore use a laboratory experiment in which individuals choose between task difficulties in an environment in which performance is measured objectively and the time commitment is the same for both difficulty levels.
We create an environment with an easy and a hard task, such that the hard task is harder for each participant and such that high performing (or more able or motivated) participants perform better than low performing participants in each task.2 The task we use is mazes to be solved on paper for 10 minutes.3 Finally, in our environment, high performing participants have higher earnings from the hard task from than the easy task (with the appropriate incentive schemes), while it is the other way around for low performing participants. To be able to analyze the choices of women and men between hard and easy tasks we not only need meaningful labels of hard and easy, we also make participants aware of the distinction.
The first treatment checks whether we found an appropriate environment. Participants perform an easy version of the task, followed by another easy and then a hard task. Participants with a task 1 performance in the top 40% are of high performance level (i.e. have higher expected earnings from the subsequent hard than from the subsequent easy task), while others are low performing (i.e. have higher expected earnings from the easy task). This is true for women and men, who perform similarly in the initial easy task. Furthermore, women and men have similar beliefs, or more specifically similar point predictions, about their relative performance in the first easy task.4 We therefore created a level field in which we can evaluate the choices of task difficulty of women and men.
In the main treatment, participants first perform in the easy task, which allows us to predict their money-maximizing choices. Participants are then informed of the calibration, but not their performance level. They subsequently choose simultaneously the difficulty level for the next two tasks, of which only one will be randomly chosen to be payoff relevant.
2
This implies that the hard and easy task do not involve completely different sets of skills, rather participants are either good or not at both.
3
This task was previously used by Gneezy, Niederle and Rustichini (2003). 4
We therefore have an environment in which we can predict the money-maximizing choices of any participant, and in which there is no gender difference in performance, nor in the money-maximizing task difficulty for any given performance level. Furthermore, women and men hold similar beliefs about their first performance, which we use to predict money maximizing choices.
Men choose the hard task fifty percent more often than women do, even controlling for performance in the first task. Compared to predicted payoff maximizing choices, high performing women choose the hard task too seldom, while low performing men choose the hard task too often.
In the remainder of the paper, we tease apart different explanations for this gender difference and study how institutional changes affect the choices of women and men. One possible explanation for the gender gap in choosing the hard task is that women and men simply differ in how much they enjoy performing a challenging task. Another possibility is that the preferences for the tasks are driven by preferences to receive feedback about one’s relative performance. Only by performing in each task once, and comparing respective earnings, can participants receive information about their performance level. Finally, it could be that gender differences in choices are driven by gender differences in risk aversion, or in uncertainty about one’s ability to perform in more challenging tasks.5
To assess the effect of pure task preference, we change the environment so that the potential influence of other factors on the choice of task difficulty is minimized. After the first easy task, participants learn not only about the task calibration, but in addition also what performances in that first task constitute a high performance level. Participants largely choose the task that maximizes earnings. That is, we do not find strong evidence for gender differences in preferences for challenging tasks.
One remaining possible explanation rests on some characteristics of the task; it remains possible that women and men differ in their preferences for receiving feedback about their relative performance. Only by performing in the hard task once can a participant receive information about their performance level. Hence, gender differences in preferences for feedback can cause differences in seeking out challenges.
A second possible explanation is that women and men differ in how certain they are in their beliefs about their ability to perform well in harder tasks. Furthermore, even for given beliefs about one’s performance, risk averse participants may choose the familiar task, the task with more certain payoffs (such as the easy task in our experiment),
5
For example, a woman and a man who hold similar beliefs about their initial performance (have the same modal prediction) may still differ in how much they believe that their initial performance is driven by luck or actual ability, which has an impact on the beliefs about their performance level.
at a higher rate than the task with more variable payoffs (such as the hard task in our experiment).
In the last treatment, we want to tease this last explanation, which we will summarize as risk aversion and uncertainty, from the explanation of feedback aversion. Now, participants decide upon the task difficulty as in the initial choice treatment but under a reduced commitment. They choose the difficulty level for the second task only, perform that task, and only afterwards decide on the difficulty level for the third task. That is, their second choice of task difficulty in the third performance can be influenced by information they receive from their performance in the second task, which was not the case in the initial choice treatment. We changed the environment in a way that participants whose task choice is largely driven by preferences regarding feedback are not affected. On the other hand, the change in institution may affect the choices of participants whose decision is influenced by risk preferences, or their (lack of) certainty in their ability to perform in challenging environments.
We find that in the reduced commitment treatment, both high performing men and women choose the hard task more frequently. We conclude that for high performing women, risk aversion or greater uncertainty in their ability to perform well in the hard task is a major driving force leading to easy choices in the initial choice treatment. The initial gender gap in choices is therefore not due to large gender differences in feedback aversion or preferences for hard tasks per se.
This last treatment also provides a small institutional change that affects the decisions of women and men. Providing feedback aligned choices to money maximizing choices even for low performing men, but it may often be hard to provide a test that is such a good predictor for performances at various difficulty levels outside of the lab.
We start with a brief discussion of the factors that may cause women and men to choose different difficulty levels. We present our experimental design, followed by the results from the calibration treatment. The main results are presented in sections V through VIII. Finally, we compare our results to other findings in the literature, notably gender differences in competitive attitudes, and report on broader implications and other empirical evidence outside of the laboratory that supports our findings.
II. THEORY
In this paper we determine whether women and men differ in their choices of task difficulty and why. An obvious explanation for gender differences in choices is that women and men differ in their ability to perform challenging and easy tasks, hence they should select different task difficulty levels to maximize earnings.
A main contribution of this paper is to generate an environment in which we can predict the money-maximizing choice of participants and compare this to their actual choice of task difficulty. Controlling for ability, we consider four possible explanations or hypotheses why women and men may not choose the same difficulty levels.
Explanation 1-- Task Preferences: Men, more than women, prefer the hard task. Men, more than women, may have an urge to perform at the highest level and seek out challenges. Nurture as well as nature may cause such differences. First, we tend to raise boys and girls differently. Boys are in general encouraged to be assertive, while girls are raised to be egalitarian, and show empathy (Ruble, Martin and Berenbaum 2006). Furthermore, there exist gender differences in self-presentational style resulting in women exhibiting modesty and men displaying bravado (see Daubman 1992). A woman may therefore be less inclined to select the hard task, which would be a clear display of self-confidence, for fear of appearing arrogant or overconfident. Conversely, a man may seek to avoid looking unconfident or incompetent and be therefore more inclined to select the hard task even when such a choice is not based on his actual beliefs about his ability or performance. Another possibility is that women, compared to men, may be subject to a stigma that women are inferior in challenging tasks. If women internalize this stigma to some extent, then, to protect their self-esteem, they may in turn avoid and disengage from situations in which this stigma applies (Crocker and Major 1989). That is, women may prefer not to opt into the challenging task.
Evolutionary psychology brings forth explanations that focus on the fact that a man’s death does not influence his current success, while a woman’s death causes the loss of her current offspring. These differences in parental care and reproductive success may make women less eager to enter challenging environments. These evolutionary explanations are also used to explain why men are more confident in their relative
performance and less risk averse. Such gender differences may also influence the decision to enter challenging environments (Daly and Wilson 1983 and Campbell 2002).
Explanation 2-- Feedback Aversion: Women are more averse to receiving feedback about their relative performance than men are. It could be that gender differences in task difficulty reflect gender differences in preferences to receive feedback about one’s performance level (rather than gender differences in seeking out challenging tasks). In our experiment, to receive information about their performance level, participants need to compare their earnings in the hard and easy tasks. Since all participants perform in the easy task anyway, choosing the hard task provides more feedback. The psychology literature suggests that women and men may respond differently to feedback, which may lead to gender differences in seeking it. There is evidence that women incorporate negative feedback more than men do (Roberts and Nolen Hoeksama 1989, 1994). Furthermore, women more than men may view a negative signal as more indicative of their self-worth rather than simply their specific performance (see e.g. Dweck 2000). Mobius, Niederle, Niehaus and Rosenblat (in progress) in a large-scale experiment directly show a gender difference in preferences for feedback. If participants care about holding positive beliefs about themselves, these factors may contribute to women shying away from feedback, and as such from situations and tasks that provide such feedback (for a theoretic exploration see Köszegi (2006)).
Explanation 3-- Average Beliefs: Women have lower beliefs about their relative ability. A substantial psychological literature suggests that men are more overconfident than women (who are often also overconfident, just less so), see e.g. Lichtenstein, Fischhoff and Phillips (1982), Beyer (1990), and Beyer and Bowden (1997). Niederle and Vesterlund (2007) confirm this pattern, though they find a substantially larger gender gap in beliefs about relative performance in a competitive task than a noncompetitive task (see also Niederle, Segal and Vesterlund, 2007). Mobius and Rosenblat (2006) find however no gender differences in beliefs about absolute future performance in a 10 minutes maze task. If there are gender differences in beliefs about relative performance, then there will be gender differences in beliefs about whether the initial absolute performance corresponds to a performance characteristic of a high or a low performance level.
Explanation 4: Risk Aversion & Certainty: Consider a man and a woman who do not have strong preferences over the different tasks, and who do not differ in their preference to receive feedback about their relative performance. Suppose such a man and woman hold the same point estimates about their relative performance in the easy task. They may still differ in their propensity to select the challenging task. There are two broad reasons for that.
First, women may be more risk averse than men, and so, for the same belief about relative ability may opt to not choose the hard task. In the experiment, the payment of the hard task varies much more with the performance level than the payment of the easy task, and as such is more risky. Studies on gender differences in risk attitudes over monetary gambles find that either women are more risk averse than men, or that there is no gender difference. Eckel (forthcoming) summarizes the experimental literature in economics and concludes that women exhibit greater risk aversion in choices (see also Eckel and Grossman forthcoming). Furthermore, participants have not experienced the hard task, which may also contribute to the hard choice being more risky. Byrnes, Miller and Shafer (1999) provide a meta-analysis of 150 risk experiments in the psychology literature, and show that while women in some situations are significantly more averse to risk, many studies find no gender difference. They find larger and more reliable differences when studying the engagement in risky behavior, rather than choices over lotteries.
A second possibility is that women and men may differ in how certain they are about whether they are able to perform well in the hard task (e.g. Beyer 1990 and Elliot & Harackiewicz 1994). This lack of strength in belief can stem from two sources: first it could be that women simply have a higher variance in their beliefs about their ability, so are simply less certain. This higher level of uncertainty may be exacerbated when it comes to harder tasks (see also Dweck 2000). Second it seems that women compared to men seem to attribute positive outcomes, in this case a high initial performance which would indicate a high performance level, more to luck than actual underlying ability. This could simply be driven by the fact that women have lower expectations about their performance. In the psychology literature, Deaux (1984) argued that performance that is consistent with expectations leads to attributions to stable causes (e.g. ability), whereas performances that are inconsistent with expectations lead to attributions to unstable
causes (e.g. luck).6 Hence women may view a high initial performance as less indicative of a high performance level than men (and potentially the other way round for a low initial performance).
Our experiment is designed to shed light on the role played by these alternative explanations. Specifically, we want to investigate whether choices of task difficulty of women and men can largely be explained by the characteristics of the tasks (hypotheses 1 and 2). In that case, gender differences in choices may not pose a great concern, and there may not be a strong urge to investigate changes in institutions that affect the choices of women and men, and align them with money-maximizing choices. If, however, gender differences in confidence or risk aversion (hypotheses 3 and 4) drive the gender gap in challenging tasks, then changes in the institutions may help both women and men to move towards money-maximizing choices. Our goal is therefore to both evaluate the importance of alternative hypotheses and provide institutional changes that affect the choices of women and men.
III. THE EXPERIMENT
We establish an environment in which we can evaluate the choices of men and women concerning the difficulty level of the task which they perform. We use a task that is available in two difficulty levels, and in which high and low performing participants receive higher earnings from the hard and easy task respectively. A high correlation in performance among these two tasks allows us to (i) identify the performance level (high or low) of participants after they performed in only one (the easy) task, and use that to (ii) predict the participants’ money-maximizing choice. This allows us to address whether choices of task difficulty are driven by actual performance levels. We are interested in whether women choose the hard and challenging task more or less often than men. Furthermore, we want to assess whether men and women with the same performance differ in their choices, and why. This makes it crucial to have an environment in which we can predict money-maximizing choices for each participant. The tasks we use are
6
From the psychology literature (see also e.g. Beyer 1990) it is however not clear whether this is true above and beyond differences that would be observed due to Bayesian updating.
mazes to be solved on paper. Mazes are either “Easy” mazes or “Hard” mazes.7 In each treatment, we have three rounds of performance in which participants have 10 minutes to solve as many mazes as they can.8 If participants, when marking their way through the maze, made a mistake, they could cross out the portion that was incorrect and continue again from the point where they had gone wrong. (An example was included in the instructions.) Participants could skip up to three mazes (which they had to cross out with an X) during the 10-minute period. They were paid only for entirely solved mazes in which they did not cross any of the maze boundary lines.
We conducted the experiment at Stanford University with 308 students, 151 men and 157 women, where everyone participated only once.9 The experiment lasted just under an hour. Subjects participated in the experiment in groups with an average size of ten. Overall, we conducted 30 sessions. Participants received $5 as a show up fee, and average earnings were $14.23 including the show up fee.
Participants could ask questions at the start of each of the three tasks and raise their hands for questions during the 10 minute performance, but they were not allowed to talk to one another for the duration of the experiment. Each 10-minute segment was timed, and participants were told when they had five minutes left, one minute left, and when time was up. The general design of all four treatments is the following:
Task 1: Easy Mazes: Participants solve “Easy” mazes for 10 minutes, and receive $0.25 per completed maze. At the end of the task, participants can count the number of mazes they completed.
We will show that the performance on task 1 is a very good predictor of whether a participant has higher expected earnings from the easy or the hard task. We therefore know for each participant their predicted money-maximizing choice of difficulty level.
7
The mazes were printed from http://games.yahoo.com/games/kidsmz.html. “Easy” mazes were the easiest mazes offered and “Hard” mazes were the hardest offered. These mazes have first been used in Gneezy, Niederle and Rustichini (2003).
8
Participants received 30 mazes (one per page) for Easy mazes, and 15 for Hard mazes. Only two participants who both solved Hard mazes raised their hand to ask for more mazes.
9
Gender was not emphasized during recruitment nor mentioned during the experiment. Participants ranged in age from 18 to 23 years old, and all were university students.
While all participants are paid for task 1, they are paid for only either task 2 or task 3. The task for which they are paid is randomly determined at the end of the experiment by a coin flip. This reduces the possibility of using the decision and performance of task 3 to hedge against the decision and outcome of the preceding task 2.
There are two versions of task 2 and task 3, easy and hard. Whenever participants choose the difficulty level of mazes to complete in tasks 2 and 3, they have at their disposal two sample mazes: one easy maze and one hard maze. Furthermore, they are told that, based on previous performances in the experiment, participants whose initial task 1 performance is in the top 40% of all participants are more likely to achieve higher monetary earnings from hard mazes, while others from easy mazes. We will see that this is indeed the result of treatment 1, the first treatment we ran, and therefore is a true statement at the time we make the statement. However, in general participants only know their absolute performance, but not whether it was in the top 40%. Participants had one minute to make the decision, that is, they could not actually experience completing a difficult maze before selecting their level(s) of difficulty.
Task 2 and Task 3: Easy Mazes: Participants solve “Easy” mazes for 10 minutes. If the task is selected for payment, they receive $0.50 per maze. At the end of the task, participants can count the number of mazes they completed.
Task 2 and Task 3: Hard Mazes: Participants solve “Hard” mazes for 10 minutes. If the task is selected for payment, they receive $0.25 per maze for the first four mazes, and $3.50 for each maze completed past the fourth. At the end of the task, participants can count the number of mazes they completed.
Hard mazes are more difficult to solve than easy mazes, as they are more complex, and by introducing a kinked payment scheme we made it even more difficult to receive high earnings from hard mazes.
While the structure in terms of remuneration for each task difficulty is the same in each treatment, there are differences in whether and how participants decide upon the task
difficulty, and whether they receive feedback about their performance before their choice of task difficulty.
Treatment 1: Benchmark Treatment: Participants, after performing in task 1, cannot choose the difficulty levels for tasks 2 and 3; they perform the easy task 2 and the hard task 3. At the end of the experiment, we ask each participant to guess how their performance in task 1 compared to past participants (in performance quartiles), with 1 being among the top 25% and 4 indicating a performance in the bottom 25%. Participants received an additional $1 if they were correct.
The performances of women and men in tasks 2 and 3 will serve as a benchmark of potential earnings under each task difficulty for a given task 1 performance. The results of this treatment also confirm the calibration of high and low performance levels. A task 1 performance of 11 or more results in higher earnings from the subsequent hard than the easy task (and hence indicates a high performance level), while a task 1 performance of 10 or less indicates a low performance level (i.e. earnings from the subsequent easy task are higher compared to those in the hard task). Finally, the question on beliefs will allow us to see whether hypothesis 3 can account for gender differences in task choice.
Treatment 2: Choice (with Commitment): Participants, after task 1, have to decide at once the difficulty levels for both task 2 and task 3, namely easy or hard. That is, participants can choose among four possibilities: easy-easy, easy-hard, hard-easy, and hard-hard. Participants are reminded that they make their decision for the next two rounds and will be unable to change their decisions after completing task 2.
Treatment 2 will establish whether, for a given task 1 performance, women and men differ in their choices of task difficulty. We only pay either task 2 or task 3 to reduce incentives for participants to hedge and choose a mixture of task difficulty.
To understand the role of explanation 1 – gender differences in preferences for hard tasks per se – and see whether it can account for the gender gap in choices of challenging tasks,
we change the environment such that explanations 2, 3 and 4 (that is gender differences in feedback aversion, confidence, and risk aversion and certainty respectively) are not relevant. We achieve this in the next treatment by providing participants with perfect feedback, that is, any uncertainty about their performance level, or any aversion (or preference for) receiving feedback about their relative performance has no impact on the decision of task difficulty.
Treatment 3: Feedback: In addition to all statements made in the choice treatment, participants in the feedback treatment are told that based on previous participants, those completing 11 or more easy mazes in task 1 were in the top 40% of performers, while those completing 10 or fewer mazes in task 1 were not. This gave participants feedback on their performance level. They too had to decide on the difficulty level for the next two tasks at once.10
For the last treatment (Treatment 4), we have two objectives. The first is to assess the role of feedback aversion versus risk aversion and certainty, that is, we want to tease apart explanations 2 and 4. Specifically, we try to assess whether gender differences in choices are driven by large gender differences in feedback aversion. A second objective stems from the possibility that task choices may not reflect preferences that pertain to the underlying characteristics of the task (in terms of both the actual task, and the amount of feedback the task provides). Differences in task choice may rather be driven by the fact that women are less certain about their capacity to perform in the hard task, or more risk averse than men. We aim to find a simple change in the institution that would allow women and men to improve the quality of their choices.
While providing feedback is an institution that helped both women and men, there are some drawbacks: A first, practical concern is that it may often not be possible to provide perfect feedback. Rarely may there be such a good predictor on how women and men would perform on the next, more difficult level. Furthermore, in this experiment, participants took that “perfect test” (i.e. their performance in the first easy task) without
10
We ran this treatment last, to minimize the risk of information leaking to other participants about the cutoff performance that determines the performance level and higher expected earnings from the hard task.
knowing what it was, and results may be different in case they were aware that they were taking a test that is predictive of their underlying abilities. Indeed, Claude Steele in a series of papers shows that the performance of minorities, who may suffer from a stereotype that they should not perform so well, differs in a test described as predictive of abilities rather than simply a difficult random test (Steele 1997, Steele and Aaronson 1995, and Spencer, Steele & Quinn 1999). This may especially be the case if women are feedback averse, and employ some self-handicapping techniques (Keller 2002). We therefore opt for an institutional change that may be feasible to implement, while still possibly having a large impact on participants’ choices.
Treatment 4: Choice with Reduced Commitment: The instructions are similar to those in the choice treatment. However, participants now do not choose the task difficulty level for both tasks 2 and 3 at once. Rather, participants choose a difficulty level for task 2, and only after they performed do they choose the difficulty level for task 3.
A simple analysis confirms that a participant who is uncertain about her ability may choose the easy task twice in the choice (with commitment) case, but choose a first hard task in the choice with reduced commitment treatment.11 In the treatment with reduced commitment, choosing the hard mazes in task 2 gives the additional benefit of providing feedback and information about which task leads to higher earnings for the third choice. Therefore choosing the hard task has an additional value than simply the expected earnings from performing in the hard task. This additional value is not present in the choice treatment (treatment 2). That is, if gender differences in hard task choices are driven by uncertainty, then they may be reduced by this institutional change. However, if
11
For a very simple stylized model, let p be the probability with which a participant believes that the performance is in the top 40%. Let x be the expected payoff from choosing the easy task. If the participant chooses the hard task, the monetary earnings are x+y if the participant is actually of high performance, and
x-y otherwise. Furthermore, assume that a choice of the hard task reveals the participants type (high or low performing) perfectly, while the easy task provides no further information, since a participant already knows how they perform in the easy task. A participant that makes a once and for all decision about the task difficulty prefers the hard task iff pu(x+y)+(1-p)u(x-y) ≥ u(x) that is iff p ≥
[u(x)-u(x-y)]/[u(x+y)-u(x-y)]. In case the participant decides for a first task, and then a second task based on the information received from the first task, the participant prefers the first task to be the hard iff p2u(x+y)+(1-p)[u(x-y)+u(x)] ≥
2u(x), that is p ≥ [u(x)-u(x-y)]/[2u(x+y)-u(x)-u(x-y)]. This second boundary for p is strictly lower than the former one if u(x+y) > u(x).
choices are largely driven by preferences for feedback, then the choices should be similar to those in treatment 2.12
IV. THE BENCHMARK TREATMENT
IV.A. PerformanceThe goal of this treatment is to verify that we have an environment with a correlation in performance (and earnings) between the easy and hard task such that we can group performances of participants into high and low level performances using the easy task 1 performance. Furthermore, low performing participants (should) have higher earnings from subsequent easy tasks relative to hard tasks, while high performing participants from hard tasks. In this treatment, we observed the performances of 32 women and 30 men.
In task 1, the first round of easy mazes, men solve on average 10.03 mazes (with a standard deviation of 2.98), while women solve 9.25 mazes (s.d. of 2.86). There is no significant gender difference in performance; a two-sided Mann-Whitney test comparing the performance distributions of the 30 men to the 32 women yields p = 0.37.13 Table I shows the number of easy mazes completed by men and women in task 1 (roughly by performance quartiles).
Table I
8- 9,10 11,12 13+
Men 10 6 8 6
Women 15 5 6 5
Task 1 performances of 32 women and 30 men in the Benchmark treatment. In task 2, the second round of easy mazes, men solve on average 12.4 (s.d. 3.89) mazes, while women solve 11.4 (s.d. 3.05). The difference is not significant, a two-sided Mann Whitney test yields p = 0.44. Both genders significantly increase their performance by about 2.2 (in each case a one sided t-test yields p-values less than 0.01).14
In task 3, in which participants completed hard mazes, men solve on average 5.4 mazes (s.d. 1.75), while women solve 4.6 (s.d. 1.72). This difference is on the verge of
12
If the difference in cost of receiving information about one’s performance level between women and men is very small, then the simple change to sequential choice may overcome this difference as well.
13
Two-sided t-test yield similar results unless otherwise noted. 14
There is no significant gender difference in the increase in performance, a Mann Whitney test yields p = 0.89.
being significant: A two-sided Mann Whitney test yields p = 0.108, a two-sided t-test yields p = 0.08.
The performance of participants exhibits a strong correlation. Spearman rank correlations are of the order of 0.8 (comparing task 1 performance to either task 2 or task 3 performance, for both men and women), with p-values less than 0.01 when testing for independence.
TABLE II
Average earnings in $ from the easy (E2) and hard (H3) task for each number of easy mazes completed in task 1 (E1).
E1 E2 Payoff Male E2 Payoff Female H3 Payoff Male H3 Payoff Female H3 – E2 Payoff H3 – E2 Male H3 – E2 Female 3 - (3) - 3 - (0.75) - 0.75 -2.25 -- -2.25 4 - (3.13) - - (4) - - (0.69) - - (0.63) - -- -- -- 5 3.25 5 0.63 0.5 -3.28 -2.63 -4.50 6 3.67 4 0.92 0.5 -3.05 -2.75 -3.50 7 5 5.14 4.5 1.82 -4.13 -0.50 -3.32 8 5.17 4.5 2 2.63 -3.83 -3.17 -1.88 9 5.25 5.25 2.75 1.88 -3.20 -2.50 -3.38 10 6.88 6 4.5 4.5 -2.20 -2.38 -1.50 11 6.33 6.33 10.33 9.17 3.40 4 2.83 12 7 7.17 10.1 9.17 2.70 3.10 2 13 8 7.25 11.5 9.75 2.90 3.50 2.50 14 8.5 8.25 11.5 8 0.70 3 -0.25 15 8.5 - (8.5) - 11.5 - (11.5) - 3 3 -- 16 9.5 - (9.5) - 15 - (15) - 5.50 5.50 --
In parentheses are values that are obtained through interpolation, or by using the outcome of the other gender.
Table II summarizes the average earnings of participants from the easy and hard mazes they completed in tasks 2 and 3 respectively, grouped by the number of easy mazes completed in task 1. The rows in bold indicate levels at which participants had higher earnings from the hard than the easy mazes. This group consists approximately of the top 40% (26/62) of all participants, those who completed 11 or more mazes in task 1. In fact, of the 62 participants in the benchmark treatment, 61 follow the pattern that a task 1 performance of 11 or more results in higher future earnings from a hard rather than an easy task, while it is the other way round for participants who solve 10 or less mazes in
task 1.15 While women differed somewhat from men in their performance in the hard task, the last two columns show that nonetheless women follow the same earnings pattern as men. Table II also shows the average difference in payoffs between the hard and easy task.
We will use these results in further treatments, to provide a crude estimate for the expected earnings in an easy and a hard task conditional on the participants’ task 1 performance. That is, we will assume that a male participant, who solved, say, 12 easy mazes in task 1, would earn $7 when choosing easy mazes and $10.1 when choosing hard mazes in tasks 2 and 3.
Note that the earnings difference between the hard and the easy task is dependent only on whether the participant is of a high or low performance level, but not on the actual task 1 performance within each category. Specifically, a linear regression on the earnings difference across tasks as a function of task 1 performance yields coefficients not significantly different from zero, for both high and low performing participants separately, and for both genders joint or separately.16 That is, e.g. each high performance level participant who chooses the easy task has the same expected monetary losses, independent of their task 1 performance (as long as it is 11 or higher, and hence corresponds to high performance).
IV.B:Confidence
While women and men have similar performances, and we prescribe the same choice of task difficulty for any given task 1 performance to maximize the participant’s earnings, it could be that women and men hold different beliefs about their relative task 1 performance. This in turn could account for possible gender differences in choice of task difficulty (see hypothesis 3). To measure their beliefs, participants guessed at the end of
15
Only one participant, a woman, completed 14 easy mazes in Task 1, 18 easy mazes in Task 2, and 5 hard mazes in Task 3, meaning that she actually would have earned more money with the easy mazes ($9) than the hard mazes ($4.50), which is opposite to the pattern exhibited by all other participants.
16
A regression of the earnings difference between task 2 and task 3 yields a constant of 3.36 (p = 0.02) and a coefficient on the task 1 performance of -0.09 (p = 0.62) for the 36 low performing men and women. For the 20 women only, the coefficients are 4 (p = 0.02) and -0.14 (p = 0.50), and for the 16 men they are 2.35 (p = 0.33) and 0.01 (p = 0.98) respectively. Similarly, for all 26 high performing participants, the coefficients are -3.88 (p = 0.54) and 0.08 (p = 0.87), while for the 12 women they are -11.13 (p = 0.33) and 0.74 (p = 0.41) and for the 14 men they are -1.94 (p = 0.81) and -0.13 (p = 0.84).
the experiment how their performance compared to past participants’ performances (in performance quartiles), with 1 being among the top 25% and 4 indicating a performance in the bottom 25%.17
TABLE III
Guessed rank of Women and Men in the benchmark Treatment
Guess Men Women
Quartile Optimal Guess Wrong Optimal Guess Wrong
1 (top) 11 8 3 9 8 4
2 7 11 6 4 14 9
3 5 9 6 8 7 4
4 (bottom) 7 1 1 11 3 1
Total 30 29 16 32 32 18
Table III shows for women and men the optimal guess, that is, the most optimistic possible guessed performance quartile that is correct given their performance, their guessed relative performance, and the number of wrong guesses.18 There is no gender difference in the distribution of guesses, a Fisher’s exact test yields a p-value of 0.72.19 Furthermore, an ordered probit regression shows that the believed relative performance is correlated with performance for both men and women without any significant gender difference.20
Given the results of the subsequent treatments, and the beliefs we showed so far, we wanted to further study whether participants have strong beliefs about the relative abilities of women and men. We therefore asked the last 66 participants that participated in our experiment (in the feedback treatment) whether among the first 200 participants, they thought there were more women or men were among those who solved 11 easy mazes in task 1, and hence had a high performance level. In total 22/66 (33%) guessed that men had done better, while 44/66 thought women had done better.21
17
One man did not fill out this questionnaire properly and is hence absent from our data. 18
The optimal guesses (and whether a guess is right or not) have been calculated given the entire sample, which is not necessarily what participants were paid for, as they were paid based on the sample up to their session. We recalculate optimal guesses to have comparability across all participants within that treatment. 19
Men and women do not differ in their optimal guesses, a Fisher’s exact test yields p = 0.50. 20
An ordered probit regression on the guessed rank as a function of performance yields coefficients of -0.3 (p = 0.00) for 28 men and -0.21 (p = 0.02) for 29 women. Furthermore, a combined ordered probit regression on guessed ranks yields coefficients -0.25 (p = 0.00) on task 1 performance, and 0.18 (p = 0.55) on a male dummy (for 57 women and men with a guessed rank of 1 to 3). Similar results are obtained when we include all guesses, or code guesses of the third and fourth quartile into one category.
21
In fact, among the first 200 participants, 46 women and 34 men completed more than 11 easy mazes in Task 1. Each participant who guessed correct, namely women, received $1 for guessing correctly.
To summarize, we found a task in which the performance in the first, easy task predicts the participants’ performance level, high or low. Approximately the top 40% of performers in the first easy task, all those who solve 11 or more mazes, have a high performance level. Furthermore, the performance level predicts whether earnings are maximized with a subsequent hard task (for high performing participants) or a subsequent easy task (for low performing participants). Finally, there is no gender difference in performance in the first easy task, or in the classification into high or low performance levels.22 Therefore, for both women and men, the following is a true statement: “Based on all the people who have previously participated in this experiment, if you perform in the top 40% of all people completing mazes, you are likely to make more money by selecting the Hard mazes, while if you are not in the top 40% of participants, you are likely to make more money by selecting the Easy mazes.”
Participants also do not exhibit any gender difference in beliefs about their relative performance in the first easy task. We also found no evidence of any overall belief that men have a higher chance to have a first task performance indicative of a high performance level. That is, any gender difference in choices of challenging tasks is probably not driven by gender differences in beliefs about relative performance in task 1. Therefore, hypothesis 3 does not seem to have much explanatory power in this environment.
V. CHOOSING THE HARD TASK
In this second treatment, we evaluate whether men and women differ in their propensity to choose the hard (and easy) task. In the choice (with commitment) treatment, participants, after performing in task 1, simultaneously choose the difficulty levels of task 2 and task 3. Only one of the two tasks is randomly selected for payment at the end of the experiment. Before choosing the difficulty levels, participants are informed that the top 40% performers in the first task have on average higher earnings from choosing the hard task, the others from choosing the easy task.23 While participants know their absolute task
22
Among all 308 participants, 118 (38%) have a task 1 performance of 11 or higher. Among the 159 women, there are 64 (40.2%) high performing participants, and among the 149 men there are 54 (36.2%). 23
Given that only either task 2 or task 3 is reimbursed, there is no room for participants to use a mixed choice Easy-Hard or Hard-Easy as a means of insurance.
1 performance, they are not informed of their relative performance level. We have 42 women and 43 men.
V.A:Task 1 Performance
In task 1, men solve on average 9.81 (s.d. 2.61) mazes, while women solve 10.19 (s.d. 2.39) mazes. The difference is not significant (a two-sided Mann-Whitney test delivers p = 0.17), though the proportion of high performing women is significantly higher than that of high performing men (though this is not true in the total sample, see footnote 19).24 Table IV shows the number of easy mazes completed by men and women in task 1.
Table IV
8- 9,10 11,12 13+
Men 13 19 5 6
Women 10 9 18 5
Task 1 performances of 42 women and 43 men in the Choice treatment V.B:Choosing the Hard Task
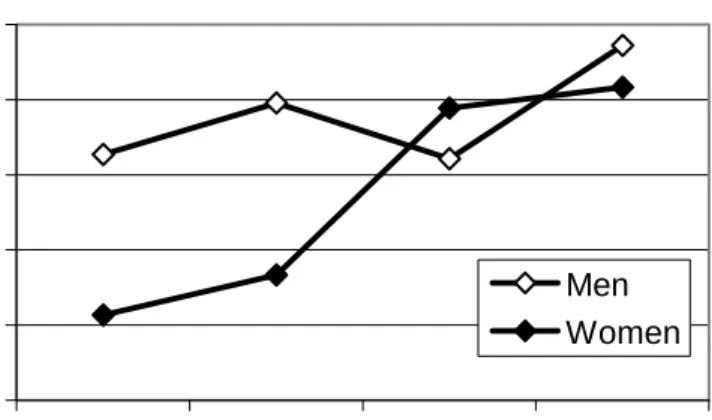
Results from the benchmark treatment predict that all participants who solve 11 or more mazes in the first task (which corresponds to roughly 40% of all participants) have higher earnings by choosing hard mazes, while others should choose the easy task. Given the performance in task 1, we expect 23/42 women (54.8%) and 11/43 men (25.6%) to choose the hard task. We find that 90.7% of men make at least one hard choice, compared to 61.9% of women, a significant difference (a two-sided Fisher exact test delivers p = 0.00). Similarly, 58.1 % of men make all hard choices compared to 38.1% of women (a two-sided Fisher exact test delivers p = 0.08 ).25 Figure I shows for various task 1 performances the proportion of hard choices in tasks 2 and 3 for women and men separately.26
24
Furthermore, there is no difference in task 1 performance between treatment 1 and 2, as a whole or for each gender separately.
25
There are 10 women and 14 men who choose two different tasks. While it is unclear why they made these choices, any tendency for probability matching would lead participants to diversify (for a review on the probability matching literature see e.g. Vulkan 2000).
26
A participant who chooses the hard task for both tasks makes 100% hard choices, while one who chooses one hard and one easy task has only 50% hard choices.
0 0.2 0.4 0.6 0.8 1 8 - 9, 10 11, 12 13 + Men Women FIGURE I
For various task 1 performances, the proportion of hard choices of the 42 women and 43 men in the choice treatment.
To estimate the impact of the performance level on choices we code the variable choice as 0 for a choice of Easy-Easy; 1 for a choice of either Easy-Hard or Hard-Easy; and 2 for a choice of Hard-Hard. Furthermore, we use a dummy variable, high, that is 1 for participants of a high performance level and is 0 otherwise.
TABLE V
Ordered probit of the hard task choice as a function of the performance level and gender Men Women All 1 All 2 E1<11 E1>10
High 0.62 (0.16) 0.38 (0.29) 0.47 (0.09) 0.40 (0.25) Male 0.84 (0.00) 0.79 (0.02) 0.82 (0.01) 0.99 (0.06) High*Male 0.16 (0.77) N 43 42 85 85 51 34
Coefficient and p-values
The results in table V show that neither the choices of women nor of men are highly dependent on their performance level. However, there is a significant gender difference in choosing the hard task, even when we control for performance levels. Gender differences in choices are significant for both performance levels. In all cases, men choose the hard task more often than women do. When we use the actual task 1 performance, e1, instead of a high performance dummy, the results are very similar. 27
27
The only difference is that the men’s decisions to choose the hard task depend on their task 1 performance, and more so than the decisions of women, which do not respond to the task 1 performance. The result seems to be driven by the very high performing men, who all select the challenging task. The
Table VI shows the proportion of participants who chose at least one hard task and then the proportion of hard choices. It confirms that, whichever measure is chosen, men choose the hard task significantly more often.28 Among both high and low performing participants, men choose the hard task about 30% to 60% more often than women.
TABLE VI
Proportion of Hard Choices
At least 1 hard choice Percent of hard choices All 9 - 10 - 11 + 12 + All 9 - 10 - 11 + 12 +
Men 90.7 88 87.5 100 100 74.4 70 70 86 93.8
Women 61.9 56.2 58 65 41.7 50 40.6 42 57 37.5
Fisher exact 0.00 0.03 0.04 0.03 0.02
Compared to predicted money-maximizing choices, low performing men choose the hard task too often, while high performing women do not choose the hard task often enough. In fact, men always choose the hard task more often than women, which means men and women differ in how their choices do not conform to predicted money-maximizing choices.
Before we try to understand the underlying causes of this behavior, we want to confirm that the choices of women and men do not reflect some unobserved private information about their performances in easy and hard tasks.
V.C: Economic Consequences of Choices
We estimate the effect of choices on monetary payments and seek to confirm that high performing participants (i.e. e1>10) receive, on average, higher earnings when
regression for men yields a task 1 performance coefficient of 0.25 (p = 0.02). In the All 1 regression the coefficient on task 1 is 0.09 (p = 0.105), the coefficient on male is 0.75 (p = 0.00). In the All 2 regression, the coefficients are 0.00 (p = 1.00) on task 1, -1.41 (p = 0.25) on male and 0.23 (p = 0.08) on the task 1 * male interaction. We obtain virtually the same results when we consider only the decision of the second or only of the third task.
28
When we condition on either only the first choice, or only the second choice, gender differences in choice of task difficulty are significant for low performing participants, those solving 10 or fewer mazes in task 1. For high performing participants differences are only marginally significant, though they are significant at conventional levels for participants who solve 12 or more mazes in task 1. Fisher exact tests for each decision separately reveal a significant gender difference of 0.07 or less for the choice in both task 2 and task 3 for participants with a task 1 performance of 10 or less and 12 or more. In the case of 11 and more, the p-values for task 2 and task 3 choice are 0.11 and 0.14 respectively. For performances of 9 and less, the p-values are 0.05 and 0.12 respectively.
selecting the hard task, while others from the easy task. That is, we want to confirm that the observed non-conforming choices of participants do not reflect performances that deviate from the pattern we found in the benchmark treatment.
Table VIIA shows the mean difference between the earnings for the chosen task and the average earnings for the not chosen task (as predicted by the benchmark treatment). Because women and men perform somewhat differently, for each participant, we use the earnings that relate to their gender. We then average across all participants. The table shows means, standard errors in parentheses and finally the p-value of the one sided t-test.29 For 7 of the 8 cases we find significantly higher earnings for the task that conforms with the prescribed choice and significantly lower earnings for the opposite task. The only exception is in the case of low performing participants who chose the hard task in task 3 instead of the easy task, where the difference, while negative, is not significant. Therefore, we find as predicted that, compared to earnings estimates based on the benchmark treatment, almost all participants who choose the task that does not conform to their performance level incur significant losses, in the order of 15 to 20% of their total earnings for the experiment. That is, it does not seem that participants who choose the alternate task difficulty are especially good at performing at this level, compared to the average participant in the benchmark treatment. Similarly, participants have significant gains from choosing the task that corresponds to the prescription based on the benchmark treatment.
To check that the selection into task difficulties is not due to extraordinary performance patterns, we can also compare the performance of participants who choose a specific difficulty level to the performance of participants who were assigned that difficulty level in the benchmark treatment. In all eight cases of Table VIIA, apart from low performing participants who choose the hard task in task 3, we find that the performance of participants is not significantly different from those that were assigned the chosen difficulty level in the benchmark treatment.30
29
We restrict attention to performances between 3 and 16, because there we have data from the benchmark treatment.
30
The differences in earnings between participants who chose a difficulty level, and those of the participants in the benchmark treatment who were assigned that difficulty level, are in five instances less than 0.40 (with one-sided p-values of t-tests of 0.24 and higher). Among high performing participants who choose the hard task, the differences are not significant, though higher in magnitude (for task 2: 1.05 (s.e.
TABLE VIIA
Task 2 Task 3
2<e1<11 10<e1<17 2<e1<11 10<e1<17 Chose Easy Actual-Hard 2.43 (0.39) 0.00 -2.72 (0.21) 0.00 2.93 (0.38) 0.00 -2.59 (0.44) 0.00 Chose Hard Actual-Easy -2.42 (0.46) 0.00 3.96 (1.37) 0.00 -0.68 (0.78) 0.19 2.22 (0.85) 0.01 N 18 / 33 10 / 23 23 / 28 13 / 20
The tables show means, standard errors in parenthesis and finally the p-value of the one sided t-test. The number of observations N1/N2 is read as N1 observations for the top cell and N2 for the lower cell in each column.
One possibility why women and men may overall gain from choosing the non-prescribed task difficulty is that there could be large learning effects when performing in the same task twice. For example, it could be that low performing participants who choose the hard task twice have such a high performance the second time they perform that, in expectation, it outweighs the losses from the first performance, even if only one of the two tasks is payoff relevant. Note that this additional learning possibility was not present in the benchmark treatment, as task 2 and task 3 were of different task difficulty.
TABLE VIIB
Women Men Task 2 & 3 Task 2 & 3
2<e1<11 10<e1<17 2<e1<11 10<e1<17 Chose Easy-Easy Actual-2*Hard 6.34 (1.04) 0.00 -4.80 (0.46) 0.00 5.14 (2.00) 0.04 --- Chose Hard-Hard Actual-2*Easy -2.06 (3.97) 0.32 3.76 (2.08) 0.05 -2.46 (1.43) 0.05 14.55 (2.14) 0.00 N 8 / 5 8 / 11 4 / 17 -- / 7
The tables show means, standard errors in parenthesis and finally the p -value of the one sided t-test. The number of observations N1/N2 is read as N1 observations for the top cell and N2 observations for the lower cell in each column.
1.37, p = 0.45) for the one sided t-test, and for task 3 -0.64 (s.e. 0.79, p = 0.43); that is, high performing participants in the choice treatment who choose the hard task for task 2 earn on average one dollar more than high performing participants in the benchmark treatment, though they earn 0.64 dollar less in task 3). Low performing participants in the choice treatment who choose the hard task in task 3 earn on average $1.74 more than low performing participants in the hard task in the benchmark treatment, a difference that is significant (s.e. 0.84, p = 0.05 of the one sided t-test).
To account for this possibility, table VIIB shows the average difference of actual earnings to the predicted earnings for the alternate task for participants who choose the same task twice, for women and men separately. We find for all participants that choosing the same task twice does not change the predicted earnings pattern. In all cases (apart from one) we estimate that participants receive significant gains from choosing the task corresponding to the performance level, and significant losses from choosing the alternate task. The exception consists of low performing women who choose the hard task twice. While they incur losses, they are not significant, but there are only 5 such women.31
We have a final test to address whether non-confirming choices are driven by unusual performance patterns. We want to show that the choice of the hard task for low performing men and the choice of the easy task for high performing women do not result in higher earnings than those from the prescribed difficulty level. We can compare earnings across tasks of participants who choose two different difficulty levels. Low performing women and men who choose two different difficulty levels earn significantly more from the easy than the hard task (on average 2.97, with a standard error of 0.48 and a p-value of a one sided t-test of 0.00).32 High ability women who choose the hard and the easy task (n = 4) make on average 1.38 more from the hard task (s.e. 4.09, p = 0.38).33 Therefore, we found a task in which women and men perform equally well and have similar beliefs about their relative performance (that is, explanation 3 seems not to be relevant in this environment for our results). Nonetheless, when simultaneously choosing the task difficulty for the next two tasks, men choose the hard task significantly more often than women, for each performance level. Compared to predicted money-maximizing choices, high performing women do not choose the hard task often enough,
31
Of these five women are 4 who have losses compared to the expected earnings delivered by the benchmark treatment.
32
For the 11 men only, the numbers are 3.07; s.e. 0.56; p = 0.00; for the 6 women only they are 2.79, s.e. 0.95, p = 0.02.
33
The only group that does not follow the predicted pattern are high performing men. Those who choose the hard task and the easy task (n = 3) lose 4.16 from the hard task. Indeed, every one of the three men who have an e1 performance of 11, 11 and 12 respectively and choose once the hard and once the easy task make losses from the hard task, with a payoff difference of 3, 2.5 and 7. However, the sample is very small and in general high performing men choose the hard task a lot, and on average have very high earnings from the hard task. The choices of men that require an explanation are rather the low performing men who choose the hard task (not the few high performing men who choose sometimes an easy task).
while low performing men choose it too much. Furthermore, we provided evidence that the choices that do not follow the prescribed pattern result in monetary losses, often significant (about 15 to 20% of total earnings) and do not seem to reflect private information about unusual performance patterns.
This finding is very much in the spirit of the findings in the literature on gender differences in entering competitive environments (see Niederle and Vesterlund, 2007), even though in this case, the choices are between more and less challenging tasks, as opposed to a choice of a competitive or non-competitive incentive scheme (see the conclusions for a general review of the literature).
VI. GENDER DIFFERENCES IN PREFERENCES OVER TASKS?
There are several reasons why women and men may choose different difficulty levels of the task which they perform, even in an environment in which there is no gender difference in performance or in beliefs about relative performance.
A first possibility is that women and men may simply have different preferences concerning the characteristics of the task which they want to perform (hypothesis 1). That is, participants may not only maximize monetary earnings, but derive some (dis)utility from performing in specific tasks. Specifically, women may have a cost of solving harder mazes, while men may get a kick out of it. In this case, the different choices of men and women may not pose a serious reason for concern for their welfare (as long as task choices are not used for some later purpose, or have different educational value). There is no small change in the institution that would affect the choices of women and men if they reflect their underlying strong preferences for various tasks. Therefore, we want to address the importance of preferences for performing different tasks in accounting for gender differences in the choice treatment.
Note however that our participant pool consists of Stanford undergraduate students, and hence finding that women prefer easy over hard tasks would be quite devastating in terms of trying to promote and engage high performing women in difficult tasks. Similarly, of course, we want to show that men do not simply try the hard task, no matter how low their performance level actually is.
VI.A.Design of the Feedback Treatment
The feedback treatment is designed such that in this environment gender differences in choice reflect gender differences in preferences for the hard and easy task per se. To achieve this we eliminate other possible explanations for choices of task difficulty by providing participants with feedback about their relative performance, telling them their performance level and hence which task maximizes their future earnings. In the former choice treatment, before choosing the difficulty level for tasks 2 and 3, participants were informed that high performing participants on average received higher earnings from the hard task, while others from the easy task. In the feedback treatment, participants are additionally informed of which task 1 performances are among the top 40% performances, and hence represent a high performance level (namely 11 or more).
By providing participants with this feedback, gender differences in choices of task difficulty cannot be due to (possible) gender differences in feedback aversion (hypothesis 2), gender differences in beliefs about relative performance (hypothesis 3) or gender differences in risk aversion and certainty (hypothesis 4). If choices conform to the recommendation then there does not seem to be strong preference for the other task.34 We have 47 women and 35 men in the feedback treatment.
Men completed on average 10.29 (s.d. 2.79) easy mazes in task 1, while women completed 8.70 easy mazes (s.d. 2.83). Unlike in the two previous groups, we find that this difference is significant, with men performing significantly better than women do (a Mann Whitney test yields p = 0.02).35 However, the proportion of high performing men is not significantly different than that of high performing women (p = 0.22 of a two-sided Fisher exact test).
34
While the converse seems also reasonable, that non-conforming choices reflect a preference for the other task per se, there is an additional reason for such behavior: Some participants may believe that their task 1 performance is not indicative of their performance level. For example a participant could think to have a better than average ability to improve on first round performance, and therefore would “beat the odds” in the next rounds.
35
From the data it appears that this significant difference was substantially caused by the extremely low performance of 5 women out of the total 47, all of whom completed 5 or fewer easy mazes in Task 1. Overall, across all four treatments, we had 9 women perform at 5 or lower, more than half of which are in this treatment. Furthermore, overall, there is no significant gender difference in task 1 performance. The average performance of men is 10.11 compared to 9.60 for women, a Mann Whitney test yields p = 0.41 and a two-sided t-test yields p = 0.13.
Table VIII
8- 9,10 11,12 13+
Men 9 13 7 6
Women 20 16 8 3
Task 1 performances of 47 women and 35 men in the Feedback treatment. VI.B:Hard Choices after Feedback
Figure II shows the proportion of hard choices for various task 1 performances, for women and men separately. After receiving feedback, women and men basically choose the hard task when they are in the top 40% (a performance of 11 and more), and the easy task otherwise. There are no significant gender differences in task choice. An ordered probit regression of task choice yields a high performance level dummy coefficient of 2.26 (p = 0.00) and a male coefficient of 0.14 (p = 0.63).36
0 0.2 0.4 0.6 0.8 1 8 - 9, 10 11, 12 13 + Men W omen FIGURE II
Proportion of hard choices of women and men in the feedback treatment.
Table IX shows the proportion of hard task choices given task 1 performances. There are no gender differences either in the proportion of participants who choose the hard task at least once or in the proportion of overall hard task choices.
When participants choose the task difficulty level after having received information about their relative performance, men and women do not make different choices, and their choices of task difficulty largely correspond to money-maximizing
36
An ordered probit regression shows that for women the high performance level dummy is a significant predictor of a hard task choice, the coefficient is 1.85 (p = 0.00). We cannot run the same regression for men, as all high performing men choose the hard task twice, so, there is no variation.
choices. That is, it does not appear that gender differences in choice of difficulty level are driven by large gender differences in preferences for performing in the hard or easy task per se.
TABLE IX
Proportion at least 1 Hard Choice Proportion of Hard choices All 9 - 10 - 11 + 12 + All 9 - 10 - 11 + 12 +
Men 57.1 28.6 31.8 100 100 52.9 21.4 25 100 100
Women 55.3 41.9 41.7 100 100 41.5 29 27.8 86.4 83.3
Fisher exact 1.00 0.51 0.58 -- --
VII. REDUCED COMMITMENT
There are two kinds of remaining explanations for the gender gap in hard task choices. The first has to do with the characteristics of the task. While the feedback treatment ruled out that there is a large gender difference in preferences for performing either of the two tasks per se, there can still be gender differences in preferences over receiving feedback about one’s performance level. All participants are told that those whose task 1 performance is in the top 40% have on average higher earnings from the hard rather than the easy task, and the other way round. Since all participants perform the easy task (task 1), choosing the hard task (at least once) can provide feedback about one’s relative task 1 performance. If there is a gender difference in preferences for feedback (hypothesis 2), this can account for both the gender gap in choices of task difficulty in the choice treatment and the lack of one in the feedback treatment.
A second remaining explanation for the results so far is that women differ from men in their risk attitudes and certainty. Specifically, women may be more risk averse, and hence prefer the task for which earnings are more certain and have a lower variance (hypothesis 4). Alternatively, women may be less certain in their beliefs about their ability to perform the harder tasks. One source for this difference can be a difference in beliefs about whether the initial task 1 performance is due to luck or ability. If women attribute “success” (i.e. high performance) more to luck and “failure” more to ability, and vice versa for men, then they will have different beliefs about truly being of a high performance level, even for similar beliefs about the relative initial task 1 performance. We summarize all these explanations as differences in risk aversion and certainty. The