Optimizing the thermal performance of
building envelopes for energy saving in
underground office buildings in various
climates of China
Article
Accepted Version Creative Commons: AttributionNoncommercialNo Derivative Works 4.0Shi, L., Zhang, H., Li, Z., Luo, Z. and Liu, J. (2018) Optimizing
the thermal performance of building envelopes for energy
saving in underground office buildings in various climates of
China. Tunnelling and Underground Space Technology, 77.
pp. 2635. ISSN 08867798 doi:
https://doi.org/10.1016/j.tust.2018.03.019 Available at
http://centaur.reading.ac.uk/76214/
It is advisable to refer to the publisher’s version if you intend to cite from the work. See Guidance on citing . To link to this article DOI: http://dx.doi.org/10.1016/j.tust.2018.03.019 Publisher: Elsevier All outputs in CentAUR are protected by Intellectual Property Rights law, including copyright law. Copyright and IPR is retained by the creators or other copyright holders. Terms and conditions for use of this material are defined in the End User Agreement .www.reading.ac.uk/centaur
CentAUR
Central Archive at the University of Reading
Reading’s research outputs online1
Optimizing the thermal performance of building envelopes for energy saving in
1
underground office buildings in various climates of China
2
Luyang Shi1, Huibo Zhang2, Zongxin Li3, Zhiwen Luo4, Jing Liu1, 5*
3
1School of Municipal and Environmental Engineering, Harbin Institute of Technology, 202 Haihe
4
Street, Nangang District, Harbin, China
5
2School of Naval Architecture, Ocean and Civil Engineering, Shanghai Jiao Tong University, 800
6
Dongchuan Road, Minhang District, Shanghai, China
7
3The Fourth Design and Research Institute, Headquarters of the General Staff Corps, Beijing, China
8
4School of the Built Environment, University of Reading, Reading, United Kingdom
9
5State Key Laboratory of Urban Water Resource and Environment, Harbin Institute of Technology,
10 Harbin, China 11 12 13 14 15 16
*Corresponding author: Jing Liu
17
Address: School of Municipal and Environmental Engineering, Harbin Institute of Technology, No.73,
18
Huanghe Road, Nangang District, Harbin 150000, China.
19 Tel./fax: +86 0451 8628 2123. 20 E-mail: [email protected] 21 22
2
Abstract This article investigates the influence of the thermal performance of
23
building envelopes on annual energy consumption in a ground-buried office building
24
by means of the dynamic building energy simulation, aiming at offering reasonable
25
guidelines for the energy efficient design of envelopes for underground office
26
buildings in China. In this study, the accuracy of dealing with the thermal process for
27
underground buildings by using the Designer's Energy Simulation Tool (DeST) is
28
validated by measured data. The analyzed results show that the annual energy
29
consumptions for this type of buildings vary significantly, andit is based on the value
30
of the overall heat transfer coefficient (U-value) of the envelopes. Thus, it is necessary
31
to optimize the U-value for underground buildings located in various climatic zones in
32
China. With respect to the roof, an improvement in its thermal performance is
33
significantly beneficial to the underground office building in terms of annual energy
34
demand. With respect to the external walls, the optimized U-values completely
35
change with the distribution of the climate zones. The recommended optimal values
36
for various climate zones of China are also specified as design references for public
37
office building in underground in terms of the building energy efficiency.
38
Keywords: Underground office buildings; Thermal performance; Optimization;
39
China; DeST simulation
40 41 42 43 44
3
1 Introduction
45
In the view of the significant increases of the population in urban cities over recent
46
decades, underground buildings have played an increasingly important role in the
47
development and improvement of metropolises. A growing number of underground
48
buildings, such as underground parking spaces, shopping malls, hospitals, railways,
49
and office buildings, have been constructed as alternatives for urban area expansion in
50
metropolises worldwide [1], and especially in China [2,3]. For instance, the total area
51
of underground space in Beijing has reached 72.68 million m2 with a noted annual
52
increase of over 7.3 million m2 based on published figures in August 2014 [2]. The
53
development of underground buildings effectively relieves land utilization in these
54
mega cities, and definitely provides more living space for urbanites [4, 5]. Moreover,
55
compared to buildings built above the ground, underground buildings may exhibit
56
increased advantages in terms of building energy efficiency and indoor climate owing
57
to their better capacities for heat storage, heat stability, and smaller temperature
58
variations [6, 7]. Therefore, underground buildings require lower heating and cooling
59
loads, save more energy for residents, and improve urban sustainability [6, 7, and 8].
60
Many studies have demonstrated that underground buildings possess immense
61
potential in reducing energy demands that can save more than 23% of energy in
62
comparison with similar aboveground buildings [6, 9, 10, and 11]. It should be noted
63
that the energy analysis of earth-sheltered domestic buildings situated in Poland
64
showed that approximately 47%-80% reduction in the heating energy demand could
65
be achieved by using various thickness of thermal insulation [6].
4
Recently, some researchers have attempted to study the energy performance of
67
underground buildings using various research methods such as a two–dimensional
68
transient finite element model (FEM) to investigate heat loss in a basement [12], a
69
two–dimensional dynamic model of heat transfer through building envelopes using
70
MATLAB [13], a combination of computer programs FlexPDE and EnergyPlus to
71
simulate the heating and cooling energy demands in earth–sheltered buildings [6], a
72
three–dimensional analysis of the thermal resistance of an external insulation system
73
of a basement [13], a three-dimensional finite difference model (FDM) to verify the
74
energy reduction potential of underground buildings [14], and an experimental
75
analysis of indoor temperature variations related to ground layers in underground
76
wine cellars [15]. All these experimental and simulated research studies indicate that
77
the energy performance of underground buildings is determined by a wide variety of
78
influential factors such as design typology, building function, HVAC systems,
79
covering soil depth and type, thermal insulation, air infiltration [8]. In terms of design
80
typology, contact surface area of building with the earth plays a key role in heat
81
transfer. Overall, adopted methodologies have been more sophisticated as compared
82
to conventional methodologies used for buildings above the ground. Additionally,
83
these factors interact and change with different outdoor climates and indoor
84
conditions [8, 16]. Among these factors, the building envelope is a factor that can be
85
easily designed and optimized in the early design stages for energy efficiency.
86
In terms of building envelope features for aboveground buildings,an improvement
87
in the thermal performance of the envelope, such as an increase in the thermal
5
insulation level, can effectively reduce heat loss, and the annual energy demands for
89
both heating and cooling [17, 18]. The efficiency requirements for building envelopes,
90
such as the assembly’s maximum U-value (overall heat transfer coefficient), are
91
determined for building energy efficiency based on the ASHRAE Standards 90.1–
92
2016 [19] in America, and GB50189–2015 in China [20]. However, the heat transfer
93
through an underground building is completely different from that of a building that is
94
above the ground because the soil’s thermal properties are treated as a thermal
95
reservoir for modulating interior temperatures [21]. Therefore, these standards
96
correspond to buildings built above the ground and might be not suitable for
97
underground buildings in which the thermal performance of the envelopes is designed
98
for energy efficiency.
99
In this context, several researchers have focused on the investigation of the
100
influence of the thermal performance of the envelopes on energy consumption with
101
respect to heating and cooling loads for underground buildings [11, 13, 22, and 23].
102
Krarti and Choi demonstrated that additional insulation is required at the corners, as
103
opposed to the middle section of the surface to minimize the heat loss for
104
underground buildings, and that insulation material should be close to the soil surface
105
[13]. Yuan et al. evaluated the effect of building materials on the temperature and heat
106
flux for envelopes in a basement, and indicated that the thermal conductivity of
107
building materials is an important factor in the heat transfer of the envelopes [22].
108
Dronkelaar stated that the energy performance is more significantly dependent on the
109
U-value of the constructions and the ventilation rates in certain colder climates [11].
6
Staniec and Nowak suggested that thinner thermal insulation, elicits a better cooling
111
effect gained from the soil, whereas a thicker insulation leads to a smaller heating
112
energy demand [6, 23]. These studies indicates that the thermal performance of the
113
envelopes in an underground building is one of the most important design criteria to
114
allow the best thermal comfort effect [8]. However, the relationships between the
115
annual energy demand and the thermal performance of the envelopes in underground
116
buildings might not be very accurate and explicit, especially with respect to various
117
climatic zones. In general, outdoor climatic conditions have a slight influence on the
118
indoor environment and energy demand for underground buildings in a short time.
119
However, the long-term distribution of ground temperature is crucial in determining
120
the energy demand, which is dependent on the climate and soil’s thermal properties.
121
Although the simulated analysis by Staniec and Nowak illustrated the influence of
122
thermal insulation on heating and cooling loads, the combined effect of thermal
123
performance of the envelope on the annual energy demand (including heating and
124
cooling energy) has not been considered in their study. Furthermore, their simulation
125
was only performed for Polish climate conditions, and thus, it may not be possible to
126
apply their conclusions to various climates around the world.
127
On the other hand, China has a vast territory spanning five different climatic
128
conditions [24]. Specifically, temperature waves of underground spaces differ in
129
terms of values, amplitude, period, and phase displacement for various climatic zones.
130
Therefore, the efficiency requirements of building envelopes in an underground
131
building may vary significantly with changes in the climate. Hence, a reasonable and
7
formal guideline, or a standard listing the efficiency requirements, are necessary for
133
underground building envelopes in various climates to provide a basis for the
134
energy-saving design of the envelopes, which is currently lacking in China.
135
The aim of this study is to investigate the influence of the thermal performance of
136
the envelopes on annual energy consumption for underground office buildings in
137
various climatic zones of China, thereby allowing the determination of the optimized
138
U-value for building envelopes (including the roof and the exterior wall), and
139
introducing reasonable guidelines for the energy efficient design of underground
140
building envelopes. First, a building energy simulation tool known as the Designer's
141
Energy Simulation Tool (DeST) was presented in detail to deal with the thermal
142
process for the underground building and the accuracy of DeST is also validated by
143
measured data. Thus, DeST is used to calculating the hourly heating and cooling loads
144
for ground-buried office buildings in this study to optimize the thermal performance
145
of the insulation configurations of envelopes for various climatic zones in China,
146
based on the annual energy consumption.
147
2 Methodology
148
This section is organized in four parts. Section 2.1 describes the details for
149
simulating thermal process within underground buildings by means of DeST. Section
150
2.2 presents a prototype underground building model implemented in the DeST
151
platform. Section 2.3 shows the classification of climate zones in China and lists the
152
ten major Chinese cities selected for this simulation. The evaluation method of
8
calculating annual energy demand based on hourly heating and cooling loads is
154
summarized in Section 2.4.
155
2.1 Simulation tool
156
DeST is an effective building energy simulation tool that was developed by
157
Tsinghua University in 1989. To-this-date, numerous case analyses and theoretical
158
validations are performed, and as a result, DeST has become a widely-used platform
159
for calculating building thermal processes and for dynamic simulations of the
160
building’s energydistribution. Specifically, DeST develops a graphical user interface
161
that is based on AutoCAD for all simulation processes to avoid additional modelling
162
work and information loss due to conversion [25].
163
In terms of energy performance, the most significant difference between an
164
underground building and an aboveground building is that all the building partitions
165
are in contact with soil, rather than atmosphere. Therefore, it is critical to determine
166
surrounding ground temperature and calculate the heat transfer process of
167
ground-coupled envelopes that are in contact with the earth for simulating an
168
underground building. Generally, heat transfer within ground-coupled envelope is
169
computed using numerical methods, such as FEM and FDM [12, 14]. However, these
170
models are excessively time-consuming for hourly simulations over the period of a
171
year [25].
172
In DeST simulation, the heat transfer process of ground-coupled envelopes (the
173
envelopes that are contact with the earth) is decomposed into three processes which
9
are controlled by ground-coupled envelope surface temperature, outdoor ground
175
surface temperature and temperature difference of ground-coupled envelope surfaces
176
[26]. The schematic diagram of heat transfer within ground-coupled envelopes is
177
presented in Fig.1. Outdoor ground surface temperature (OGST) is mainly determined
178
by above air temperature, absorbed solar radiation, long wave radiation with sky.
179
Ground-coupled envelope surface temperature is mainly determined by room air
180
temperature, long wave radiation with occupant, light, equipment and other inner
181
surface in the room. Temperature of deep soil surface is set as constant and
182
approximately equals to mean ground surface temperature (MGST).
183
184
Fig.1 Schematic program of underground building’s heat transfer and boundary condition (not in scale)
185
In the first process, outdoor ground surface temperature is set as zero and the
186
temperature of other ground-coupled envelopes is set the same as the selected one.
187
The heat transfer process controlled by ground-coupled envelope surface temperature
188
is computed by one-dimensional Equivalent Slab. In the second process, temperature
189
of all ground-coupled envelope surfaces is set as zero and outdoor ground surface
190
temperature is simplified as a constant and 1 year period harmonic variable. In the
10
third process, outdoor ground surface temperature is set as zero and the temperatures
192
of ground-coupled envelopes are different. The heat between ground-coupled
193
envelopes is exchanged through the soil and is computed by a one-dimensional Extra
194
Partition Wall. Therefore, replace the ground-coupled envelope in a room using
195
Equivalent Slab and treat the heat flux computed in the second and third process as
196
heat source of Equivalent Slab inner surface, and thus the heat transfer of
197
ground-coupled envelope is calculated and implemented into building thermal
198
simulation. This approach can save a large amount of time for the full-year calculation
199
compared with other numerical methods [26].
200
2.2 Underground office building details
201
All simulation stages are performed in DeST for a simplified prototype building
202
model based on a typical large-scale office building that is fully underground. The
203
building is locatedat a depth of 1.0 m below the ground in Beijing and has only one
204
underground floor with a story height of 3.3 m. The building is consisted of five
205
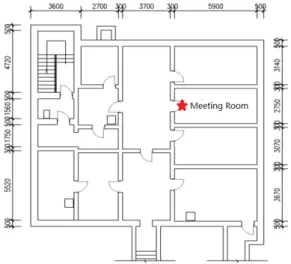
sections as detailed in a previous study [27]. Fig.2 shows the layout of the eastern
206
section of the building as the chosen prototype building model in the calculation,
207
which has a building area of 215.5 m2. Table 1 lists the components and thermal
208
performance of the building envelope. The building is surrounded by rammed clay
209
that is considered as a special component for the exterior walls. The thermal
210
conductivity coefficient of rammed clay is 1.16 W/(m·K).
11
212
Fig.2 The layout of the simplified underground building (unit: mm)
213
Table 1Components and the thermal performance of the building envelope
214
Building envelope
Building envelope components U-value
(W/m2·K)
Roof 20 mm Lime mortar + 300 mm reinforced concrete 0.81
External walls 30 mm Lime mortar + 200 mm reinforced concrete 1.00
In this simulation, the layout and building structure are constructed using model
215
parameters that are as close as possible to the real-life situation [28]. It is assumed that
216
there is no infiltration or solar gains for the underground building because the
217
building is completely buried beneath the surface.
218
Three scenarios are considered in the simulation. The details of building
219
characteristics for the three scenarios are presented in Table 2. Scenario A is
220
performed to simulate annual indoor temperature variations in the meeting room as
221
depicted in Fig.2. Scenarios B and C are both executed to calculate the hourly load of
222
the underground building. First, Scenario B is performed to investigate the influence
223
of the U-value of the roof on the annual energy demand, and to determine its optimal
224
U-value. This is followed by the execution of Scenario C to optimize the thermal
12
performance of the exterior walls. It should be noted that the U-value of the roof for
226
Scenario C is adopted based on the optimized results in Scenario B. In this study, two
227
covering soil depths (1.0 m and 3.0 m) (calculated between the rooftop of the
228
building and the ground surface) are chosen because the depth also greatly affects the
229
indoor heat environment of the subsurface structure [8]. In this simulation, the
230
research objective is the public office building, thus the parameters of the thermal
231
disturbances (Table 3) from the occupants, illumination, and equipment in the
232
building are assumed to be the same as those of public buildings above the ground
233
according to Chinese national standard for public buildings [20], which is typical and
234
representative for office buildings. The schedules for the interior heat sources are
235
described in Table 4. Mechanical ventilation does not consider the impact of fresh air
236
on the heat transfer between the building and surrounding envelopes. Therefore, the
237
fresh air load is not included in the simulation for the calculation of the annual hourly
238
load.
239
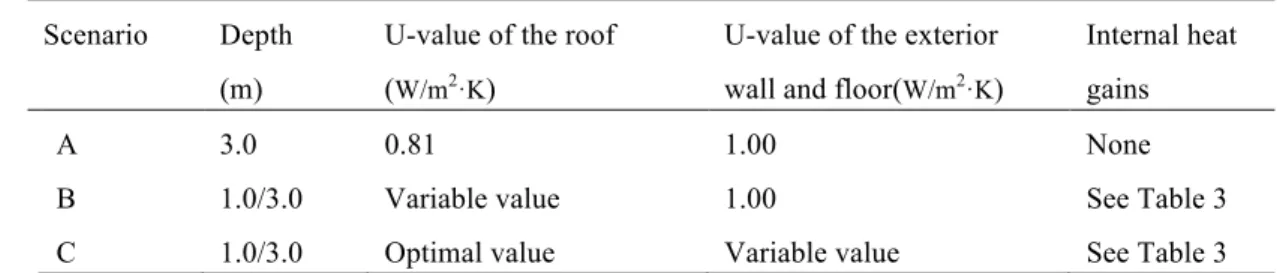
Table 2 Building characteristics for the three executed scenarios
240
Scenario Depth
(m)
U-value of the roof (W/m2·K)
U-value of the exterior wall and floor(W/m2·K)
Internal heat gains A 3.0 0.81 1.00 None B C 1.0/3.0 1.0/3.0 Variable value Optimal value 1.00 Variable value See Table 3 See Table 3 Notes: Variable values: 0.22/0.49/0.81/1.00/1.50/2.00/2.45/2.97, optimal value: the optimized results of
241
U-value for the roof in Scenario B.
242
Table 3 Internal heat sources for an underground building
243
13
Public office 0.1 9.0 15
Notes: MNP: maximum number of individuals, MI: maximum illumination, MHGFE: maximum heat
244
gain from the equipment.
245
Table 4 Schedules for various internal heat sources
246
Interior disturbance Schedule
Occupants ON from 08:00 to 17:00 on workday, OFF at all other times Illumination
Equipment
ON from 08:00 to 17:00 on workday, OFF at all other times ON from 08:00 to 17:00 on workday, OFF at all other times
For Scenarios B and C, the heating and cooling systems have considered the
247
provision of a comfortable indoor environment in an underground building. The high
248
heat storage capacity of the surrounding soil results in an indoor underground
249
temperature that is lower than 20 °C sometimes even during the summer [15, 27],and
250
it is then necessary to heat the room. Thus, it is not suitable to simply set the same
251
parameters for an underground space to those used for indoor air conditioning for
252
buildings above the ground, such as 26 °C in the summer, and 20 °C in winter. In the
253
simulation, the indoor temperatures of an underground building in the summer and
254
winter were set to a wide range of temperatures that approximately spanned 20-28 °C,
255
and 18-22 °C, respectively.
256
2.3 Climatic zones in China
257
Based on the different climatic characteristics, China is divided into five major
258
climate zones as follows: a severe cold zone (SCZ), a cold zone (CZ), a hot summer
259
and cold winter zone (HSCWZ), a hot summer and warm winter zone (HSWWZ), and
260
a temperate zone (TZ) (Fig.3). This climatic classification framework is principally
14
based on the average temperatures in the coldest and hottest months [18].
262
263
Fig.3 Classification of climate zones in China and geographic locations of the 10 major citiesselected
264
for this study, as denoted by the red stars
265
For Scenario B and C, 10 typical cities covering the climate zones are selected for
266
the investigation, and they are denoted using red stars, as shown in Fig.3. They
267
represent the corresponding climatic zones. The meteorological data for these cities
268
during a typical meteorological year is determined based on a multiyear weather
269
database file [16]. In DeST, hourly data of weather variations is calculated in a similar
270
manner to the calculation of the weather input parameters for Scenario B and C.
271
2.4 Annual energy demand calculation
272
The hourly heating and cooling loads for the underground building are obtained
273
based on the calculations of Scenario B and C. The grades of energy used in the
274
heating and cooling systems as well as their energy efficiencies are different. It is
275
necessary to convert the various energy forms to electricity power by using the
15
method detailed in the GB50189–2015 Standard [20], and thus annual energy
277
consumption for underground building is obtained.
278
For all the climatic zones, space cooling is provided using water–cooled
279
centrifugal chillers [20], and the electricity consumption for cooling can be calculated
280 in accordance to Eq.(1): 281 𝐸" = $% &×(")*+ (1) 282
where, Q" denotes the accumulative cooling load on the calculatedDeST results in
283
kWh, A denotes the total cooling areas in m2, and SCOP
2is the synthetic coefficient
284
of performance for the cooling system and equals to 2.5 [20].
285
The heating system is determined based on the climate zones. The system
286
operation with a coal-fired boiler is applied in the SCZ and CZ, while the system that
287
operated with a natural-gas-fired boiler is applied in all the other climate zones [23].
288
The electricity consumption for the heating system can be evaluated using Eqs.(2) and
289 (3), respectively. 290 𝐸3 = $4 &567678 (2) 291
where, Q3denotes the annual accumulative heating load based on the calculated
292
results of DeST in kWh, A denotes the total heating areas in m2, η: denotes the
293
synthetic efficiency of the heating system with a coal–fired boiler and equals to 60%
294
[20], q: denotes the calorific value of standard coal and equals to 8.14 kWh/ kgce,
295
and q< denotes the coal consumption rate in the power generation and equals to
296 0.360 kgce/kWh. 297 𝐸3 = $4 &587=78𝜑 (3) 298
16
Where, φ denotes the converted coefficient between standard coal and gas, and
299
equals to 1.21 kgce /m3, η< denotes the synthetic efficiency of the heating system
300
with a natural gas–fired boiler and equals to 75% [20], and q@denotes the calorific
301
value of gas and equals to 9.87 kWh/ kgce.
302
Finally, the annual energy consumption is the sum of E3 and E", and is
303
considered as the evaluation index of the total energy consumption for a full year in
304
this study.
305
3 Results and discussions
306
3.1 Analysis of room temperature simulation
307
Basal room temperature refers to the indoor temperature that arises from the
308
thermal interaction between the outdoor climatic conditions and the building in its
309
natural state [16]. In this case, there were no heating/cooling sources or working
310
HVAC systems. In this study, the meeting room, denoted as a red star in Fig.2, was
311
used as an example to analyse the indoor temperature variations throughout the entire
312
year. Fig.4 (a) shows the measured indoor temperature data a period of 9–10 months,
313
while the outdoor temperature variations of Beijing during the year at which tests
314
were conducted are shown in Fig.4 (b). Additionally, the annual hourly basal room
315
temperature of the meeting room was calculated using DeST (Scenario A), as
316
presented in Fig.4 (a). It should be noted that the meteorological data for Scenario A
317
were based on a weather database file that matched the year at which the tests were
318
conducted.
17 320 321 322 (a) (b) 323
Fig.4 Basal temperature variations in the meeting room for simulation and measurements (a) and
324
annual hourly dry-bulb temperature in Beijing during the testing year at which tests were conducted (b)
325
A sinusoidal behaviour of seasonal variability in the indoor temperature of the
326
meeting room is distinctly observed in Fig.4. A comparison of the variations of indoor
327
and outdoor temperatures indicates that their behaviours are almost identical in terms
328
of the exhibited tendencies to monthly changes, but the temperature waves differ in
329
terms of values, amplitude, and phase displacement [15]. First, the indoor temperature
330
is very stable throughout the year eliciting a mean temperature of approximately
331
20 °C when compared to the outdoor temperature owing to the thermal inertia of the
332
surrounding soil. The highest temperature of the underground space is approximately
333
10 °C lower than that of the outdoor air, while the lowest temperature of underground
334
space is more than 20 °C larger than that of outdoor air. Additionally, the highest
335
indoor temperature in underground buildings occurred in early August, while the
336
highest outdoor temperature occurred in early July. Similarly, the lowest indoor
337
temperature of the underground space is observed in mid-February, while the lowest
338
outdoor temperature is observed in mid-January. This implies that the phase
339
displacement between the indoor temperature in the underground space (at a depth of
340 0 1 2 3 4 5 6 7 8 9 10 11 12 -20 -15 -10 -5 0 5 10 15 20 25 30 35 40 Dry-b ulb tem pe ra tur e/ oC Month 0 1 2 3 4 5 6 7 8 9 10 11 12 5 10 15 20 25 30 35 RMSE=0.6295 B as e ro om tem pe ra tur e/ o C Month Simulation Measured data
18
1.0 m below the ground) and the outdoor temperature approximately corresponds to
341
one month.
342
In order to compare the calculated and measured indoor temperature of the
343
meeting room, we calculated the coefficient of variation of the root-mean square error
344
(RMSE) using the following equation:
345
RMSE = QRS:(𝑇FGHI− 𝑇FKLGM)</𝑁
346
(4)
347
where, 𝑇FGHI is the measured indoor temperature at a given time, 𝑇FKLGM is the
348
modelled indoor temperature at that same time, and N is the number of measurements.
349
The value of RMSE is used to quantify the agreements between measured and
350
computational results and this value in Fig.4 (a) is 0.63, showing there is a good
351
agreement between that experimental and computational results. Thus, the accuracy of
352
the thermal process within underground buildings by means of DeST-based dynamic
353
simulation is thus validated.
354
3.2 Analysis of hourly load for heating and cooling.
355
In this section, the calculated results for Scenario C are analyzed and illustrated as
356
an example. In this case, the details of the simulation are as follows: the building is
357
located at a depth of 1.0 m below the ground (Beijing), and the heat transfer
358
coefficient of the roof is 0.8 W/(m2·K). Fig.5 shows the simulation results for the
359
distribution of annual hourly heating and cooling loads in an underground building.
19
In Fig.5, it is observed that the cooling load started at the end of July and lasted
361
until the beginning of September, and this indicated that the cooling system worked
362
during this period to regulate the indoor temperature to preset levels. The onset of the
363
cooling operation occurred a month later than that used for buildings built above the
364
ground. This may be owing to the phase displacement of the ground temperature
365
compared to the outdoor temperature. A similar tendency in the heating load is also
366
observed in Fig.5. For an underground building, the heating system mainly worked
367
from January to February instead of the coldest months with respect to the outdoor
368
atmosphere in Beijing (December and January).
369 370 371 372 373 374
Fig.5 Annual heating and cooling load variations for an underground building
375
3.3 Impact of thermal characteristics of the roof on building energy demand
376
In this section, the influence of the thermal performance of the roof on the
377
building’s energy demand is analyzed for various climatic zones, based on the
378
calculated results of Scenario B. Fig.6 (a)-(e) indicates that the annual energy demand
379
changes as a function of the U-values of the roof for each of the corresponding
380
climatic zones. As shown, the relationships between annual energy consumption and
381 0 1 2 3 4 5 6 7 8 9 10 11 12 0 5 10 15 20 25 Cooling Heating Ho urly lo ad pe r un it a rea W /m 2 Month
20
U-values for the roofs for various climatic zones of China are very similar. Overall,
382
the decrease in the U-values of the roof effectively reduced the building’s energy
383
demand by enhancing the thickness of the thermal insulation. This can be explained
384
by the fact that the existing insulation diminished the impacts of the outdoor climate
385
on the indoor environment of an underground space. For example, in Harbin (with a
386
building depth of 1.0 m), the amount of annual energy consumption decreased from
387
6.20 kW·h/m2 to 3.55 kW·h/m2, and this corresponded to a change of approximately
388
42.7% when the U-value decreased from 2.0 W/(m2·K) to 0.5 W/(m2·K). The
389
effectiveness of the U-value is more significant at lower values, while U-values
390
higher than 2.5 W/(m2·K) minimized their impacts on the building’s energy
391
consumption.
392
Therefore, the analyzed results reveal that the energy efficiency requirements for
393
the roofs of underground buildings are consistent with the standards for buildings
394
above the ground. Thus, an improvement in the thermal performance of a roof, based
395
on the increase of the insulation materials, is beneficial to the building’s energy
396
consumption. As shown in Fig.6 (a) and (b), it is also clear that additional insulation
397
materials are required for cold climatic zones-and especially for SCZ to minimize heat
398
loss through the roof, and especially for shallow-buried underground buildings.
399 400 401 402 403
21 404 405 406 407 408 (a1) (a2) 409 410 411 412 413 (b1) (b2) 414 415 416 417 418 (c1) (c2) 419 420 421 422 423 (d1) (d2) 424 425 0.0 0.5 1.0 1.5 2.0 2.5 3.0 0 2 4 6 8 Annu al e ne rg y con sum ptio n (KWh/m 2) U-value (W/m2/K) Beijing-1.0m Beijing-3.0m 0.0 0.5 1.0 1.5 2.0 2.5 3.0 0 2 4 6 8 Annu al e ne rg y con sum ptio n (KWh/m 2) U-value (W/m2/K) Xi'an-1.0m Xi'an-3.0m 0.0 0.5 1.0 1.5 2.0 2.5 3.0 0 2 4 6 8 Annu al e ne rg y con sum ptio n (KWh/m 2) U-value (W/m2/K) Wuhan-1.0m Wuhan-3.0m 0.0 0.5 1.0 1.5 2.0 2.5 3.0 0 2 4 6 8 Annu al e ne rg y con sum ptio n (KWh/m 2) U-value (W/m2/K) Guangzhou-1.0m Guangzhou-3.0m 0.0 0.5 1.0 1.5 2.0 2.5 3.0 0 2 4 6 8 Annu al e ne rg y con sum ptio n (KWh/m 2) U-value (W/m2/K) Nanning-1.0m Nanning-3.0m 0.0 0.5 1.0 1.5 2.0 2.5 3.0 0 2 4 6 8 Annu al e ne rg y con sum ptio n (KWh/m 2) U-value (W/m2/K) Harbin-1.0m Harbin-3.0m 0.0 0.5 1.0 1.5 2.0 2.5 3.0 0 2 4 6 8 Annu al e ne rg y con sum ptio n (KWh/m 2) U-value (W/m2/K) Urumchi-1.0m Urumchi-3.0m 0.0 0.5 1.0 1.5 2.0 2.5 3.0 0 2 4 6 8 Annu al e ne rg y con sum ptio n (KWh/m 2) U-value (W/m2/K) Shanghai-1.0m Shanghai-3.0m
22 426 427 428 429 430 (e1) (e2) 431
Fig.6 Relationships between annual energy demand and U-values of the roof for SCZ (a), CZ (b),
432
HSCWZ (c), HSWWZ (d), and TZ (e)
433
3.4 Impact of the thermal characteristics of the exterior wall
434
Fig.7 (a)-(e) depicts the relationships between the annual energy demand and the
435
U-values of the exterior wall in underground buildings for various climatic zones in
436
China. Overall, these relationships vary with changes in the climate.
437 438 439 440 441 (a1) (a2) 442 443 444 445 446 0.0 0.5 1.0 1.5 2.0 2.5 3.0 0 1 2 3 4 5 6 Annu al e ne rg y con sum ptio n (KWh/m 2) U-value (W/m2/K) Kunming-1.0m Kunming-3.0m 0.0 0.5 1.0 1.5 2.0 2.5 3.0 4 6 8 10 12 Annu al e ne rg y con sum ptio n (KWh/m 2) U-value (W/m2/K) Harbin-1.0m Harbin-3.0m 0.0 0.5 1.0 1.5 2.0 2.5 3.0 4 6 8 10 12 14 Annu al e ne rg y con sum ptio n (KWh/m 2) U-value (W/m2/K) Urumchi-1.0m Urumchi-3.0m 0.0 0.5 1.0 1.5 2.0 2.5 3.0 0 1 2 3 4 5 6 Annu al e ne rg y con sum ptio n (KWh/m 2) U-value (W/m2/K) Guiyang-1.0m Guiyang-3.0m
23 447 448 449 450 451 (b1) (b2) 452 453 454 455 456 (c1) (c2) 457 458 459 460 461 (d1) (d2) 462 463 464 465 466 (e1) (e2) 467
Fig.7 Relationships between annual energy demand and U-values of the exterior wall for SCZ (a), CZ
468 0.0 0.5 1.0 1.5 2.0 2.5 3.0 0 1 2 3 4 5 6 7 8 Annu al e ne rg y con sum ptio n (KWh/m 2) U-value (W/m2/K) Beijing-1.0m Beijing-3.0m 0.0 0.5 1.0 1.5 2.0 2.5 3.0 0 1 2 3 4 5 6 7 8 Annu al e ne rg y con sum ptio n (KWh/m 2) U-value (W/m2/K) Xi'an-1.0m Xi'an-3.0m 0.0 0.5 1.0 1.5 2.0 2.5 3.0 0 1 2 3 4 5 6 7 8 9 10 Annu al e ne rg y con sum ptio n (KWh/m 2) U-value (W/m2/K) Shanghai-1.0m Shanghai-3.0m 0.0 0.5 1.0 1.5 2.0 2.5 3.0 0 1 2 3 4 5 6 7 8 9 10 Annu al e ne rg y con sum ptio n (KWh/m 2) U-value (W/m2/K) Wuhan-1.0m Wuhan-3.0m 0.0 0.5 1.0 1.5 2.0 2.5 3.0 0 2 4 6 8 10 12 14 16 Annu al e ne rg y con sum ptio n (KWh/m 2) U-value (W/m2/K) Guangzhou-1.0m Guangzhou-3.0m 0.0 0.5 1.0 1.5 2.0 2.5 3.0 0 2 4 6 8 10 12 Annu al e ne rg y con sum ptio n (KWh/m 2) U-value (W/m2/K) Nanning-1.0m Nanning-3.0m 0.0 0.5 1.0 1.5 2.0 2.5 3.0 0 1 2 3 4 5 6 7 8 Annu al e ne rg y con sum ptio n (KWh/m 2) U-value (W/m2/K) Kunming-1.0m Kunming-3.0m 0.0 0.5 1.0 1.5 2.0 2.5 3.0 0 1 2 3 4 5 6 7 8 Annu al e ne rg y con sum ptio n (KWh/m 2) U-value (W/m2/K) Guiyang-1.0m Guiyang-3.0m
24
(b), HSCWZ (c), HSWWZ (d), and TZ (e)
469
A minimum is clearly observed in Fig.7 (a) and (b), thereby implying that there is
470
an optimal U-value for the exterior wall for SCZ and CZ. With respect to SCZ, it is
471
noted that increasing the U-value from 0.22 W/(m2·K) to 0.8 W/(m2·K) effectively
472
reduces the annual energy consumption. However, this is followed by a continuous
473
increase in the annual energy demand as a function of the U-value. Thus, the optimum
474
U-value for the exterior wall for SCZ is approximately equal to 0.8 W/(m2·K).
475
Similarly, the optimum value of the exterior wall in an underground building for CZ is
476
1.0 W/(m2·K).
477
The reason pertaining to the achieved optimal level of the U-value of the exterior
478
wall is attributed to the differential impacts of energy consumption owing to heating
479
and cooling. Fig.8 shows the variations in heating and cooling energies as a function
480
of the U-values of the exterior wall in Harbin. Specifically, the thermal resistance of
481
the exterior wall effectively prevents heat from being transferred into the surrounding
482
soil in winter. Nevertheless, if the U-value is excessively low, the heat generated in
483
the room cannot be effectively transferred into the soil, and this leads to an increased
484
cooling load. In the summer, a decrease in the U-value of the exterior wall can
485
effectively transfer more heat into the surrounding soil, and this is helpful in yielding
486
significant decreases in the indoor temperature and in the cooling load. Thus, a
487
decrease in the U-value of the exterior wall is beneficial in the reduction of the
488
heating energy in winter, while an increase in the U-value is helpful in reducing the
489
cooling energy in the summer. It is necessary to evaluate a trade-off by considering
25
the optimal annual energy consumption (including the heating and cooling energies)
491
when the thermal performance of the exterior wall in an underground building is
492
designed for energy conservation.
493 494 495 496 497 498
Fig.8 Variations in the annual energy consumption for heating and cooling as a function of U-values of
499
the exterior wall in Harbin
500
With respect to the HSCWZ, the optimized value was approximately 1.5 W/(m2·K),
501
but when the U-value increased to 2.0 W/(m2·K), its impact on building energy
502
consumption was minimized. Similarly, the optimized U-value for TZ was
503
approximately in the range of 1.5–2.0 W/(m2·K), as shown in Fig.7 (e). It should be
504
noted that higher U-values elicit lower annual energy demand for buildings in
505
HSCWZ, even though the effectiveness of the U-value is not significant at higher
506
values. This means that thermal insulation materials are not necessary for the exterior
507
walls in underground buildings for HSCWZ, and that the U-value of the exterior walls
508
should in general be larger than 2.0 W/(m2·K). These findings are completely
509
different from those for buildings above the ground. The main reason for this
510
difference is the soil temperature. Fig.9 presents the measured data of the soil
511
temperature at a depth of 3.2 m in a typical underground building in five selected
512 0.0 0.5 1.0 1.5 2.0 2.5 3.0 0 2 4 6 8 10 12 Annu al e ne rg y con sum ptio n (KWh/m 2) U-value (W/m2/K) Heating Cooling
26
cities corresponding to different climatic zones in China [29].
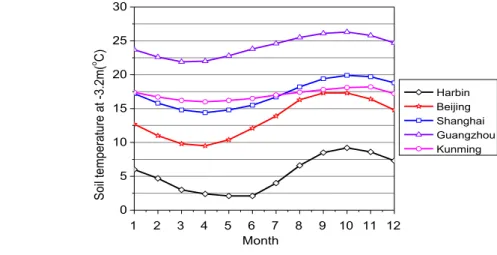
513 514 515 516 517 518 519
Fig. 9 Measured data of the soil temperature at a depth of 3.2 m below the ground
520
Based on Fig.9, it is observed that the average soil temperature corresponding to a
521
depth of 3.2 m below the ground in Guangzhou (HSCWZ) reached 24 °C, and that the
522
yearly dry-bulb temperature exceeded 20 °C. Thus, cooling of the interior space
523
constitutes the main consequence in response to the climatic changes of HSWWZ.
524
Increasing the U-value of the exterior wall is helpful in transferring the heat generated
525
in the space into the surrounding soil.
526
Conversely, the fluctuation in the soil temperature in Harbin (SCZ) and Beijing
527
(CZ) exceeded the corresponding fluctuations for the other three cities. For example,
528
in Harbin, the average soil temperature (at a depth of 3.2 m below the ground) is the
529
lowest among all the studied cities, and corresponded to approximately 5 °C. Thus, it
530
is curial to reduce heat losses through the external walls. This is the reason why the
531
basic requirements of good thermal insulation of the envelope need to be met for SCZ
532 and CZ. 533 534 1 2 3 4 5 6 7 8 9 10 11 12 0 5 10 15 20 25 30 Harbin Beijing Shanghai Guangzhou Kunming Soil te mpe ra tu re a t -3. 2m( o C) Month
27
4 Conclusions
535
The focus of the present study is the thermal performance of the envelope for
536
soil-buried office buildings, which may show distinct characteristics when compared
537
to conventional buildings that are built above the ground. An advanced building
538
energy-modelling tool (DeST) that accounted for the impact of the surrounding soil
539
environment was used to simulate the building’s energy performance in the case of a
540
prototype underground building. The simulation results of the indoor air temperature
541
for an underground meeting room were compared with the onsite long-term
542
measurement data, and yielded a good agreement, thus demonstrating that dealing
543
with the thermal process of an underground building using DeST is accurate and
544
feasible. Most importantly, the hourly heating and cooling loads were calculated by
545
DeST, the relationships between the annual energy consumption and the U-values of
546
the envelopes were detected for various climates in China. The following conclusions
547
can be drawn:
548
(1) The temperature waves between the indoor temperature of underground spaces
549
and the outdoor climate differ in terms of values, amplitude, and phase displacement,
550
owing to the high thermal capacity of the surrounding soil.
551
(2) Conversely, with respect to underground buildings, implementing a similar
552
building energy efficiency strategy manifested by the decrease in the U-values of the
553
envelopes (enhancing the thickness of thermal insulation), may result in an increased
554
energy consumption when the thermal performance of the envelopes is designed for
555
underground buildings.
28
(3) An improvement in the thermal performance of the roof plays an important role
557
in reducing the energy demands for the underground office building. The energy
558
efficiency requirements of roofs for the underground office buildings show
559
consistency with the standard adopted for buildings that are above the ground
560
(4) The optimal U-values of an exterior wall for underground office buildings are
561
completely different in the various climatic zones in China. For SCZ and CZ, the
562
optimal U-values are 0.8 W/(m2·K) and 1.0 W/(m2·K), respectively, while for
563
HSCWZ and TZ, the recommended optimal values are in the range of 1.5–2.0
564
W/(m2·K). In terms of the building energy efficiency, thermal insulation is not
565
required for HSWWZ.
566
These conclusions were drawn for soil-buried office buildings and the
567
recommendations for optimal design U-values of building envelopes may not be
568
suitable for other building functions. A further study should be carried out to
569
investigate the impact of the thermal performance of building envelopes on annual
570
energy consumption for various building functions, such as underground shopping
571
malls, parking space, railways, hospitals, etc. In addition, the contact surface area of
572
building with the earth plays a key role in heat transfer with underground buildings,
573
and thus it is necessary to study the impact of contact surface area of building with the
574
earth on the energy consumption and the optimal U-values of building envelopes, and
575
further to correct these optimization results.
576 577
29
5 Acknowledgment
578
This study was financially supported by China Construction Engineering Design
579
Group Corporation Limited (CSCEC–2014–Z–1–2).
580
6 References
581
[1] Nezhnikova E. The Use of Underground City Space for the Construction of Civil
582
Residential Buildings [J]. Procedia Engineering, 2016, 165:1300-1304.
583
[2] Zhao JW, Peng FL, Wang TQ, et al. Advances in master planning of urban
584
underground space (UUS) in China[J]. Tunnelling & Underground Space Technology
585
Incorporating Trenchless Technology Research, 2016, 55:290-307.
586
[3] Yu RH, Ye QY. Review on the Development of Underground Shopping Mall in
587
China[J]. Studies in Sociology of Science, 2012, 3(1).
588
[4] Shan M, Hwang BG, Wong KSN. A preliminary investigation of underground
589
residential buildings: Advantages, disadvantages, and critical risks[J]. Tunnelling &
590
Underground Space Technology, 2017, 70:19-29.
591
[5] He L, Song Y, Dai S, et al. Quantitative research on the capacity of urban
592
underground space – The case of Shanghai, China[J]. Tunnelling & Underground
593
Space Technology, 2012, 32(11):168-179.
594
[6] Staniec M, Nowak H. Analysis of the earth-sheltered buildings' heating and
595
cooling energy demand depending on type of soil[J]. Archives of Civil & Mechanical
596
Engineering, 2011, 11(1):221-235.
597
[7] Delmastro C, Lavagno E, Schranz L. Energy and underground[J]. Tunnelling &
30
Underground Space Technology Incorporating Trenchless Technology Research, 2016,
599
55(2925):96-102.
600
[8] Alkaff S A, Sim S C, Efzan M N E. A review of underground building towards
601
thermal energy efficiency and sustainable development[J]. Renewable & Sustainable
602
Energy Reviews, 2016, 60:692-713.
603
[9] Al-Mumin AA. Suitability of sunken courtyards in the desert climate of Kuwait[J].
604
Energy & Buildings, 2001, 33(2):103-111.
605
[10] Barker MB. Using the earth to save energy: Four underground buildings [J].
606
Tunnelling & Underground Space Technology Incorporating Trenchless Technology
607
Research, 1986, 1(1):59-65.
608
[11] Christian JE. Cooling season performance of an earth-sheltered office/dormitory
609
building in Oak Ridge, Tennessee[J]. Klinicheskaia Meditsina, 1984,
610
162(12):7049-7057.
611
[12] Wang F. Mathematical modeling and computer simulation of insulation systems
612
in below grade applications. Conference Thermal Performance of the Exterior
613
Envelopes of Buildings; 1979.
614
[13] Liu J, Jiang Y, Jin Y A. Dynamic Model of Heat Transfer through Underground
615
Building Envelope[C]// International Conference on Intelligent System Design and
616
Engineering Application. IEEE Computer Society, 2010:649-652.
617
[14] Choi S, Krarti M. Thermally optimal insulation distribution for underground
618
structures[J]. Energy & Buildings, 2000, 32(3):251-265.
619
[15] Tinti F, Barbaresi A, Benni S, et al. Experimental analysis of shallow
31
underground temperature for the assessment of energy efficiency potential of
621
underground wine cellars[J]. Energy & Buildings, 2014, 80:451-460.
622
[16] Peng C, Wang L, Zhang X. DeST-based dynamic simulation and energy
623
efficiency retrofit analysis of commercial buildings in the hot summer/cold winter
624
zone of China: A case in Nanjing[J]. Energy & Buildings, 2014, 78(4):123-131.
625
[17] Nielsen TR. Simple tool to evaluate energy demand and indoor environment in
626
the early stages of building design[J]. Solar Energy, 2005, 78(1):73-83.
627
[18] Lin YH, Tsai KT, Lin MD, et al. Design optimization of office building envelope
628
configurations for energy conservation[J]. Applied Energy, 2016, 171:336-346.
629
[19] ASHRAE, ANSI/ASHRAE Standard 90.1—2010: Energy Standard for Building
630
except Low-rise Residential Buildings, ASHRAE, Atlanta, GA, 2010.
631
[20] Design Standard for Energy Efficiency of Public Buildings. China Architecture
632
and Building Press; 2015.
633
[21]Ma X, Cheng B, Peng G, et al. A numerical simulation of transient heat flow in
634
double layer wall sticking lining envelope of shallow earth sheltered buildings[C]//
635
International Joint Conference on Computational Sciences and Optimization. IEEE,
636
2009:195-198.
637
[22]Yuan Y, Cheng B, Mao J, et al. Effect of the thermal conductivity of building
638
materials on the steady-state thermal behavior of underground building envelopes[J].
639
Building & Environment, 2006, 41(3):330-335.
640
[23] Staniec M, Nowak H. Analysis of the energy performance of –earth-sheltered
641
houses with southern elevation exposed [J].
32
[24] Cui Y, Yan D, Hong T, et al. Comparison of typical year and multiyear building
643
simulations using a 55-year actual weather data set from China[J]. Applied Energy,
644
2017, 195.
645
[25] Yan D, Xia J, Tang W, et al. DeST — An integrated building simulation toolkit
646
Part I: Fundamentals[J]. Building Simulation, 2008, 1(2):95-110.
647
[26] Xie X, Jiang Y, Xia J. A new approach to compute heat transfer of
648
ground-coupled envelope in building thermal simulation software[J]. Energy &
649
Buildings, 2008, 40(4):476-485.
650
[27] Zhang H, Liu J, Li C, et al. Long-term investigation of moisture environment in
651
underground civil air defense work[J]. Indoor & Built Environment, 2016.
652
[28] Xie XN, Song FT, Zhang XL, et al. Building environment design simulation
653
software DeST (11): treatment of dynamic heat transfer through underground zone[J].
654
Heating Ventilating & Air Conditioning. 2005, 35(6):55-63.
655
[29] Organization of Chinese Architecture Standards Design Institute. Design manual
656
for air defense basement: HVAC[M].2006.