Research on Clustering based Meteorological Data
Mining Methods
Wei Tian1, Yuhui Zheng1, Runzhi Yang2, Sai Ji1, Jin Wang1 1 College of Computer &Software, Nanjing University of Information
Science &Technology, Nanjing 210044, China
2 National Meteorological Information Center, China Meteorological Administration, Beijing 100080, China
Abstract. This research progress of the clustering algorithms in meteorology in recent years is summarized in this paper. First, we give a brief introduction of the principles and characteristics of the clustering algorithms that are commonly used in meteorology. On the other hand, the applications of clustering algo-rithms in meteorology are analyzed, and the relationship between the various clustering algorithms and meteorological applications are summarized. Then we interpret the relationship from the perspectives of algorithms’ characteristics and practical applications. Finally, some main research issues and directions of the clustering algorithms in meteorological applications are pointed out.
1 Introduction
Managing and taking advantage of large mass of meteorological data is the basis for studying climate change as well as the key to improve the accuracy of prediction of disastrous weather. A growing number of technologies have been or will be intro-duced into the field of meteorology, in which the cluster analysis in data mining has occupied an important position in the study of meteorology. K-means and hierarchical methods are classical algorithms in cluster analysis and they are widely used in mete-orology. Some other clustering algorithms, such as DBSCAN (Density-based Special Clustering of Applications with Noise), EM (Expectation Maximization), SOM (Self-organizing Feature Maps), FCM (Fuzzy C-means Clustering), SA (Simulated Anneal-ing), WaveCluster and graph clustering, also perform well in some special meteoro-logical applications.
We analyze the applications of commonly used clustering algorithms in meteorol-ogy in order to make better use of clustering algorithms in meteorolmeteorol-ogy, and summa-rize the distribution and characteristics of clustering algorithms in meteorological applications. Then we interpret the results from the perspectives of characteristics of the algorithms and practical applications.
2 Problem Definition
The cluster analysis of meteorological data, both observed and model-generated, pos-es a number of unique challengpos-es: (i) the data is spatially and temporally correlated, (ii) the data is potentially noisy, (iii) massive quantities of data are available for mining, etc. Common data types in cluster analysis mainly contain interval-scale variables, binary variables, categorical variables, ordinal variables, ratio-scaled variables, varia-bles of mixed types and vector objects. There are some commonly used distance measures, for example, Euclidean distance, Manhattan distance, Minkowski distance, Chebyshev distance, Mahalanobis distance, Hamming distance and correlation coeffi-cient [1]. Different measure methods have different features and advantages. Thus, in a specific meteorological application, combined with the data characteristics, choosing the appropriate clustering algorithm is the premise of successful experiments.
3 The commonly used clustering algorithms in meteorology
At present, many clustering algorithms are discussed [2]. But few clustering algo-rithms can be used in meteorology. In the rest of this section, clustering algoalgo-rithms that are commonly used in meteorological applications are summarized briefly from the perspectives of principles and characteristics. Partitioning clustering: Given a dataset with n objects, a partitioning method classifies the data into k groups. Then an iterative relocation technique is used to improve the partitioning. The process stops until the criterion function converges.
The k-means algorithm [3] is a prominent partitioning clustering. It chooses k initial centroids where k is a user-specified parameter. Hierarchical methods organize data into a hierarchical structure according to the proximity matrix. They can be further classified as agglomerative methods or divisive methods, based on how the hierar-chical decomposition is formed. Agglomerative clustering [4] starts with N clusters and each of them includes exactly one object. Based on different definitions of dis-tances between two clusters, there are mainly five agglomerative methods including single linkage, complete linkage, average linkage, median linkage and ward’s method.
EM and SOM are two popular methods of model-based clustering. EM [5] is a popular iterative refinement algorithm for finding maximum likelihood estimate of parameters in statistical models, where the model depends on unobserved latent varia-bles.
SOM [6] is a type of the artificial neural network that is trained using unsupervised learning to produce a low-dimensional, discretized representation of the input space of the training samples, called a map. It is one of the most popular neural network meth-ods for clustering analysis.
The method is particularly useful when a nonlinear mapping is inherent in the prob-lem itself. Just like the k-means, SOM also needs to predefine the number of the clus-ters, which is unknown for most circumstances.
In fuzzy clustering, data elements can belong to more than one cluster, and associ-ated with each element is a set of membership levels. Fuzzy clustering is a process of
assigning these membership levels, and then using them to assign data elements to one or more clusters.
FCM [7] is one of the most widely used fuzzy clustering algorithms. FCM is partic-ularly useful when the boundaries among the clusters are not well separated or ambig-uous. Moreover, the membership values may help us discover more sophisticated relations between a given object and the disclosed clusters. However, FCM suffers from the presence of noise and outliers. It is also difficult to identify the initial parti-tions.The basic objective of search techniques is to find the global or approximate global optimum for combinatorial optimization problems, which usually has NP-hard complexity and need to search an exponentially large solution space. Clustering can be regarded as a category of optimization problem. Give a set of data points, clustering algorithms aim to organize them into K subsets that optimize some criterion function.
4
The applications of clustering algorithms in meteorology
4.1 Climate change
The classification is a task of classifying regions based on similar basic characteristics and changes of meteorological elements. Cluster analysis techniques classify regions to study regional weather, climate change, prediction and prevention of extreme weather from aspects of wind, precipitation, temperature, clouds, pressure etc. At present the study of classification based on meteorological elements focus on k-means method, hierarchical method, DBSCAN method, SOM method and FCM method.
(1) K-means method: In 2009, Jiménez, P. A. et al. [8] classified the daily surface wind fields into wind pattern types with the combination of the complete linkage algo-rithm and an algoalgo-rithm similar to the k-means according to their spatial similarity over the Comunidad Foral de Navarra region. In the same year, Christos J. Lolis [9] ap-plied the k-means to the factor scores time series classifying the 56 years into six dis-tinct clusters that describe the main modes of spatial distribution of cloudiness. Then in 2011, İ brahim Sönmez et al. [10] applied the k-means to reclassify rainfall regions of Turkey[11] and investigated their temporal variability in relation to North Atlantic Oscillation.
(2) Hierarchical method: Robeson, S.M. et al. and J. Kysely et al. [12] classified homogeneous regions according to the temperature and precipitation by different hierarchical clustering methods respectively. In 2008, M. Burlando et al. [13] applied 15 different clustering techniques resulting from the combination of three distance measures and five agglomerative methods to study the wind climate of Corsica.
(3) DBSCAN method: In 2005, a data mining application based on DBSCAN was carried out on air temperature database and obtained clusters that have similar temper-ature trends [14].
(4) SOM method: In 2007, Reusch, D.B. et al. [15] analyzed the mean sea level pressure data from 1957 to 2002 with SOM method in order to study North Atlantic climate variability in general, especially the North Atlantic oscillation.
Atmospheric circulation has been topics of interest to climatologists for years [16]. It is the dominant factor in global climate and a wide range of weather situation as well as the background of the weather system activity on a variety of scales. Cluster analysis techniques analyze the characteristics and long-term changes of the atmos-pheric circulation as well as its relationship with the climate change. The clustering algorithms used in this field contain k-means method, hierarchical method, SA method and graph theory-based method.
(1) K-means method: In 2006, Esteban, P. et al. [17] applied PCA and the k-means to characterize the daily surface synoptic circulation patterns. The results are con-sistent with the subjective knowledge of the daily atmospheric circulation over the area.
(2) Hierarchical method: In 2007, EM and a traditional hierarchical agglomerative clustering method (HAC) were applied and generated distinctly different atmospheric patterns characterizing seasonal circulation over eastern North America.
(3) SA method: In 2007, Philipp, A et al. [18] proposed a new clustering scheme combining the concepts of simulated annealing and diversified randomization (ASNDRA) when exploring long-term variability of daily North Atlantic-European pressure patterns since 1850. The method is able to reduce substantially the influence of chance in the cluster assignment, leading to partitions that are noticeably nearer to the global optimum and more stable. Based on the former method, a representative set of patterns that fully characterize the different circulation types appearing in each season was generated [19], and in 2009 [20], it was used to classify daily pressure-pattern sequences and evaluate whether sequence classification is more suitable to describe surface air-temperature conditions in Europe.
4.2 Urban meteorology
Urban meteorology, including the city meteorological observation, urban atmospheric pollution, urban fine weather forecasting, is an important part of human life. High-impact weather research, air quality prediction and weather forecasting are the main applications of clustering algorithms in the field of urban meteorology.
Air pollutants, such as SO2, CO, O3, PM2.5, PM10, acid rain, acid fog, have a def-inite impact on human living conditions. At present, cluster analysis techniques are mainly used to study the impact of air pollution as well as the relationship between weather conditions and air pollution. The main clustering techniques in this field are the k-means, hierarchical method, the SOM and the FCM.
(1) K-means method: Cervone, G. et al. [21] and Li, L. et al. [22] investigated the impact of air pollution by k-means. In 2011, Alex Mace et al. [23] proposed adaptive k-means clustering algorithm that used both the trajectory variables and the associated chemical value. The air mass trajectories were clustered to identify source regions of certain chemical species.
(2) Hierarchical method: Joseph H. Casola et al. [24] identified weather regimes through different hierarchical clustering methods. S. Yonemura et al. [25] and Charbel Afif et al. [26] analyzed the characterization of pollutant gas concentrations by differ-ent hierarchical clustering methods. In 2011, Seungmin Lee et al. [27] applied an agglomerative hierarchical clustering algorithm based on the Ward's minimum vari-ance clustering criterion to the back trajectories to examine the origin of and favorable meteorological conditions for high concentrations of PM10 in Seoul, Korea.
4.3 Energy meteorology
Wind and solar energy are renewable resources, clean and environmentally friendly, with a broad development space and huge value. Rational use of meteorological re-sources, strengthening the development and utilization of wind and solar energy are some of the important ways to solve the energy problem as well as for energy saving. Cluster analysis techniques may be used for short-term wind power prediction. They can also assess the quality of energy so as to identify the locations which are optimal for energy power plant. The main clustering techniques in this field are k-means method and hierarchical method.
5
Discussion
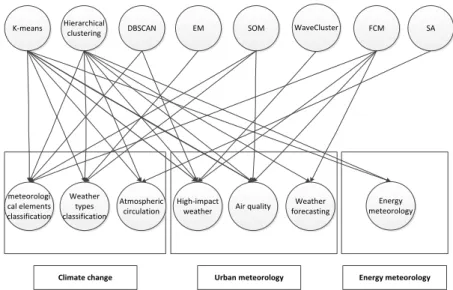
From the previous section, we can see the main distribution of clustering algorithms in meteorological applications. Then we give a simple summary of the distribution. The relationship between the clustering algorithms and its applications in meteorology are shown in Figure 1.
Hierarchical
clustering DBSCAN EM SOM WaveCluster FCM SA
K-means
Climate change
High-impact
weather Air quality
Weather forecasting meteorologi cal elements classification Weather types classification Atmospheric circulation Energy meteorology
Urban meteorology Energy meteorology
Combined the research in section 3 and Figure 1, we see summary from two aspects of clustering algorithms and meteorological applications.
In the term of the clustering algorithms, we can see that k-means and hierarchical methods are widely used in almost all the meteorological applications mentioned above for their typicality and distinct advantages. The applications are mainly in cli-mate change, urban meteorology, energy meteorology. FCM is a typical fuzzy cluster-ing algorithm. Compared to the hard division, it fits many special meteorological applications based on fuzzy partition. These special applications are mainly distribut-ed in urban meteorology. It is also applidistribut-ed to classify Indian meteorological stations into homogeneous groups due to its advantage of assigning every station with partial membership in each group. As a method of neural network, SOM is widely applied in high-dimensional data visualization application for it can represent all points in a high-dimensional source space by points in a low-dimensional target space and try to maintain the topology of the input space. Its applications are mainly in climate change, air quality and hydrometeorology.
For some other algorithms, such as DBSCAN, EM, WaveCluster, SA and graph clustering method, their applications are limited in solving specific meteorology issues. DBSCAN is now mainly used for identifying and tracking storm cell and studying the light flash characteristics. EM is particularly used to determine the typical weather types, while WaveCluster identifies the outliers in meteorological data. SA and Graph clustering are mainly applied to investigate atmospheric circulation and its impact on climate change.
In terms of meteorological applications and the real world, the clustering algo-rithms are mostly used in applications which are closely related to human life, such as urban meteorology and climate change. With the rapid development of society and technology, people are increasingly concerned about the quality of life and scientific production, forecasting, monitoring, etc. This is also verified that people propose or create a variety of techniques to meet the requirements of the humans, which is in line with the law of human and social development.
Acknowledgement.
The authors wish to thank the National Natural Science Foundation of China (41475091, 91337102, 41275093, 61402234, 61402235), the Natural Science Foundation of Jiangsu province (BK2012461, BK2011825), the Project Funded by the Priority Academic Program Development of Jiangsu Higher Education Institutions and the College graduate research and innovation projects of Jiangsu Province (2012). Dr. Wei Tian is the corresponding author.References
1. http://users.csc.calpoly.edu/~dekhtyar/466-Spring2009/lectures/lec09.466.pdf. Accessed on 15 April 2013.
3. J. MacQueen, L. M. L. Cam and J. Neyman. Some methods for classification and analysis of multivariate observations, Proceedings of the fifth Berkeley symposium on mathematical statistics and probability, (1967) June 21-July 18 and and December 27, 1965-January 7, 1966; Berkeley, California
4. F. Murtagh. The Computer Journal. 26, 4 (1983) 5. G. McLachlan and T. Krishnan. Wiley, 1, 997 (1997)
6. T. Kohonen, H. J. Trussell and V. Damle. Proceedings of the IEEE, 78, 9 (1990)
7. Y.H. Lu, T. H. Ma, C. H. Yin, X.Y. Xie, W. Tian and S. M. Zhong. International Journal of Database Theory and Application, 6, 6 (2013)
8. P. A. Jiménez, J. F. González-Rouco, J. P. Montávez, E. García-Bustamante and J. Navarro. International Journal of Climatology, 29, 4 (2009)
9. C. Lolis. Theoretical and Applied Climatology, 96, 3 (2009)
10.İ. Sönmez and A. Ü. Kömüşcü. Theoretical and Applied Climatology, 106, 3 (2011) 11.S.M. Robeson, and J.A. Doty. Journal of Climate, 18, 8 (2005)
12.J. Kysely, J. Picek, R. Huth. Studia Geophysica et Geodaetica, 51, 2 (2007)
13.M. Burlando, M. Antonelli and C. F. Ratto. International Journal of Climatology, 28, 5 (2008)
14.T. Bilgin and A. Ç amurcu, Editor, Advances in Information Systems, Springer Berlin Heidelberg, New York (2005)
15.D.B. Reusch, R.B. Alley and B.C. Hewitson. Journal of Geophysical Research: Atmos-pheres (1984-2012), 112, D2 (2007)
16.R. Huth,C. Beck,A. Philipp, M. Demuzere, Z. Ustrnul, M. Cahynov´a, J. Kysel´y,O. E. Tveito. Annals of the New York Academy of Sciences, 1146, 1 (2008)
17.P. Esteban, J. Martin-Vide and M. Mases. International Journal of Climatology, 26, 11 (2006)
18.A. Philipp, P. M. Della-Marta, J. Jacobeit, D. R. Fereday, P. D. Jones, A. Moberg and H. Wanner. Journal of Climate, 20, 16 (2007)
19.[19] D. R. Fereday, J. R.Knight, A. A. Scaife, C. K. Folland and A. Philipp. Journal of Climate, 21, 15 (2008)
20.A. Philipp. Theoretical and Applied Climatology, 96, 1 (2009)
21.G. Cervone, P. Franzese, Y. Ezber and Z. Boybeyi, F. Bonchi, B. Berendt, F. Giannotti, D. Gunopulos, F. Turini, C. Zaniolo, N. Ramakrishnan and X. Wu. Risk Assessment of At-mospheric Hazard Releases using K-means Clustering. Proceedings of IEEE International Conference on In Data Mining Workshops, (2008) December 15-19; Pisa, Italy
22.L. Li and S. Cheng. A Calculated Methodology of Regional Contributions Based on MM5-CAMx in Typical City: A 2006 Case Study of SO2 and Sulfate. Proceedings of the 4th In-ternational Conference on Bioinformatics and Biomedical Engineering, (2010) June 18-20; Chengdu, China
23.A. Mace, R. Sommariva, Z. Fleming and W. Wang, in Adaptive K-means for clustering air mass trajectories, Edited H. Yin, W. Wang and V. Rayward-Smith, Springer Berlin, Hei-delberg (2011), Vol. 6936, pp.1-8.
24.Joseph H. Casola, John M. Wallace. Journal of Applied Meteorology and Climatology, 46( 2007)
25.S. Yonemura, S. Kawashima, H. Matsueda, Y. Sawa, S. Inoue, and H. Tanimoto. Theoreti-cal and Applied Climatology, 92, 1 (2008)
26.C. Afif, A. L. Dutot, C. Jambert, M. Abboud, J. Adjizian-Gerard, W. Farah, P. E. Perros and T. Rizk. Air Quality, Atmosphere & Health, 2, 2 (2009)