COMPREHENSIVE TESTING OF
IMMINENT THREAT PUBLIC
MESSAGES FOR MOBILE DEVICES:
UPDATED FINDINGS
First Responders Group
AUTHORS Michele Wood Hamilton Bean Brooke Liu Marcus Boyd
COMPREHENSIVE TESTING
OF IMMINENT THREAT
PUBLIC MESSAGES FOR
MOBILE DEVICES: FINAL
REPORT
Prepared for
Department of Homeland Security
Science and Technology Directorate, Support to the Homeland Security Enterprise and First Responders Group
ACKNOWLEDGEMENTS
Our deep appreciation extends to the Department of Homeland Security Science and Technology Directorate First Responders Group, Office for Interoperability and Compatibility, Wireless Emergency Alerts (WEA) Research, Development, Test and Evaluation (RDT&E) Program, for sponsoring this work, especially program manager Denis Gusty. Further, we offer our gratitude to the emergency responders whose dedication and commitment ensure the safety of our families, our communities and our nation. This report is a tribute to their service.
For information about this publication or other START research, contact
NATIONAL CONSORTIUM FOR THE STUDY OF TERRORISM AND RESPONSES TO TERRORISM
8400 Baltimore Ave., Suite 250 College Park, MD 20740 Tel (301) 405-6600 [email protected] www.start.um d.edu
Table of Contents
Executive Summary ...i
1. Background ... 1
1.1 Key Findings from START’s Prior Research ... 1
1.2 New Research Questions... 2
Table 1. Research Questions by Research Phases ... 3
2. Research Design Overview ... 3
2.1 Exploratory Focus Groups ... 4
2.2 Experiments and Confirmatory Focus Groups... 4
Table 2. Phase IV experiments conducted and research questions asked ... 4
3. Exploratory Focus Groups ... 4
3.1. Exploratory Focus Groups: Recruitment and Composition ... 5
3.2. Exploratory Focus Groups: Scenario, Questions, Messages and Maps ... 5
Figure 1. Sample Map Tested in Exploratory Focus Groups ... 5
3.3. Exploratory Focus Groups: Findings ... 5
4. Experiments ... 11
4.1. Experiments: Method ... 11
Figure 2. Sample Message Tested in Experiments... 11
4.2. Experiments: Findings... 14
5. Confirmatory Focus Groups ... 17
Figure 3. Messages Tested in Confirmatory Focus Groups ... 18
5.2. Confirmatory Focus Groups: Scenario, Questions, Messages and Maps ... 18
5.3. Confirmatory Focus Groups: Findings Summary ... 19
6. Conclusions and Future Research ... 29
7. References ... 33
Appendix A: Exploratory Focus Groups’ Interview Guide, Messages and Maps... 34
Figure 1. Focus Groups’ Interview Guide for Apps, Hyperlinks and Maps ... 34
Figure 2. 1,380-character Message and Maps ... 35
Appendix B: Example Experiment Questionnaire... 37
Table 1. Experiments: Sample Description ... 54
Table 1. (Continued) Experiments: Sample Description... 55
Table 2. Experiments: Descriptive Statistics ... 56
Table 3. Experiment 1: Regression of 280-Character Message Outcomes on Message Content Order ... 58
Table 4. Experiment 2: Regression of 280-Character Message Outcomes on Message Source ... 60
Table 5. Experiment 3: Regression of 280-Character Message Outcomes on Map Features ... 61
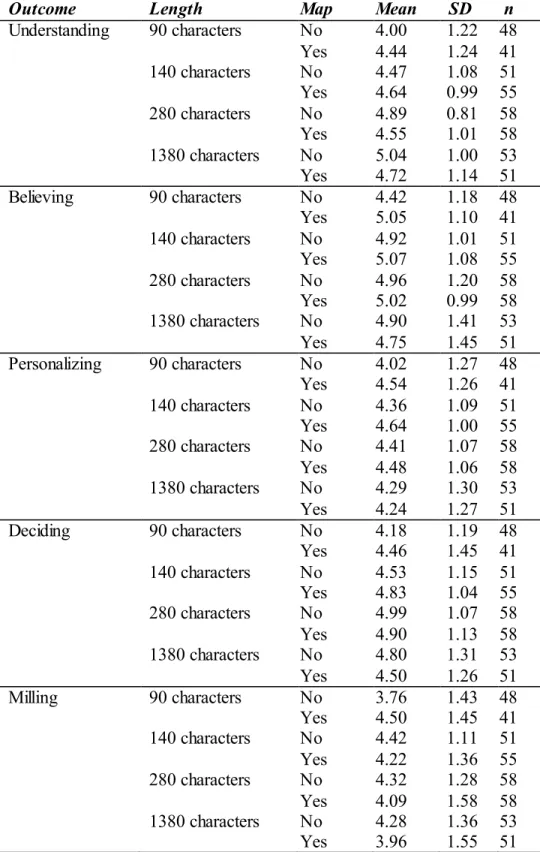
Table 6a. Experiment 4: Means and Standard Deviations for Message Outcomes by Message Length and Map Inclusion ... 62
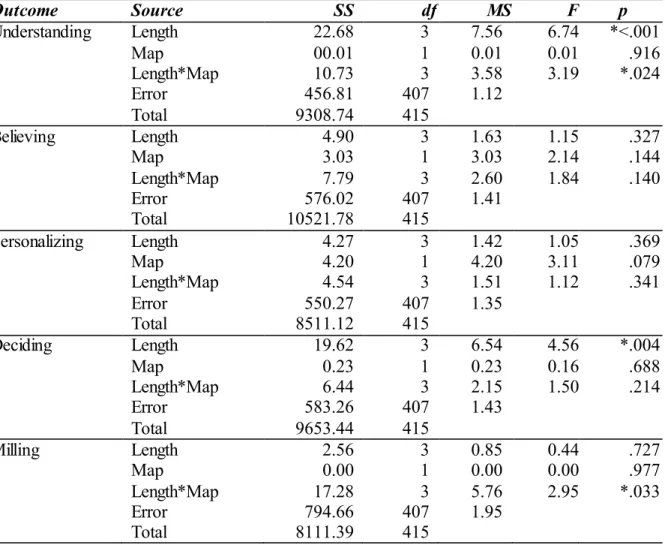
Table 6b. Experiment 4: Two-Way Analysis of Variance of Message Outcomes by Message Length and Map Inclusion ... 63
Figure 1. Experiment 4: Understanding by Message Length and Map Inclusion ... 64
Figure 2. Experiment 4: Belief by Message Length and Map Inclusion ... 65
Figure 3. Experiment 4: Personalization by Message Length and Map Inclusion ... 66
Figure 4. Experiment 4: Deciding by Message Length and Map Inclusion ... 67
Table 7. Experiment 5: Regression of 280-Character Message Outcomes on Message Elements ... 69
Table 8. Experiment 6: Regression of 280-Character Message Outcomes on Hazard Type ... 70
Table 9. Experiment 7: Regression of 280-Character Message Outcomes on Added Text ... 71
Table 10. Experiment 8: Regression of 280-Character Message Outcomes on General Links and Personalized Apps ... 72
Appendix D: Study Design ... 74
Table 1. Experiment 1 Design: Effect of Content Order ... 74
Table 2. Experiment 2 Design: Effect of Message Source... 75
Table 3. Experiment 3 Design: Effect of Different Map Features ... 76
Table 4. Experiment 4 Design: Effect of Amount of Information Provided—Length (90, 140, 280, 1,380 Characters) and Maps ... 77
Table 5. Experiment 5 Design: Effect of Different Message Elements ... 78
Table 6. Experiment 6 Design: Effect of Hazard Type ... 78
Table 7. Experiment 7 Design: Effect of Spending the Additional 190 Characters on Different Message Elements ... 79
Table 8. Experiment 8 Design: Effect of Including Links and Apps (general text, personalized text, maps) ... 80
Table 9. Text of Messages Tested in Experiments ... 81
Figure 1. Experiment 1 Messages ... 92
Figure 2. Experiment 2 Messages ... 94
Figure 3. Experiment 3 Messages ... 96
Figure 4. Experiment 4 Messages ... 98
Figure 5. Experiment 5 Messages ... 101
Figure 6. Experiment 6 Messages ... 103
Figure 7. Experiment 7 Messages ... 105
Figure 8. Experiment 8 Messages ... 106
Appendix E: Confirmatory Focus Groups Interview Guide and Messages... 112
Figure 1. Focus Groups’ Interview Guide for Optimized 280-Character WEA Messages ... 112
i
Executive Summary
This project sought to determine the optimized message content of imminent threat messages delivered over the Wireless Emergency Alert (WEA) Service should the length of future WEA messages be expanded from 90 to 280 characters. Previously, the research team conducted interview, focus group, experiment and survey research on the optimized message content of 90-, 140- and 1,380-character messages (Bean et al., 2014).1
This prior research found that 1,380-character messages appeared to produce optimized interpretation, personalization, and information seeking and sharing outcomes, and would likely yield maximized public protective action-taking behavior. Shorter messages that were 90- and 140-characters appeared less effective at guiding people toward protective action-taking, but these messages were rapidly distributed and quickly reached a large percentage of at-risk populations.
Given these prior findings, the research presented in this report investigated the following questions through six focus groups and eight experiments with the public:
1. Are 280 character WEA messages more effective than 90-character messages, and what is the best way to optimize character length should future WEA messages expand from 90 to 280 characters?
2. What is the best way to optimize maps, should future WEA messages have the capacity to include maps along with WEA messages, and what are the potential unintended consequences of including maps? 3. What is the potential added value (vs. unintended consequences) of including hyperlinks (i.e., web
addresses) with additional general or static imminent threat information should future WEA messages have the capacity to do so?
4. What is the potential added value (vs. unintended consequences) of providing mobile applications (apps) with additional personalized or dynamic imminent threat information, either along with a future WEA message or as a stand-alone product?
5. Do the findings generalize across hazards?
We selected 280-character messages for testing and comparison to 90-character messages based on industry and stakeholder feedback, and because 280-character messages are the maximum length that current “smart” phones can display in a single screen.2 Focus group and experiment research presented in this report led to the
following conclusions and recommendations regarding 280-character messages:
Message content order. Moving the source to the start of a WEA message is optimal; however, the optimal order for all WEA message content seems to depend on message length.
Message source. Local sources may not always be the best sources. Instead, well-known federal sources such as the National Oceanic and Atmospheric Administration (NOAA) and the National Weather Service (NWS) can be just as, if not more, effective.
Map elements. None of the map elements tested had a statistically significant effect on message outcomes, and research participants varied widely in their reactions to the tested maps. Maps can be useful in message
1 Bean, H., Liu, B., Madden, S., Mileti, D., Sutton, J., & Wood, M. (2014). Comprehensive testing of imminent threat messages for
mobile devices. Retrieved from http://www.firstresponder.gov/TechnologyDocuments/
Comprehensive%20Testing%20of%20Imminent%20Threat%20Public%20Messages%20for%20Mobile%20Devices.pdf.
2 The Communication, Security, Reliability, and Interoperability Council (CSRIC), a working group sponsored by the Federal
Communications Commission (October 17, 2014), recommended testing 280-character messages as the potential length for future WEAs.
ii
personalization, but the role they play varies based on message length.
Relative importance of content elements. The message elements of guidance (what to do and how to do it) and time until impact (how much time people have to take the recommended action) play major roles relative to other message elements in impacting the outcomes of public understanding and belief of the protective action recommendation, as well as the ability to decide how to respond.
Generalizing across hazards. Like shorter messages that are 90- and 140-characters, 280-character messages likely do not contain sufficient information to overcome people’s pre-alert and warning event perceptions of different hazards based on personal experience, and perceived risk and knowledge, which may or may not match the event they face. Hence, like 90- and 140-character messages, 280-character messages offer less to help effectively manage public protective action-taking than messages that are 1,380 characters.
Expanding message content. Should it become possible to expand the length of WEA messages in the future, it would be most important to expand the content areas communicating the hazard (what happened), guidance (what to do about it), and time until impact (when to do it). Expanding these three key message content areas is likely to result in the greatest impact on message outcomes and public warning response.
Effects of hyperlinks and apps. Including hyperlinks that display additional general information and using apps that provide more personalized information may be useful strategies for expanding the number of
characters available for crafting WEA messages, and can potentially lead to improved public message outcomes and warning response.
In conclusion, findings indicate that while not a magic bullet, 280-character messages clearly are more effective at communicating imminent threats to at-risk publics than are the current 90-character WEA messages. In addition, the order of the content contained in an alert – whether it be 90 or 280 characters – remains a critical consideration along with message source. Adding apps and hyperlinks to WEA messages appears promising, but merits additional research. Adding maps, as tested here for messages that are 280 characters in length, was not promising, but merits additional research. In sum, the best course of action may be to optimize WEAs as best as possible along with other hazard information sources.
1
1. Background
This project sought to determine the optimized message content of Wireless Emergency Alerts (WEAs) distributed for extreme weather events. WEAs are 90-character messages distributed via mobile devices for “extreme weather, and other threatening emergencies in your area,” AMBER alerts and Presidential Alerts during a national emergency.3
In practice, multiple WEA messages can be delivered across a weather event. Nevertheless, our research focus matches the general intention of the system: to view WEA messages as first alerts for imminent one-hour-to-impact threats. Consequently, we researched the first messages that would be distributed during an imminent threat weather event.
Previously, the team conducted eight experiments, seven focus groups, 50 think-out-loud interviews and a community event survey of a “real world” severe flood in Boulder, Colorado.4 In this prior research, three different message lengths were investigated:
90-character messages were the prime message length investigated since this is the message length delivered over today’s WEA service. WEAs identify: (1) the type of hazard, (2) the time and location, (3) the severity of the hazard, (4) what action to take and (5) the message source.
140-character messages were also investigated because these are possible today using social media (e.g., Twitter), and they may be possible using the WEA service in the near-term future.
1,380-character messages were investigated because messages of this length are possible today in the description and instruction fields of Emergency Alert System (EAS) messages, and they may be possible using the WEA service in the longer-term future.
1.1 Key Findings from START’s Prior Research
Key findings from the team’s prior research as summarized above include:Message length efficacy. Longer messages (i.e., 1,380-character messages) appeared to produce optimized interpretation, personalization and milling outcomes, and would likely yield maximized public protective action-taking behavior. Shorter messages that are 90 and 140 characters appeared less effective at guiding people toward protective action-taking. However, 90-character WEAs were rapidly distributed and quickly reached a large percentage of at-risk populations, as found in the team’s community event survey. What is likely the case is that people need to be provided with sufficiently detailed information about exactly what steps to take to protect themselves, and the number of characters needed to accomplish this likely varies across hazards.
Message content order. A different order for the content contained in 90-character WEA messages may improve public response outcomes. WEA messages currently use the following order: hazard, location, time, guidance and source. An alternative order had an advantage in improving the public outcomes tested: source, guidance, hazard, location and time. Although this alternative order only had a statistically weak advantage over the
3FEMA (n.d.). Wireless Emergency Alerts. Retrieved from https://www.fema.gov/wireless-emergency-alerts.
4 Bean, H., Liu, B., Madden, S., Mileti, D., Sutton, J., & Wood, M. (2014). Comprehensive testing of imminent threat messages for
mobile devices. Retrieved from http://www.firstresponder.gov/TechnologyDocuments/
2
current WEA message content order, if put into practice, the effect of the revised order could be substantial considering how many more people in a population at risk might be inclined to take action in response to the revised order. The qualitative research provided support for this optimized message order for 140-character messages; however, it does not appear to transfer to 1,380-character messages for which the optimized order seems to be source, hazard, guidance, location and time.
Message source. Source in 90-character messages had a statistically significant effect on some public response outcomes including interpretation (understanding, believing and deciding) and personalization, and, hence, likelihood of protective action-taking. Quantitative and qualitative findings also suggested that local and
recognizable sources might be the most productive sole source to name in a WEA message, but further research is needed to confirm these conclusions. Findings, however, did more conclusively suggest that if a sole source named in a WEA message was not recognizable to the public, then a vigorous public education and marketing campaign would be worthwhile. Quantitative findings also suggested that there may not be a single sole source that works for all WEA messages. The same conclusions were reached based on qualitative investigations of 140 and 1,380-character messages.
Inclusion of a hyperlink. Consideration should be given to including a hyperlink with additional information in wireless emergency alert and warning messages of any length. Doing so would be consistent with the long-standing historical observation that people who are warned engage in a search for additional information before taking a protective action, and this was reinforced in our focus group research. Findings from a community event survey also indicated that those who received a message with a hyperlink had a shorter delay (i.e., less milling) before beginning to check media compared to those who did not receive a message with a hyperlink. Delay time before avoiding flood areas was also shorter for those who received one or more messages containing a hyperlink (compared to those who did not).
Map inclusion. In the team’s experiments, high information map inclusion (specifying the areas affected, areas not affected and the receiver’s location) in 90-character messages had a statistically significant and positive effect on public response outcomes including interpretation and personalization, and, hence, could have a positive effect on protective action-taking. Inclusion of a low information map (specifying the areas affected and not affected, but not the receiver’s location) had the opposite effect. Results from focus groups indicated that inclusion of a high information map improved most participants’ understanding, belief and risk
personalization across all message lengths. The community survey confirmed the relationship between receiving maps and increased personalization. These findings suggested that there would be a benefit from adding a high information map to a 90-character WEA message. Doing so could help the public interpret and personalize the worded message, which could move more people at risk to take protective action.
Generalizing across hazard types. Short 90- and 140-character messages were substantially less effective than 1,380-character messages at helping people overcome their pre-conceived perceptions about different hazards and likely would be less effective at guiding people to take protective actions appropriate to the risk they face in an actual event. The content elements of 1,380-character messages had standardized effects on outcomes
regardless of hazard type (generalized across hazards). However, 90- and 140-character messages did not. Shorter messages do not appear to contain sufficient information to help people overcome their preconceptions about different hazards based on their personal experience, perceived risk and knowledge, which likely will not match the event they face.
1.2 New Research Questions
3
1. Are 280 character WEA messages more effective than 90-character messages, and what is the best way to optimize character length should future WEA messages expand from 90 to 280 characters?
2. What is the best way to optimize maps, should future WEA messages have the capacity to include maps along with WEA messages, and what are the potential unintended consequences of including maps? 3. What is the potential added value (vs. unintended consequences) of including hyperlinks (i.e., web
addresses) with additional general or static imminent threat information should future WEA messages have the capacity to do so?
4. What is the potential added value (vs. unintended consequences) of providing applications (apps) with additional personalized or dynamic imminent threat information, either along with a future WEA message or as a stand-alone product?
5. Do the findings generalize across hazards?
We answered these questions through focus groups and experiments (see Research Design Overview section, below, and Table 1, below).
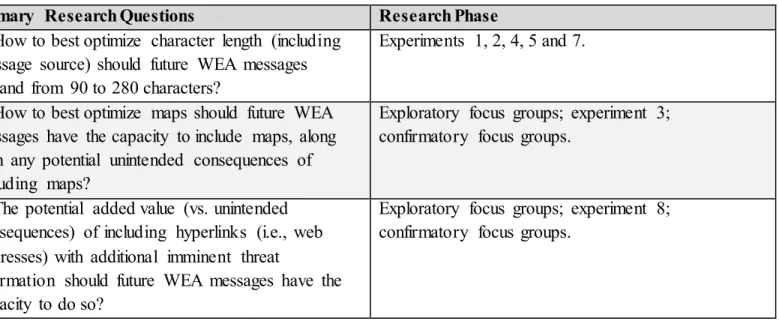
Table 1. Research Questions by Research Phases
Primary Research Questions Research Phase
1. How to best optimize character length (including message source) should future WEA messages expand from 90 to 280 characters?
Experiments 1, 2, 4, 5 and 7.
2. How to best optimize maps should future WEA messages have the capacity to include maps, along with any potential unintended consequences of including maps?
Exploratory focus groups; experiment 3; confirmatory focus groups.
3. The potential added value (vs. unintended consequences) of including hyperlinks (i.e., web addresses) with additional imminent threat
information should future WEA messages have the capacity to do so?
Exploratory focus groups; experiment 8; confirmatory focus groups.
2. Research Design Overview
This multi-method project involved qualitative and quantitative research to determine how to optimize 280-character WEAs designed to alert the public to an imminent severe weather threat. First, two exploratory focus groups were conducted to test a tsunami warning. Next, the initial focus group findings were examined in a series of eight online experiments. This included testing flood and tornado hazards based on expert
stakeholders’ recommendations regarding hazard selection for this project, which allowed us to confirm
whether findings are generalizable to multiple hazards.5 Finally, two confirmatory focus groups, defined below, were conducted to review and expand on the experimental findings.
5 Electronic communication on October 31, 2014 with Denis Gusty, DHS S&T First Responders Group, and Mike Gerber, NOAA.
The team also consulted via telephone with Dr. Dennis Mileti, Professor Emeritus at the University of Colorado, Boulder along with Kate Long and Kevin Miller from the California Office of Emergency Management (October, 2014).
4
2.1 Exploratory Focus Groups
The initial focus groups were conducted to explore mostly non-message components of expanded 280-character WEA messages. Specifically, map features, hyperlinks and app features were examined, as described later in this report.
2.2 Experiments and Confirmatory Focus Groups
A series of experiments was conducted to build on the focus groups’ findings and as a follow-up to the team’s prior research on how to optimize 90-character mobile alert messages. The primary purpose of these
experiments was to test whether previous findings about optimizing 90-character messages also applied to 280-character messages. Two new research questions also were included. Specific research questions and how they were addressed are detailed below.
Table 2. Phase IV experiments conducted and research questions asked Experiment
Number Research Question
1 What is the optimal content order to include in 280-character WEA messages? 2 What is the optimal message source to include in 280-character WEA messages? 3 What effect do different map features have on 280-character WEA outcomes?
4 What is the effect of message length and map information on 280-character WEA outcomes? 5 What is the relative importance of 5 different message elements in 280-character WEA
messages?
6 How do 280-character WEA message outcomes compare across different types of hazards? 7 What is the most effective way to “spend” the additional 190 characters when we expand
WEA messages from 90 to 280 characters?
8 What effect does including hyperlinks to static and dynamic full text messages and maps have on 280-character WEA outcomes?
Finally, confirmatory focus groups were conducted based on experimental findings to assess participants’ overall reactions to optimized 280-character messages.
3. Exploratory Focus Groups
Two focus groups were conducted to explore mostly non-message components of expanded 280-character WEA messages. Specifically, map features, hyperlinks and app features were examined, as described in this section.
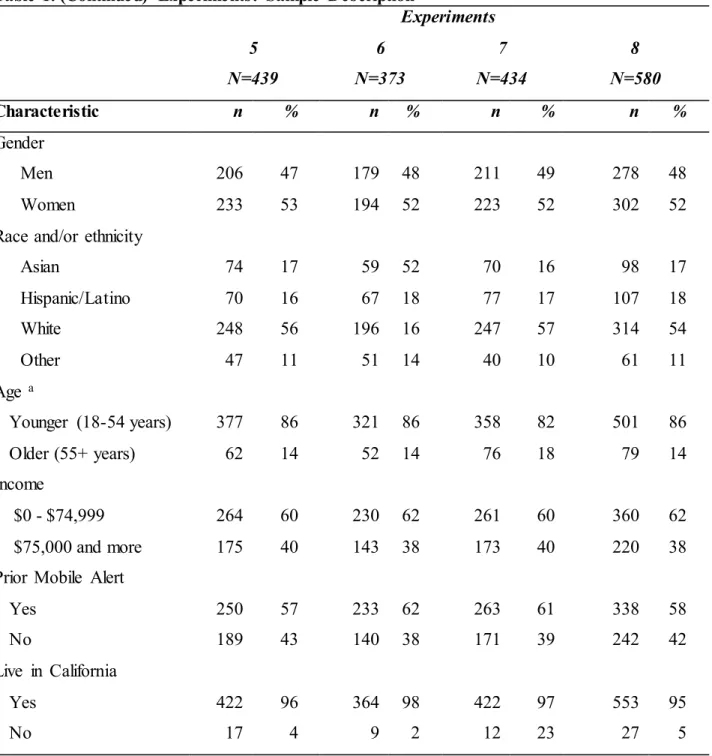
5
3.1. Exploratory Focus Groups: Recruitment and Composition
Focus group participants were recruited from residents within and around Denver, Colorado via anadvertisement placed on the Denver Craigslist Community page. The optimal size and duration for a focus group session is 6-12 participants and 1-2 hours. The exploratory focus groups totaled 12 participants, six in each session, which lasted 1.5 and 1.8 hours, respectively. The sessions occurred in the Communication Department conference room at the University of Colorado Denver and were moderated by the project’s lead qualitative researcher. All participants were compensated with a $50 Visa gift card. The sessions were audio recorded and transcribed by a trained graduate student, but no personal identifiers were collected beyond basic demographic information.
3.2. Exploratory Focus Groups: Scenario, Questions, Messages
and Maps
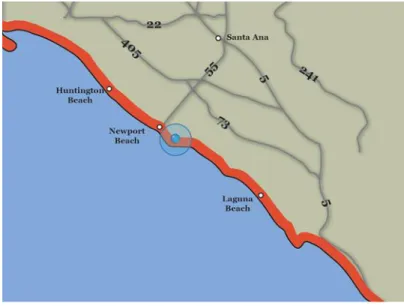
Focus group participants were first provided a tsunami scenario. Specifically, they were asked to imagine that they were on vacation in Southern California, shown a map of the area, and told that they were spending the afternoon at the beach in Corona Del Mar, just south of Newport Beach. The imagined time was 1:15 p.m. They were told to imagine that an alert appeared on their cellphone stating that a tsunami would soon strike the Orange County coastline. See Appendix A, Figures 1 and 2 for the focus groups’ full interview guide and messages and maps tested. See below for one sample map.
Figure 1. Sample Map Tested in Exploratory Focus Groups
3.3. Exploratory Focus Groups: Findings
In this section, we report the focus groups’ findings, which contributed to the experiments’ design. Coding was conducted using NVivo 10, a software package that facilitates systematic thematic analysis. Coding focused on the study’s primary research questions. Using a scissor-and-sort technique (Stewart & Shamdasani, 2015), similarities and differences in participants’ stated responses to the messages were grouped and analyzed for recurring themes in order to answer the research questions.
6
Information needs. Participants were asked, “In a tsunami scenario, what information do you think you would need in order to be able to protect yourself?” Participant responses included:
1-click notification of contacts about one’s safety. Closest evacuation transportation available. Current location of the tsunami.
Definition and description of a tsunami. Distance inland needed to stay safe. Evacuation routes.
Evacuation traffic flow.
Information about how long the event will last. Information about what to do about kids in school. Instructions to “seek higher ground.”
Latitude, longitude and origin of tsunami. Location of communication center. Location of emergency services. Location of evacuation shelter(s). Location of roadblocks.
Map with impact zones, one’s location, safe zones, evacuation routes and emergency services providers. Safe areas.
Seriousness of the tsunami alert.
Severity of the tsunami and what will occur. Source of tsunami alert.
Strength and characteristics of the tsunami. Time of alert and tsunami detection. Time of the tsunami impact.
Weather patterns.
Participants were also asked, “From where, ideally, would you like to obtain that information (and why)?” In this scenario, participants wanted to receive the information via their phone (website, app or text), mass media channels (TV and radio) and lifeguards on the beach. Participant comments included:
So, like, an Amber Alert, for example, that would come up and be here and then also [in] lights, or on a billboard or something.
I would think if there was a tagline in the alert that referenced you to a radio station. Because I think it’s nice to have real information—real-time information—on your phone, but I think when you’re listening to a radio station, you’re just hearing it over and over and over, and when it’s a blizzard alert, or whatever. And if there was a tagline in that, that referenced you to dial into—and if it didn’t just say, “Tune into the radio to find out,” but if it told you, you know, “Tune into this radio
station,” I think that lends volumes of credibility to it instantly.
I think the more sources you can receive the information from, the more legitimate it seems.
Current application (app) use. Participants were asked, “Do you currently use any disaster preparedness and/or severe weather apps and, if so, which ones and why? If not, why?” No participants currently used disaster preparedness apps. Many used weather apps for typical reasons (planning outdoor activities, etc.). Participant comments included:
7
I use a weather app that updates itself: forecast, temperatures. I use the news apps, not a straight weather report.
I have the CDOT application, for road conditions.
Potential WEA apps. Participants were asked: “Would you be likely to open a mobile application with
additional information and, if so, would you download this app or would you need the government to send it to you with a WEA message? If you would be unlikely to open a mobile application with additional information, why not?” In the first focus group, one participant explained that he would be “pissed” if the alerting authority required or requested an app download during an emergency situation. Other participants agreed with the sentiment. Most indicated that they would need to have downloaded the app prior to the event to be comfortable using it.
Additionally, some participants would want to check out the credibility and usefulness of the app before the event. Some would still seek additional and confirming information even if they had an app installed. A few participants stated that it would be helpful to have an app already installed on the phone at the time of purchase. Nobody in the second focus group indicated that they would download an app during an emergency. Participant comments included:
Yeah, I would want to know about the credibility. Either my friends have used the application, or have access to being able to read the ratings online. And under emergency circumstances, you may not have access to that information.
I’m thinking, ‘This could be spam.’
I would like for it to already be on my phone.
As exemplified in the quotes above, for the second focus group, people explained they would prefer an app to be already installed at time of purchase. If a high-profile public awareness campaign about the app were conducted, combined with good word-of-mouth recommendation, participants would go to the app store to download it. Prior download would also hinge on one’s perceived susceptibility to hazards. One participant suggested linking or combining it with a trusted app like weather.com.
When asked whether they would download an app (prior to the emergency) that provided the same information in the 1,380-character message plus the additional information, in dynamic form that was requested, five participants in the first focus group stated they would download it. The sole holdout stated he would expect such an app to already be installed at time of purchase.
In the second focus group, if the desired information were included, all participants indicated that they would prefer having the app instead of a link to the static 1,380-character message. However, these participants stated that they would need authoritative, trusted and repeated messaging before they would be motivated to download it.
Finally, participants provided the following additional feedback regarding apps: Address the texting and driving issue in some states that prohibit it.
Enable configurable preferences in an app to accommodate information seekers and those who want to avoid information overload.
Ensure the non-dominant groups have access and can use these technologies. Make sure the app does not count heavily against storage limits.
8 Provide app tutorials and/or training.
Additional information via a hyperlink or app. Participants were asked: “In a URL (i.e., hyperlink) or app, what additional information would be ‘critical’ for you to have? What information would be ‘nice’ to have? What information would be ‘unnecessary?’” Most, but not all, of the information listed above under information needs was deemed critical to have in a hyperlink or app. For example, some participants deemed “unnecessary” features to include the latitude and longitude of the hazard, information about how to be reunited with children, the location of the nearest airport, and a “1-click contacts notification” feature.
Participants were also asked, “Does it make a difference whether additional information is provided via a hyperlink versus an app? Why or why not?”In the first focus group, two people stated that they would prefer to have additional information available via an app, while four people preferred a hyperlink to a webpage.
Perceived drawbacks to apps included, “too many bells and whistles, too many updates, too many things… inconsistent… problematic….;” “I just prefer a webpage;” and “Storage space… sometimes apps are
unreliable.” Perceived benefits of apps included potential dynamic content based on Global Positioning System (GPS) integration. A static webpage might not be updated quickly enough. Apps could be much faster in conveying updated information. However, in the tsunami scenario, four participants claimed they would click on a hyperlink for additional information, but all claimed that they would not click on a link to download an app.
Information sufficiency. Participants were asked, “How useful and sufficient is the 1,380-character message?” Some participants in the first focus group found the information sufficient. Others requested the following:
Cities, towns, beaches and infrastructure impacted. Configurable preferences.
Evacuation routes described.
Locations of safe areas (specific distance or miles inland).
More instruction on what to do to either protect yourself or help others. Safe floors in a high rise building.
A few participants thought the message was sufficient, but others thought it would cause panic (especially the “run” message in response to the seafloor being exposed). Some thought the organization of the message could be improved. In the second focus group, participants requested:
A map indicating areas affected, safe zones, roads and evacuation routes, and other details. Clarification on how receivers will know that they are in the area at risk.
Links or dropdowns to additional information and detail. Run-up zones indicated.
“Tsunami Warning” needs to be at the top of the message. Overall participant comments included:
I think it has all the information that we need—well, what information we asked for on the board. I do not know what a tsunami run-up zone is. Like, what the hell is that?
What question came to mind for me is, what cities and towns are included in the warning. Also, on the infrastructure, which highways—roads—as well as beaches would be affected by this warning?
Maps. Participants were asked: “Do you use maps on your smartphone and if so, why, and if not, why?” Every participant used maps on their smartphone, mostly for navigation and directions. In addition, almost every
9
participant stated that he or she would respond positively to a map on their smartphone during the tsunami scenario. Two participants in the second focus group were indifferent, believing that if textual information were sufficient, the map would be unnecessary.
Participants appreciated the speed and amount of information conveyed via a map: “A picture is worth a thousand words.” Some participants speculated that people who “don’t like being told what to do,” are “not visual,” or have difficulty readings maps would probably respond negatively. When asked what they would do next, following map receipt, participants in the first focus group said: “Google it;” “look to another human being;” “get in the car and go northeast!;” “look for corroboration from those around me;” or agreed with others. In the second focus group, some participants were concerned that a static map on a smartphone would cause confusion about whether the issuer really knew the receiver’s location: “If it was not animated (the blue dot), I would not understand what is going on.” Participant comments included:
I think the map would be pretty vital for me. Just maybe an expectation of what could the map look like—like, where’s it going to hit—in addition to all the important information you need for
evacuation.
I would like to see it. Instead of just pushing for it to go somewhere else, I want it to be right then and there when I get all the information.
That would make things much faster, so yes, I would like to see that there.
Despite the enthusiasm for the maps, there was not a consensus on which of the maps displayed during the focus groups was most understandable. In addition, the maps did not always seem to produce the desired results. For example, participants further explained that if they were not near the indicated hazard area they would likely not take action. The closer one was to the hazard area, the more likely it was that he or she would take some type of action or more closely monitor the situation. Participants acknowledged that some people (but not themselves) would likely be tempted to observe the tsunami. Participant comments included:
There will always be people that do that.
A lot of thrill seekers, like, they have those tornado chasers. Maybe some people would like to see that.
I hope not!
In terms of the map design, no participants found the grayscale maps more understandable or believable than the color maps. The lack of contrast in the grayscale maps created confusion for some participants, especially regarding the land or sea border and the hazard area. The colorful maps communicated more information more clearly, for the participants. One participant explained that if he received a black and white map on his
smartphone during an emergency, he would be upset due to a perceived lack of technological sophistication. “If you have a color device, why would it not be in color?” said one. Also, some participants indicated that they did not understand the maps.
In terms of the boundary lines, almost all of the participants found the thick line more understandable than the thin line. However, a couple of people mentioned that the thin line showed that the area of danger extended inland in a way that the thick line did not. Some were concerned, however, that the thin red line too closely resembled the highway, so it was unclear what the line signified. When asked explicitly what the thick red line meant, four participants in the first focus group said “danger zone.” However, one participant explained that it was too uniform and consistent for her to believe it.
10
In the second group, one participant explained that the thick red line was the strike zone, and others agreed, although one stated that the third map showed the hazard extended inland. However, this group also believed that the blue dot signified the point of impact, although some suspected it might be their location. One
participant in the second focus group explained that even if he was pretty far away from the thick line, he would still be concerned due to the vagaries of technology.
For the location marker on the maps, four participants in the first focus group believed that the location marker referred to them, while one was sure it was the impact zone, and another was unsure whether it signified the impact zone or themselves. In the second focus group, all of the participants believed that the blue dot signified the tsunami impact point, but some also suspected it might signify them. One participant in the first group said that the color of the marker blended in too much with the ocean color. Another participant, however, thought that the blue shaded area around the dot signified an area of extreme danger and should be colored red. When asked how we (the research team) could better indicate that the location marker signified one’s location, participants in the first focus group said use a “standard graphic for a GPS,” “you are here,” a stick figure pedestrian, or words above the map that say the blue dot indicates “your location.” The one participant who believed that the location marker signified his location explained that everyone knows that a pulsing blue dot meant one’s location. When another participant noted that the dot was not pulsing, the participant was still “ok with it.” In the second focus group, some said, “You are here” would explain the marker. Another person said, “Include a star.” One did not understand what the blue shaded area around the dot signified. Most of these participants said that even if the dot was pulsing, they would not necessarily assume it was them.
When asked what we (the research team) could do to communicate that a receiver was in the area at risk, participants stated: “add a standard symbol or wording;” flashing “danger;” a radius of danger based on color; and traffic icons. When asked how their decision-making would change if the phrase “You are in the area at risk” was included, in the first focus group, two stated that it would not influence their actions. One person stated, “I’d leave.” Another said, “I’d leave faster,” and others agreed. The second focus group believed they were in the area at risk. A few said that the words would clarify, while others said they already believed they were at risk and did not need the words. Finally, the participants provided additional feedback regarding the tested maps, as follows:
Add a map key.
Add an explanation of the map’s elements.
Add instructions on how to stay out of the way of others who might make it if I am going to die. Add something textual saying, “You are in the danger area.”
An animated icon that better indicated that one should leave the area. A map better indicating safe areas.
Include a sentence: “Impacted area shaded in X below.” Indicate safe locations in green.
Put an icon of where recipients should go (Others did not like being told what to do, however).
Use shading more effectively to indicate higher risk and lower risk areas (Others speculated that could be misleading).
Use red shading in terms of severity (or use terror code threat spectrum). Use a topographical map to show high ground.
Taken together, the exploratory focus groups’ findings were used to help design the study’s experiments, presented in the next section.
11
4. Experiments
Eight experiments were conducted to determine whether or not the findings from the team’s prior research on 90-character WEA messages also apply to 280-character WEA messages (experiments 1-6). Two additional experiments were conducted to expand on prior research (experiments 7-8). The first of these sought to
determine the most effective way to make use of the extra characters afforded by a 280-character WEA message (experiment 7). The second examined the potential utility of adding links, including general or static
information, and apps, including personalized or dynamic information as a means of circumventing the 280-character limitation, and providing a full 1,380-280-character message (experiment 8). The experiments’ methods and results are discussed below. An example questionnaire is in Appendix B. The questionnaire varied slightly for each experiment given each experiment’s prime focus.
4.1. Experiments: Method
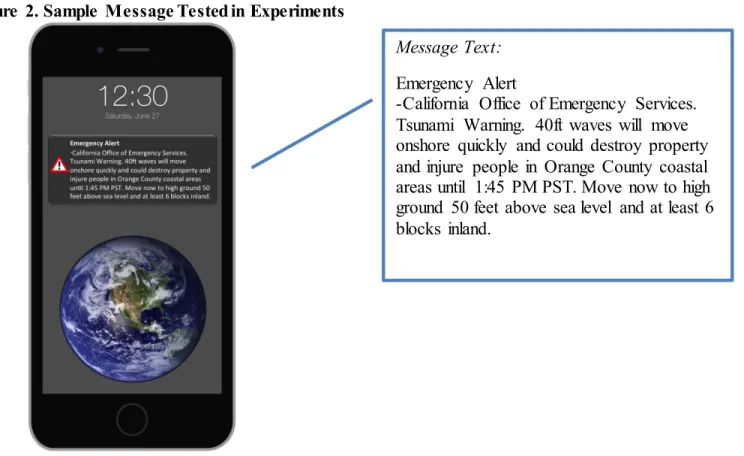
Eight experiments were conducted using a posttest only randomized design to replicate and expand on the team’s prior research. Participants were randomly assigned to conditions; the experiments tested the relative effectiveness of different message features. For all experiments except for experiment number 7, messages described a tsunami event. For experiment number 7, messages were compared for three different hazards— tsunami, flood and tornado. Data were collected using SurveyMonkey software. See Figure 2, below for a sample message.
Figure 2. Sample Message Tested in Experiments
Sample. For the experiments (N = 3,532), eight volunteer samples were drawn from SurveyMonkey, which generated online survey audience panels of individuals recruited for experiment participation in exchange for
Message Text:
Emergency Alert
-California Office of Emergency Services. Tsunami Warning. 40ft waves will move onshore quickly and could destroy property and injure people in Orange County coastal areas until 1:45 PM PST. Move now to high ground 50 feet above sea level and at least 6 blocks inland.
12
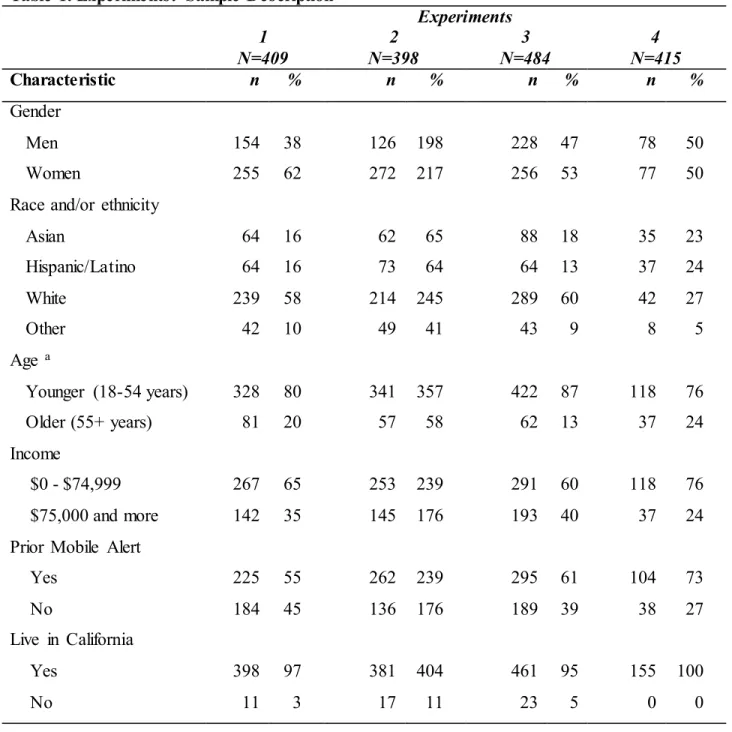
“points” in a no-cash, point system of rewards, including sweepstakes and merchandise.6 Invitations were sent to help ensure sufficient cell sizes for gender and race and/or ethnicity. To be eligible to participate in this study, individuals had to be: (1) 18 years of age or older, (2) U.S. residents, (3) English speakers and (4) have a working cell phone. Descriptions of key sample characteristics for all experiments are presented in Appendix C, Table 1.
Measures. The online questionnaire included minor revisions to the questionnaire that was designed for and used in the team’s prior research. The questionnaire incorporated standard questionnaire items used in prior research7 when they existed and there was evidence that the items had performed well. In some cases, existing items were adapted to the particular context of the project. (See Appendix B for an example of the questionnaire used in the experiments.) The questionnaire took about 15 minutes to complete and contained mostly closed-ended questions, with a few open-closed-ended items. It was pretested (N = 19) to identify any potential problems with programming, skip rules and question flow, and minor corrections were made.
Outcome Measures. The historical record of public response to alerts and warnings research guided selection of the items used in the team’s prior research to indicate optimized outcomes. These were factors documented in prior research to intervene between receipt of an alert or warning message and initiating a protective action. Two general categories of outcomes were investigated: perception (Lindell & Perry, 2012; Mileti & Sorensen, 1990) and milling (Drabek, 1969; Griffin, Dunwoody, & Neuwirth, 1999; Mileti & Fitzpatrick, 1992).
Perception Outcomes. These are the perceptions that intervene between people receiving an alert or warning message and initiating a protective action. They are the perceptions people form to make personal sense—others call it sensemaking—out of a received alert or warning message. The perception outcome variables examined were:
Understanding: attaching a personal meaning to the received warning message; Believing: determining if the risk, warning and message contents are accurate;
Personalizing: coming to think that one is no longer safe and that the given warning is aimed at oneself; and
Deciding: forming an idea about an appropriate course of action.
Milling Outcomes. Milling refers to people searching for additional and confirming information from other sources to help shape and reaffirm what one understands, believes, personalizes and decides to do or not do after receipt of a message (Mileti & Sorensen, 1990). Milling also includes sharing information with others. Based on the research record, optimized milling outcomes were cast as those with lower scores, as milling delays public protective action-taking.
Protective Action-Taking Outcomes. Protective action response behavior is the most important outcome factor of all, but it was not measured in the experiments as research suggests that behavioral protective action-taking intentions are not realistic estimates of protective action-taking in actual events with which people are not very
6 The panels included a diverse group of individuals who have Internet access and have joined the Survey Monkey program to take
surveys. Eligible panel members were invited by email to participate. Given that the tested messages were about hypothetical disasters occurring in California, participants were drawn largely from within the state so that the hazards would be familiar and the messages would be salient.
7 See, for example, Gutteling, J. M. (1993). A field experiment in communicating a new risk: Effects of the source and a message
containing explicit conclusions. Basic and Applied Social Psychology, 14(3), 295-316.; Kim, H. J., & Cameron, G. T. (2011).
Emotions matter in crisis: The role of anger and sadness in the publics’ response to crisis news framing and corporate crisis response. Communication Research, 38(6), 826-855; Lindell, M. K., & Perry, R. W. (2012). The protective action decision model: Theoretical modifications and additional evidence. Risk Analysis, 32(4), 616-632.
13
familiar. Given that the perceptual outcomes measured are known to correlate with protective action-taking behavior (Kuligowski et al., 2012; Mileti & Sorensen, 1990), and because perceptions could be accurately measured in an experimental setting, the perception outcomes listed above were seen as better indicators of protective action-taking behavior than response behavioral intentions.
Scale Construction. For each experiment, subjects were randomized to condition as indicated in Tables 1-8, Appendix D. The text of the messages tested, based on randomization, are contained in Table 9, Appendix D; and the actual images that participants viewed, including maps, are included in Figures 1-8, Appendix D. The team’s prior research used the same primary outcomes: understanding, believing, personalizing, deciding and milling. Scales were constructed to measure each of the outcome constructs. Exploratory and confirmatory factor analysis was conducted to guide scale construction (N = 3,532). Factor analysis in SPSS (Principal Axis Factoring and Varimax rotation) was used to assess whether the items reliably represented a single construct. Scree plot and eigenvalues were examined to determine the maximum number of possible factors for the potential items. Factor loadings were assessed and items that cross-loaded across factors were dropped. The coefficient alpha values ranged from .81 to .96. Skewness ranged from -1.64 to -0.41. Kurtosis ranged from -0.52 to 2.53. Descriptive statistics for the five factors are presented in Table 2 (see Appendix C). Constructs were operationalized and scales were constructed as follows.
Understanding. Understanding was measured by asking subjects to rate their level of agreement with seven statements using a six-point scale, where 1 represented “do not understand at all” and 6 represented “fully understand.” The question stem was, “After reading this message, I understand,” followed by seven statements. The seven statements rated were: “What happened,” “The risks,” “What to do to protect myself,” “What location is affected,” “Who the message is from,” “When am I supposed to take action to protect myself,” and “How long am I supposed to continue taking action to protect myself.” All seven measures merged together to form the “understanding” factor.
Believing. Believing was measured by asking subjects, “After reading this message, do you believe that…” This question was followed by three items: “A tsunami is headed your way,” “You should immediately take shelter,” and “Sheltering will make you safer.” Answers were rated using a six-point scale where 1 represented “do not believe” and 6 represented “believe.” Experiment 8, which involved three different hazard types, used the same question structure and the following items: “Danger is headed your way,” “You should immediately take action,” and “Taking action will make you safer.” All three measures merged together to form the “believing” factor.
Personalizing. Personalizing was measured by asking subjects, “How likely are each of the following
statements? If I received this message on my cell phone, I would think that…” This question was followed by seven items: “I might become injured,” “People I know might become injured,” “People I don’t know might become injured,” “I might die,” “People I know might die,” “People I do not know might die,” and “The message was meant for me.” Answers were rated using a six-point scale where 1 represented “extremely unlikely” and 6 represented “extremely likely.” All seven measures of personalizing merged into one factor.
Deciding. Deciding was measured by informing subjects to: “Use the scale below to show how much you agree or disagree with each statement. You may use any number on the scale.” This was followed by four items: “The message will help me decide what to do,” “It will be easy to decide what to do,” “I will be able to decide what to do quickly,” and “I can decide what to do with confidence.” Answers were rated using a six-point scale where 1 represented “strongly disagree” and 6 represented “strongly agree.” All four items merged into one factor.
Milling. Milling was measured by asking subjects the following question stem, “After receiving the warning message, how likely would you be to look for additional information about each of the following things before
14
beginning to take action? How likely would you be to look for additional information about:” followed by 14 items, including: “The size and speed of the tsunami; the physical consequences of the tsunami; what
geographic area is likely to be affected by the tsunami; what you should do to protect yourself; how to take action to protect yourself; when you should begin taking action to protect yourself; how long you should continue taking action to protect yourself; how taking action can reduce your risk; what your family members are doing about the tsunami; what your friends are doing about the tsunami; what people whom you do not know are doing about the tsunami; the time the warning will end; and whether the warning message is ‘real’ or ‘fake?’” Answers were rated using a six-point scale where 1 represented “very unlikely” and 6 represented “very likely.” For experiment 6, which included three different types of hazards, “tsunami” was replaced with “hazard.” The first eight of these measures of milling merged into one factor; other items were deleted to reduce redundancy.
Control Variables. Gender was measured with the question, “Are you male or female?” Race and/or ethnicity was measured by asking, “Which one of these racial/ethnic groups best describes you? Would you say: White; Hispanic or Latino; Black or African American; Asian; Native Hawaiian or other Pacific Islander; American Indian or Alaskan Native; or Other? If you identify with more than one, choose the group you identify with the most.”
Procedure. Individuals who received the Survey Monkey invitation and wished to participate clicked on the embedded link and were taken to the consent form screen. Those agreeing to participate clicked the “continue” button; those who refused to participate clicked “refuse” or closed their browser. The questionnaire took approximately 15 minutes to complete. After completing the last item, participants were thanked for their participation and “debriefed” with a reminder that the messages viewed were hypothetical and not based on any real event.
Exploratory and confirmatory factor analysis was used to create composite outcome scores for multiple indicators of each outcome construct. Power calculations were performed using G*Power to determine necessary sample size. For all experiments except experiment 4, multiple linear regressions were conducted using the message received as the predictor and controlling on the selection criteria of gender, age, and race and/or ethnicity. Regression diagnostics were conducted to determine whether basic assumptions were met. For the independent variable, message received, k-1 dummy variables were created to represent the particular message viewed. Sex was coded as male and female; male served as the reference group (1 dummy variable). Race and/or ethnicity was recoded as Asian/Native Hawaiian/Pacific Islander, Latino/Hispanic, white and other; “white” served as the reference group (3 dummy variables). For experiment 4, analysis of variance was
conducted to allow the testing of interaction effects for the ordinal message length variable, which had 4 categories. Relationships were classified as significant (p ≤ .05), near significant (.05 < p ≤ .10) and not significant (.10 < p ≤ 1.0).8
4.2. Experiments: Findings
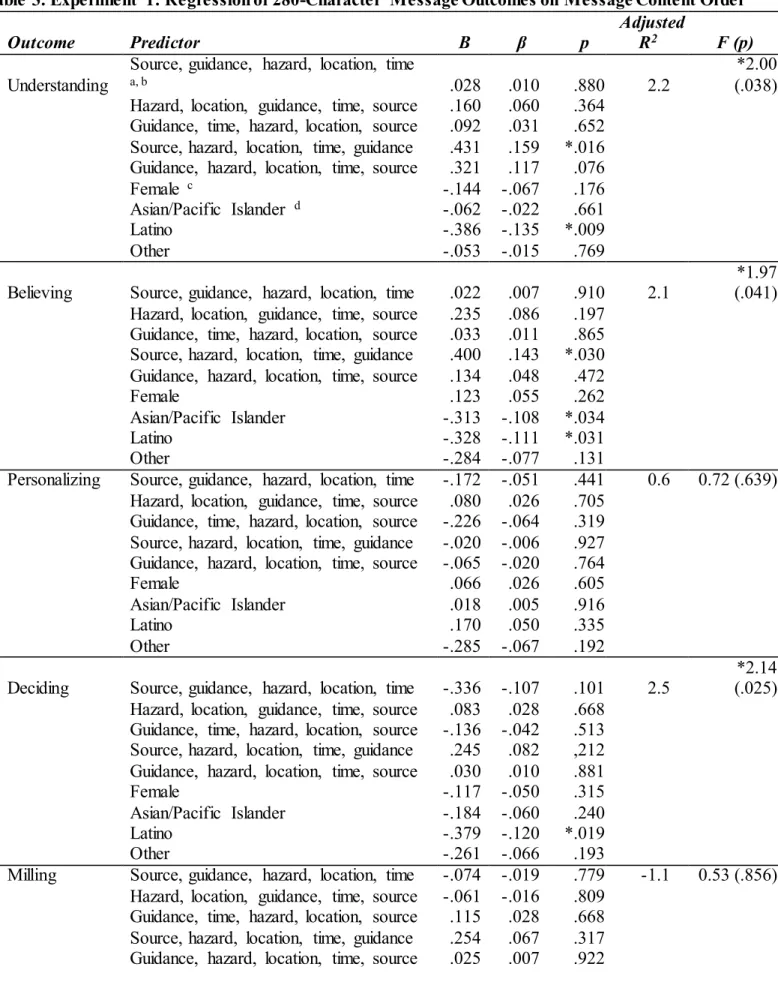
Experiment 1. Message content order. A WEA message similar to the ones auto-generated by the WEA service served as the control group. Power was calculated for the fixed model multiple linear regression (9 predictors total) testing the R2 deviation from zero, to achieve a power of .85 for a small-medium effect size (.05) and alpha = .05, a sample size of N = 358 was needed (actual N = 409).
8 Given the very slight changes in the test messages that were compared, a near significant result takes on meaning. This is precisely
15
Results from the multiple regression analysis examining the effects of different orders of message content are presented in Appendix C, Table 3. Individuals who viewed message order number five (source, hazard, location, time, guidance) had significantly higher levels of message understanding (β = .159, p = .016) as well as message belief (β = .143, p = .030) compared to those who viewed a message with content ordered as in the current WEA auto-generated message (hazard, location, time, guidance, source), while controlling on the subject selection factors of gender and race and/or ethnicity. Moreover, when compared to all other orders combined, order number five remained optimal, yielding significantly higher levels of understanding (β = .112,
p =.023), belief (β = .110, p = .026) and deciding (β = .103, p = .037). This optimal order was: source, hazard, location, time and guidance.
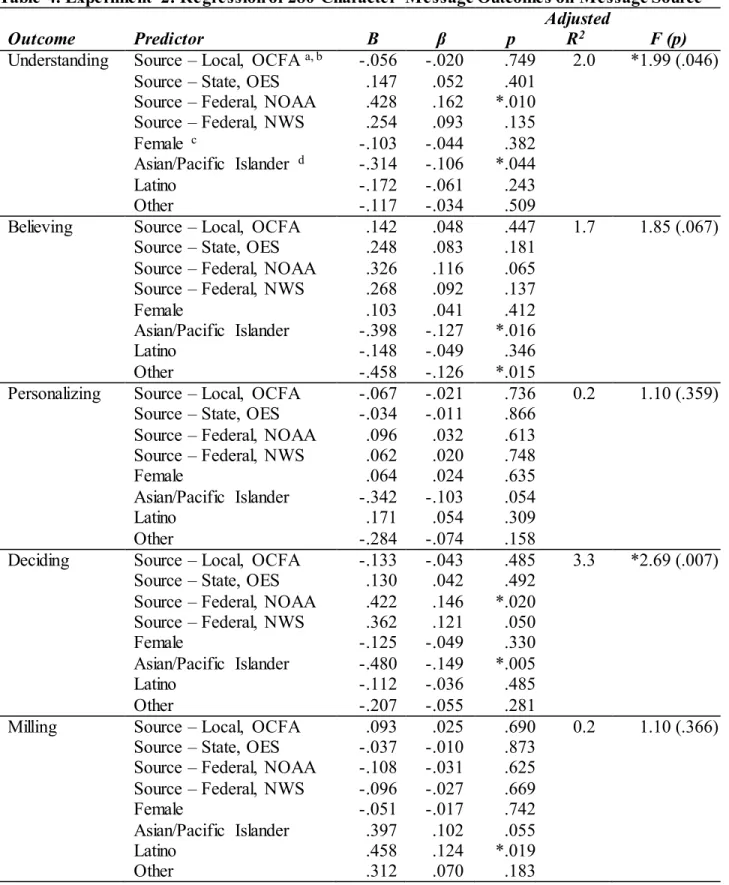
Experiment 2. Message source. Local Office of Emergency Management served as the control group. Power was calculated for the fixed model multiple linear regression (8 predictors total) testing the R2 deviation from zero; to achieve a power of .85 for a small-medium effect size (.05) and alpha = .05, a sample size of N = 344 was needed (actual N = 398).
Results from the multiple regression analysis examining the effects of different message sources are presented in Appendix C, Table 4. Individuals who viewed messages issued by NOAA had significantly higher levels of message understanding (β = .162, p = .010) as well as message deciding (β = .146, p = .020), and near
significantly greater message belief (β = .116, p = .065) compared to those who viewed messages with the appropriate local source (i.e., the Orange County Office of Emergency Management), while controlling on the subject selection factors of gender and race and/or ethnicity. In addition, those who viewed a message with the National Weather Service as the source had significantly higher levels of deciding (β. = .121, p = .050). Thus, local sources may not always be the best sources. Instead, well-known federal sources can be just as, if not more, effective.
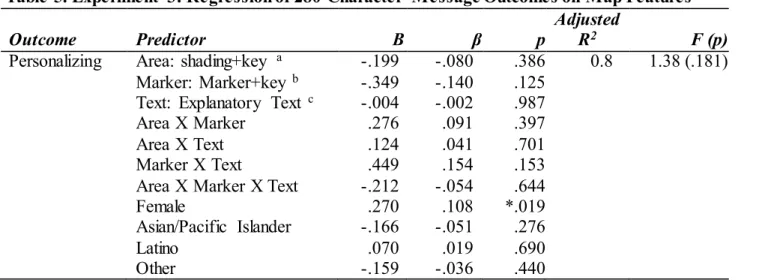
Experiment 3. Map elements. The order- and source-optimized message with no map served as the control group. Power was calculated for the fixed model multiple linear regression (11 predictors total) testing the R2 deviation from zero; to achieve a power of .85 for a small-medium effect size (.05) and alpha = .05, a sample size of N = 384 was needed (actual N = 484).
Results from the multiple regression analysis examining the effects of different message map features are presented in Appendix C, Table 5. None of the message elements tested had a statistically significant effect on message outcomes.
Experiment 4. Message length efficacy. Two-way Analysis of Variance (ANOVA) tested for main and interaction effects for four levels of message length (90-, 140-, 280- and 1,380-character messages) and two levels of maps (present and absent). Power analysis showed that for the ANOVA fixed effects model with main effects and interactions (numerator degrees of freedom = 3, k groups = 8), to achieve a power of .85 for a small-medium effect size (.05) and alpha = .05, a sample size of N = 312 was needed (actual N = 415).
There was a significant effect of message length on message understanding [F(3,407) = 6.74, MSE9 = 7.56, p < .001] and on deciding [F(3,407) = 4.56, MSE = 6.54, p = .004]. There also was a significant interaction between message length and adding a map for understanding [F(3,407) = 3.19, MSE = 3.58, p = .024] and also for milling [F(3,407) = 2.95, MSE = 5.76, p = .033]. See Appendix C, Tables 6a and 6b.
Post hoc analyses using Tukey’s Honest Significant Difference (HSD) test indicated that adding a map yielded higher levels of understanding for both 90-character (M = 4.44) and 140-character (M = 4.63) messages compared to 90-character (M = 4.00) and 140-character (M = 4.47) messages without a map; however, the
16
opposite was true for longer messages. Adding a map yielded lower levels of understanding for both 280-character (M = 4.55) and 1,380-character (M = 4.72) messages compared to 280-character (M = 4.89) and 1,380-character (M = 5.04) messages without a map. In addition, for short 90-character messages (M =4.50), adding a map led to an increase in milling compared to 90-character messages without a map (M = 3.76). In comparison, adding a map to 140-character (M = 4.22), 280-character (M = 4.09), and 1,380-character (M = 3.96) messages led to lower levels of milling (i.e., reduced response delay) compared to 140-character (M = 4.42), 280-character (M = 4.32), and 1,380-character (M = 4.28) messages without a map.
Finally, level of deciding was higher for individuals who viewed a 280-character message (M = 4.32) compared to those who viewed a 90-character message (M = 4.94). Charts showing each outcome by message length and map status are included in Appendix C, Figures 1-5. Overall, the results indicate that the effect of maps varies by message length.
Experiment 5. Relative importance of content elements. Messages that were missing one of the key message elements were compared; the complete 280-character message served as the control. Power was calculated for the fixed model multiple linear regression (9 predictors total) testing the R2 deviation from zero; to achieve a power of .85 for a small-medium effect size (.05) and alpha = .05, a sample size of N = 358 was needed (actual
N = 439).
Results from the multiple regression analysis examining the effects of different omitted message elements are presented in Appendix C, Table 7. Individuals who viewed a message that was missing information about guidance had significantly lower levels of message understanding (β = -.172, p = .003) and deciding (β = -.220,
p < .001); those who viewed a message that was missing information about time until impact had significantly lower levels of message understanding (β = -.151, p = .011), belief (β = -.123, p = .040) and deciding (β = .127,
p = .031); and those who viewed a message that was missing information about message source had
significantly lower levels of personalization (β = -.145, p = .011) and deciding (β = -.141, p = .012), compared to those who viewed complete 280-character optimized messages, while controlling on the subject selection factors of gender and race and/or ethnicity.
Experiment 6. Generalizing across hazard types. Outcomes were compared for three different hazard types: tsunamis, floods and tornadoes. The tsunami message served as the control. Power was calculated for the fixed model multiple linear regression (6 predictors total) testing the R2 deviation from zero; to achieve a power of .85 for a small-medium effect size (.05) and alpha = .05, a sample size of N = 312 was needed (actual N = 373). Results from the multiple regression analysis examining the effects of different hazard types on message outcomes are presented in Appendix C, Table 8. Individuals who viewed a 280-character message that was about a tornado event had significantly lower levels of message belief (β = -.183, p = .003), personalization (β = -.164, p = .007) and deciding (β = -.131, p = .033); those who viewed a message about a flash flood event had significantly lower levels of message belief (β = -.176, p = .004) and personalization (β = -.205, p = .001), compared to those who viewed a 280-character message about a tsunami, while controlling on the subject selection factors of gender and race and/or ethnicity. In sum, the findings do not generalize across hazards for 280-character messages.
Experiment 7: Expanding the message content. Messages that included different expanded content elements were compared; the order- and source-optimized 280-character message was used as a control group. Power was calculated for the fixed model multiple linear regression (9 predictors total) testing the R2 deviation from zero; to achieve a power of .85 for a small-medium effect size (.05) and alpha = .05, a sample size of N = 358 was needed (actual N = 434).