This version is available at https://doi.org/10.14279/depositonce-7073
© © 2017 IEEE. Personal use of this material is permitted. Permission from IEEE must be obtained for all other uses, in any current or future media, including reprinting/republishing this material for advertising or promotional purposes, creating new collective works, for resale or redistribution to servers or lists, or reuse of any copyrighted component of this work in other works.
Terms of Use
Cosenza, B., Durillo, J. J., Ermon, S., & Juurlink, B. (2017). Autotuning Stencil Computations with Structural Ordinal Regression Learning. In 2017 IEEE International Parallel and Distributed Processing Symposium (IPDPS). IEEE. https://doi.org/10.1109/ipdps.2017.102
Cosenza, B., Durillo, J. J., Ermon, S., & Juurlink, B.
Autotuning Stencil Computations with
Structural Ordinal Regression Learning
Accepted manuscript (Postprint) Conference paper |
Autotuning Stencil Computations with
Structural Ordinal Regression Learning
Biagio Cosenza
Technische Universit¨at Berlin [email protected]
Juan J. Durillo
University of Innsbruck [email protected]Stefano Ermon
Stanford University [email protected]Ben Juurlink
Technische Universit¨at Berlin [email protected]
Abstract—Stencil computations expose a large and complex space of equivalent implementations. These computations often rely on autotuning techniques, based on iterative compilation or machine learning (ML), to achieve high performance. Iterative compilation autotuning is a challenging and time-consuming task that may be unaffordable in many scenarios. Meanwhile, traditional ML autotuning approaches exploiting classification al-gorithms (such as neural networks and support vector machines) face difficulties in capturing all features of large search spaces. This paper proposes a new way of automatically tuning stencil computations based on structural learning. By organizing the training data in a set of partially-sorted samples (i.e., rankings), the problem is formulated as a ranking prediction model, which translates to an ordinal regression problem. Our approach can be coupled with an iterative compilation method or used as a standalone autotuner. We demonstrate its potential by comparing it with state-of-the-art iterative compilation methods on a set of nine stencil codes and by analyzing the quality of the obtained ranking in terms of Kendall rank correlation coefficients.
I. INTRODUCTION
Stencils are important computational patterns used in a wide range of different applications (e.g., PDEs [1], image processing [2], Jacobi [3]). Typically, a stencilkernelupdates each position of a two- or three-dimensional grid using that position and a set of neighboring positions from the same or other grids.
Stencil computations have traditionally been optimized with diamond tiling [4], multi-dimensional tiling [5], time skew-ing [6], SIMD instructions [7], and multi-threadskew-ing [8]. The complex interaction between the applied code transformation (e.g., tiling) and the underlying architecture makes it hard to find an optimal set of transformations (i.e., code variant) for any given stencil computation. Furthermore, if such a set of optimal transformations is found, the performance achieved is usually not portable between different architectures or different stencil codes.
Program automatic tuning is an approach that relies on automated search and intelligent techniques to off-load the traditionally time-consuming manual tuning of applications. Autotuning makes possible the efficient exploration of the possible variants of an application and provides some degree of portability sinceautotunerscan easily be re-run on different target architectures.
A current drawback of many autotuning approaches is the increases in compilation time. Luo et al. [9] reported the time required by four popular approaches to automatically
tune the execution of stencil codes: three of them needed a compilation time of more than one day for some specific stencil computations.
The reasons for these long compilation times are twofold. First, most autotuning approaches are based on iterative com-pilation driven by exact1or approximation2search techniques.
Secondly, stencil computations expose a large search space of possible alternatives (e.g., 106.5 in OpenTuner’s stencil benchmark [10]), in which non-existing or complex neighbor-ing structures make it difficult for any search techniques to navigate these spaces.
An alternative approach consists in moving the compu-tational effort required by autotuners to a pre-processing phase to build a knowledge-based model, which can be later exploited to reduce the compilation time. This is done in related work by using supervised machine learning (ML) methods. For example, the autotuning problem is modeled as a classification problem, where each class corresponds to a code variant. Algorithms such asartificial neural networks(ANNs) or support vector machines (SVMs) are used to select the best-performing variant (as in Leather et al. [11]). However, the large number of code variants to execute for a stencil may be too large to be consistently covered in a training phase. A solution may be to select a subset of classes, but this introduces subsequent issues: the user needs to select a representative set of variants from a large set; thus, the selected classes may only cover sub-optimal stencil variants for a large set of different stencil computations.
In this paper, we present a novel approach for modeling the performance of stencil computations using structural learning, which aims to overcome the aforementioned problems with the iterative-search and existing machine learning approaches. We look at the inner structure of the training data to reorganize the stencil code executions by type, input size, and tuning parameters. We express the training set as a partially-ordered set of samples, thus allowing the reformulation of the problem in terms of ranking prediction. Formally, we propose an ordinal regression formulation, which allows us to compare and rank different stencil variants without executing them. This formulation is enabled by a stencil encoding framework that
1Exact techniques guarantee that the optimal solution is found, for example
by evaluating all possible alternatives.
2Approximation techniques guarantee that a near-optimal solution is found
captures the static information of a stencil (such as the stencil pattern), the input size, and the applied transformations into a feature vector. Our approach can be used in two different ways. On the one hand, a standalone autotuner that ranks a set of given code variants. On the other hand, to speed up iterative compilation methods since ranking prediction incurs less overhead than compiling and executing a stencil on a target architecture.
The contributions of this paper are:
1) An approach based on structural learning to model a complex search space for program autotuning.
2) A novel problem formulation for autotuning stencil computations based on ranking prediction.
3) A study of the ordinal regression SVM approach for stencils including performance, parameter sensitivity, Kendall’s τ analysis for rank correlation, and the im-pact of the training size in both performance and rank correlation.
4) Experimental results on a collection of 9 stencil codes and 17 test benchmarks on an Intel Xeon E5, demon-strating the benefits of our approach compared to itera-tive compilation driven by different search strategies. This paper is organized as follows. Section II elaborates on related work on autotuning, with a focus on stencil computations. Section III formally describes how a stencil computation is represented as a feature vector. The machine-learning methodology and its implementation are discussed in Section IV and Section V, respectively. Section VI discusses the experimental results. Finally, Section VII contains conclu-sions and future work.
II. RELATEDWORK
Optimizing the performance of stencil computations has been thoroughly studied in related work using different ap-proaches such as cache-oblivious algorithms [12], polyhedral analysis [13] and analytic performance models [14]–[17]. Recently, autotuning represents one of the most used and popular approaches so far. The increasing interest in software autotuning is also reflected by an extensive amount of related work ( [11], [18]–[31]). For reasons of space, we focus only on those works pertaining to stencil computations.
Search-based techniques are the predominant approaches for stencil autotuning. These techniques are based on iterative compilation, where different variants of the code are executed on a target platform to analyze their performance. As the number of possible variants is usually very large, only a fraction of them can be evaluated in a reasonable amount of time. The various approaches for stencil autotuning differ in how these variants are selected and which parameters give rise to them.
Datta et al. [32] reduced the set of all possible variants of several stencil computations using heuristics that impose some constraints on these variants. The proposed approach is tested on a wide range of different hardware architectures including NVIDIA GeForce, IBM PowerXCell, Sun UltraSparc, AMD Opteron and Intel Xeon. Similarly, in [33] some constraints
are imposed. In this case, stencil computations are divided into smaller 2D blocks which are later assigned to CUDA threads. One of the dimensions defining these blocks is constrained as a multiple of CUDAhalf-warp(i.e., 16, 32, 48, 64). MODESTO [34] is a framework that allows tuning applications composed of several stencil computations. It uses two different search approaches. First, it usesbrute forceto determine the order in which the different stencil computations are to be executed. Then, each stencil is individually tuned by using dynamic programming to determine the optimal tiling parameters.
PATUS [35], Halide [2], and YAST [36] allow specify-ing stencil computations usspecify-ing a domain-specific language (DSL) and navigate the space of all possible variants using a genetic algorithm (GA). While PATUS has been used to target different multi-core CPUs and a single GPU, Halide is particularly focused on image processing and their execution on heterogeneous GPU+CPU platforms. PATUS also includes other stochastic and heuristic search techniques, and has shown its strength in tuning earthquake simulation applications [37] and reproducibility studies [38]. An improved GA was also used for tuning stencil computations targeting GPUs [16]. The OpenTuner framework [10] is a tool that allows the autotuning of stencil computations. Instead of using a single search algorithm, this tool includes the implementation of several of state-of-the-art search engines, and automatically chooses the best match for every stencil code. OpenTuner uses a multi-arm bandit technique [39] to perform this selection.
Although search-based autotuning has been applied with success, the increase in hardware complexity and the advent of many-core processors also implies an increase in the number of possible variants for executing a stencil computation. In this context, the application of some of these techniques may render it impossible, due to the amount of time required, to tune a single code. In this regard, Luo et al. [9] compare the time of different search-based autotuners. The required time ranges respectively from two hours up to two days in the best and worst cases.
Machine learning (ML) is an alternative to search-based autotuning. ML-based techniques move the complexity to a pre-processing phase where several executions of stencil computations are performed. On the basis of these executions, a knowledge-based model is built, and later on used to decide which variant of an unseen stencil computation is executed.
In FAST [9], any unseen stencil is executed using historical information from similar stencil computations. Similarity be-tween different stencils is computed on the basis of some static and runtime features. A similar idea is also used by Nitro [40]. ML models have been proposed to predict the optimal factor for loop unrolling [11], [41]. In all these, autotuning is defined as an ML classification problem in which a variant is selected from a set. Typical algorithms used for classification are SVMs and ANNs.
A different way of using ML is by numerically modeling the performance of an application with regression. For example, in [42], the performance of SIMD codes is approximated with a linear regression model.
The method proposed in this paper is also based on Machine Learning. Our approach is inspired by [43], which uses SVMs to predict ordinal ranking to optimize search engines using click-through data [44]. To the best of our knowledge, our approach is the first stencil autotuner based on ordinal ranking which, as will be explained in Section IV, overcomes some drawbacks of existing classification and regression tuners. This methodology is enabled by a new vector representation that encodes information about stencil codes, input sizes and tuning parameters into a feature vector.
III. STENCILMODELING
A stencil is a geometric structure defined over a n-dimensional field F. At time t, each point of the field is written or updated according to a function of neighboring field points at previous instances in time. The points considered by that function are defined by a static pattern (also called shape). For convenience, we deal with up to three-dimensional stencils where time step t depends only on time step t−1. These assumptions cover a wide range of different stencil computations.
We use an algebraic framework to define any stencil com-putation, their input size, and any possible tuning parameter applied to it. This framework allows to summarize all this information on a single vector. Given such a vector, it is also possible to reconstruct the stencil code and the applied tuning. To facilitate the processing through machine learning algorithms, each component of this vector is transformed into a real value normalized to the interval[0,1]. This final vector is known as the feature vector.
A. Stencil Instance
We model any stencil computations by looking at three parts: the stencil pattern, the number of buffers (e.g., grids) it accesses, and the data type of these buffers. We define astencil kernelas a vectork= (s, b, d), wheresrepresents the stencil pattern, bthe number of buffers and dthe data type used. To have a portable method, there are no features depending on the hardware, e.g., SIMD width or thread affinity. To summarize, within the feature vectorkwe represent all static code features that can be extracted from a stencil code.
1) The stencil pattern: (or shape) is also vector. It specifies the neighboring points accessed by the code. These points are codified relative to the origin position (e.g., a two-dimensional five-point laplacian stencil accesses the points (0,−1),(−1,0),(0,0),(1,0), and (0,1)). By considering a maximum offset for any neighboring point, the stencil pattern can be represented as ann-dimensional structure (beingnthe buffer dimension). For example, assuming an offset of one, for a two-dimensional stencil the pattern can be represented in a 3×3 binary matrix. The central element in this matrix represents the point being updated. Any other cell within the matrix indicates whether the corresponding neighbor is accessed or not. Be the maximum offset 2, the pattern would be represented by a 5 × 5 binary matrix. By using that
representation, we can model any possible stencil pattern, constrained to be enclosed within the considered offset.
As example, the following matrix represents the pattern of a two-dimensional laplacian stencil (for a maximum offset of 1): 0 1 0 1 1 1 0 1 0
For a 3-dimensional case the pattern is represented by a 3-dimensional matrix. For the sake of mapping all 2- and 3-dimensional kernels to the same feature space, we always use 3-dimensional matrices in this work and we consider a 2-dimensional stencil as a special case of the former, where all the computations take place on thez= 0plane.
When a stencil computation accesses different buffers, the access pattern is defined within our framework as the sum of accesses to each individual buffer. This issue only appear in one of the evaluated examples (divergence). The n-dimensional structure containing the stencil pattern can be represented as a sparse vector, thus efficiently storing only the non-zero values. During the training phase, we will automatically generate different computations using the shapes shown in Fig. 1 with different offsets.
2) The number of buffers and types: represents how many input buffers are read to update a position and their type. We assume that each stencil is homogeneous on thetypeof input (i.e., all buffers have the same type); therefore:
d=
0, if input buffer(s) data type is float 1, if input buffer(s) data type is double
(a) Line
(b) Hyperplane
(c) Hypercube (d) Laplacian
Fig. 1. 3D training stencil shapes
Finally, we define thestencil instanceasq= (k,s)where a stencil kernel described by the vectorkand whose input size is defined by s = (sx, sy, sz). A stencil instance represents
the input of our framework. Our goal is to find the best tuning for such an instance regarding a set of code transformations. B. Stencil Tuning Parameters
Different frameworks include different code transformations for stencil applications. These transformations are intended to improve code performance and can be also defined by a set of integer parameters (e.g., the loop unrolling transformation is defined by the unroll factor).
Given a sequence of transformations, they can be repre-sented also as a vector within our framework. This vector contains the parameters required for these transformations. The leftmost values in the vector are the parameters of the first code transformation; then the parameters to the second applied code transformation and so on. We denote this vector as t.
We define then astencil executionas the triple(k,s,t), i.e., the stencil kernel, the input size, and the tuning vector.
IV. STENCILTUNING ASORDINALREGRESSION
The problem of automatic tuning of stencil computations can be formalized as follows. For an input stencil instance q= (k,s), our optimizer should return a tuning vectort∈T, whereT is the space of all possible tuning parameters, so that the time of executing(k,s,t)is minimum.
w a b c d (a) SVM classifica-tion w a b c d (b) SVM ranking w1 w2 a b c d
(c) Comparing two ranking functions
Fig. 2. From classification to ordinal regression
A. Classification and Regression
As discussed in Section II, existing machine learning au-totuning approaches are either based on classification or on regression. Here, we detail both approaches and highlight their main drawbacks in the autotuning context.
1) Classification: The idea of classification is to select the best performing code variant from a finite set of classes, based on the similarity of the input stencil with each of these classes. In related work, for example, classes have been defined to determine the loop unrolling factors (e.g., 16 classes [11]) or to determine how to partition the input in heterogeneous environments (e.g., 21 classes [28]). Classification approaches have several drawbacks. One difficulty is determining the right number of classes to use. Furthermore, typical classification approaches optimize for predictive accuracy, which might not be the correct metric in our scenario. When a stencil computa-tion is misclassified, two possible scenarios are plausible: (1) the predicted class offers a performance similar to the optimal one, or (2) the predicted class offers an inferior performance.
TABLE I
EXAMPLE CONTAINING DIFFERENT STENCIL INSTANCES EXECUTIONS
Instance Input Tuning Runtime Rank
1 q1= (k1, s1) te1 12ms 1 2 q1= (k1, s1) te2 13ms 2 3 q1= (k1, s1) te3 20ms 3 4 q2= (k1, s2) te4 10ms 1 5 q2= (k1, s2) te5 36ms 3 6 q2= (k1, s2) te6 35ms 2 7 q3= (k2, s1) te7 30ms 1 8 q3= (k2, s1) te8 45ms 2 9 q3= (k2, s1) te9 47ms 3 10 q4= (k2, s2) te10 25ms 3 11 q4= (k2, s2) te11 21ms 2 12 q4= (k2, s2) te12 12ms 1
Whereas the first scenario is acceptable, the second should be avoided. These differences are not captured by the predictive accuracy metric. In classification approaches it is challenging to define a loss function, required to train an ML-based model, that is able to properly weigh such situations.
2) Regression: In a regression task, the goal is to predict a single real number for each input. As mentioned before, regression has been used to predict the performance of a computation in [42]. The function describing the performance of a stencil computation on a given hardware architecture may be difficult to model (due to non-linearity, non-differentiability, etc.). Learning such a function from data would require a very large number of samples. Furthermore, obtaining such a model is a harder problem than what is actually required for tuning a stencil computation. Knowing the relative performance of configurations (when one configuration is better than another) is sufficient to find the best one. In other words, knowing their actual (absolute) performance is a sufficient, but not necessary, condition to be able to identify the best configuration. B. Beyond Classification and Regression
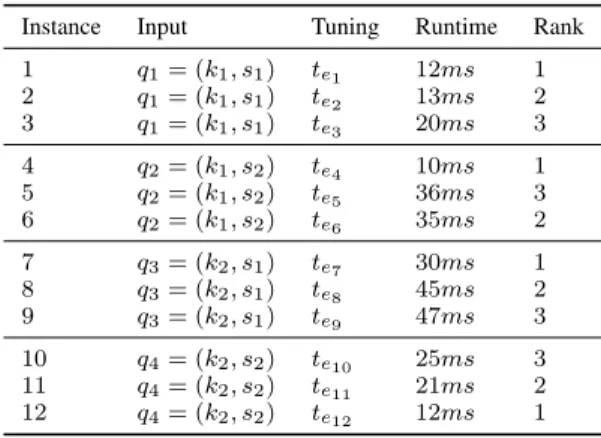
To illustrate the ranking approach, let us assume we have the example in Table I with only 2kernels,2 input sizes and 3 tuning vectors for each.
In a regression approach, one would attempt to build a model predicting runtime as a function of the tuning param-eters, hardware, etc. In a classification approach, one would attempt to classify kernels into classes (e.g., good vs. fair vs. bad performance).
We follow a different approach. We look at the training set in terms of (partial) rankings. For each training instance, it is possible to define an ordering of the stencil execution, and therefore a global partial ordering, so that the following inequalities apply (transitive inequalities are omitted):
te1 < te2 te2 < te3 te4< te6 te6 < te5 te7 < te8 te8 < te9 te12< te11 te11 < te10 This problem, consisting of predicting structures (e.g., rank-ing) from data instead of discrete (classification) or continuous values (regression), is known as structural learning [45]. In the
following, we describe a learning algorithm that allows to use that information type in the construction of the model. C. Structural Learning Based on SVM
For a stencil instance qi = (ki,si) and a list of tuning
settingste1, . . .teE, we define a ranking functionras one that allows to sort theE possible stencil executions(ki,si,tej)in terms of their performance. More specifically, we considerras a function defined from the set of possible stencil computations to real values representing the rank of these computations.
The general idea of our structural approach is to use ranking information from the training instances for building a ranking functionr. Ideally, this function will produce reliable rankings for previously unseen instances (not in the training set). Once defined, we make use ofr, which in general should be easier to evaluate than executing the stencil itself, to quickly sort different stencil executions for a given stencil instance qi and
different tuning vectors. We use the output of this function to determine the tuning vector tej that produce the highest
performance version of qi.
For example, let us consider that our training set is com-posed of n stencil instances. Each instance consists of an execution of a stencil computation qk with1≤k≤nusing a
given tuning settingtek ∈T. Let us also assume that yk, with 1≤k≤n, represents the execution time for that element. The goal is to compute a function r(q,t) so that, for any pair of stencil executions (qi,ti)and (qj,tj)whose execution times
are yi and yj, respectively, with 1 ≤ i, j ≤n, it holds that
r(qi,ti)< r(qj,tj)⇔yi< yj.
Given a training set like the one indicated before, it is possible to sort and assign a ranking to each point in it. Let us represent as r∗qi,t
i as the real ranking of the stencil execution(qi,ti)in the training set. Given a functionτq which
measures the similarity between the predicted and the real ranking for a stencil instanceq, our learning problem consists in determining the ranking functionr(q,t)which maximizes the ranking similarity over all instances in the training data. This problem can be formally described as:
max X
qi∈Q
τqi(r, r
∗),
(1) withQbeing the set of all stencil instances in the training set. One of the most effective ways to solve the learning problem described in Equation (1) is to use SVMs as described in [44]. If we denote as P the set of all pairs (i, j) for which the instanceihas a higher rank thanj, i.e.,P ={(i, j) :yi> yj},
and let m = |P|, under some assumptions the problem is equivalent to solving the following optimization problem (see details in [44]): min w,ξ≥0 1 2w Tw+ C m X (i,j)∈P ξi,j subject to ∀(i, j)∈P : (wTqi,ti)≥(wTqj,tj) + 1−ξi,j (2) This formulation finds a function r(q,t) linear in the fea-tures q, parameterized by a weight vector w, that minimizes
the number of pairs in the training data that are swapped with respect to their real ranking (i.e., ordering based on performance evaluation). In particular, that ranking function consists of the projection of the features corresponding to a stencil execution onto the vectorw, or equivalently, the signed distance to a hyperplane with normal vectorw (see Fig. 2c). In this equation,ξi,j are called slack variables and are used to
represent the possibility of mispredictions. The parameterCis used to regularize and controls the trade-off between margin size and training error.
D. Ordinal Regression with Partial Ranking
Equation (2) assumes that a ranking of all points in the training set exists. Our training data set, however, only exposes partial ranking information, i.e. ranking for eachqi: we cannot
sort stencil executions belonging to different stencils k or input size s. Therefore, let us define Pi ⊂ P as the set of
inequalities generated by the instanceqi, i.e., Pi ={(j, k)∈
P : (j, k)are generated from(qi, tj),(qi, tk)andyj> yk}.
Assuming that P1, P2· · ·Pn are all partial rankings
avail-able in the training set, we modify Equation (2) to match our case: min w,ξ≥0 1 2w T w+ C m0 X i X (j,k)∈Pi ξj,k subject to ∀(j, k)∈P1: (wTq1,tj)≥(wTq1,tk) + 1−ξj,k ∀(j, k)∈P2: (wTq2,tj)≥(wTq2,tk) + 1−ξj,k · · · ∀(j, k)∈Pn: (wTqn,tj)≥(wTqn,tk) + 1−ξj,k (3) where m0 = |S
iPi| and n = |Q|. Using this formulation
allows to find a ranking function that has a low number of discordants pairs regarding the same stencil instance.
V. IMPLEMENTATION
Without loss of generality, we validate our approach using the PATUSDSL source-to-source stencil compiler [37], which generates C code with multi-threading and SIMD instructions (e.g., AVX). PATUSexposes loop blocking, loop unrolling and multi-threading chunking. Loop blocking is applied to all loop levels, thereby requiring two or three blocking sizes (bx,by,
and bz) to tune, depending on the number of dimensions of
the stencil code. We consider each of these sizes ranges from 2 to 1024. Afterwards, loop unrolling (u) is applied to the innermost loop. The unrolling factor may vary between 0 (no unrolling) and 8. In addition, after transforming the code with tiling and unrolling, a third tuning parameter is required for executing the code: thechunksize (c). This parameter refers to the number of consecutive tiles that are assigned to the same thread. Therefore, our tuning vector consist of 5 components
t= (bx, by, bz, u, c). If other code generators such as Halide
are considered, the tuning vector would be composed by those parameters regarding the transformations applied by them.
The rest of this section addresses several implementation issues: a) the compilation work-flow, which translates stencils written in a DSL to final executable; b) the training set
generation; c) the execution phase; and, d) the implementation of the ordinal regression method.
A. Compilation Work-flow
Firstly, we automatically generate different stencil codes for PATUS. Then, the PATUS compiler translates them into C code with OpenMP loop annotations aimed to exploit multi-threading parallelism, and AVX vector instructions aimed to exploit instruction level parallelism. A binary executable is finally generated out of the C code by using a backend compiler (gcc 4.8.4 in our case). This double compilation process may be particularly slow for very dense stencil pattern (e.g., it takes about 32 hours to generate all the binary files of all the codes composing our training set).
Fig. 3. Training phase.
B. Training Set Generation
Fig. 3 depicts all the tasks performed in the training phase. The code generator generates several stencil codes with dif-ferent shapes (line,hyperplane, hypercubeandlaplacian, see Fig. 1), number of buffers and buffer types. The generated stencil codes are used for extracting their static features described in section III-A and codify them in form of vectors. We generate 60 different stencil codes, including both2- and 3-dimensional ones. We consider different stencil instances by using different input sizes for each of the generated stencil codes. In particular, we use 643, 1283, and 2563 for 3
-dimensional computations and 2562,5122,10242, and20482
for 2-dimensional ones. The total number of instances q is 200. Each of these instances is executed with a varying number of randomly generated tuning vectors t. As three-dimensional stencils expose a larger search space (i.e., more tuning possibilities), we generate twice as many tuning vectors as for two-dimensional kernels.
The performance measurements obtained after evaluating the stencil instances with the tuning vectors are collected into the training dataset as follows. For each stencil instance, we sort all the executions based on their performance, generating a rank for each of them. Finally, each feature vector together with tuning vector and corresponding rank is stored in the training data set for each stencil execution.
After the generation of the training set, the results are partially sorted so that, for each instance q, a partial ranking of the tuning vectors is available. This ranking is used as input by the ordinal regression algorithm.
All these steps are performed automatically in our frame-work. This eases the porting of our model to any system supported by the PATUS compiler such as Intel Phi, NVIDIA GPUs, or AMD Opteron (or the platforms the chosen code generator supports).
C. Execution
When a new unseen stencil is presented to the analyzer, its static features are extracted and the code is passed onto the double compilation process to generate the executable. These features and the stencil size are provided to the previously generated model. The model also requires several possible tuning settings. These settings can be generated based on user experience, randomly, or using a higher level method (e.g., a search algorithm exploring the search space). The model then ranks these settings by predicting a ranking for each of these setting (notice that there is no need to perform any extra execution at this point, these rankings are computed based on training data). Finally, the stencil program is executed using the first-ranked tuning configuration.
D. Ordinal Regression Implementation
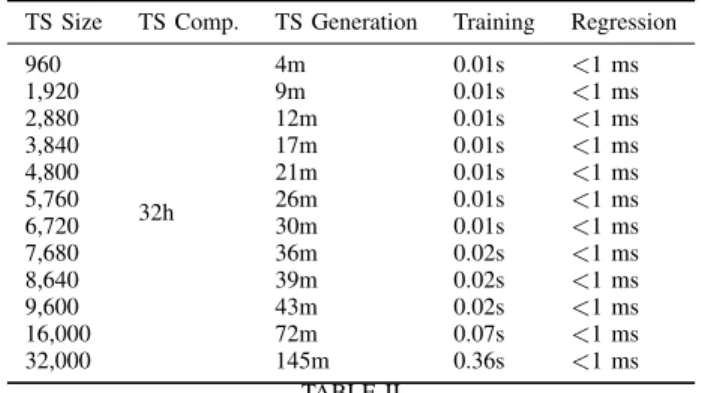
We use Joachims’ implementation of SVM-Rank [43] to predict these rankings. This implementation is fast and makes use of a linear kernel for the SVM. Table II summarizes the training and regression times. The model training has been performed with a linear kernel and C = 0.01. We experi-mentally measured a training time shorter than 1 second for datasets smaller than 45K points. Even faster is the regression time, i.e., the time to rank different tuning versions once the ML method has been trained. For all the data sizes we tested, SVM-Rank took less than 1ms.
TS Size TS Comp. TS Generation Training Regression
960 32h 4m 0.01s <1 ms 1,920 9m 0.01s <1 ms 2,880 12m 0.01s <1 ms 3,840 17m 0.01s <1 ms 4,800 21m 0.01s <1 ms 5,760 26m 0.01s <1 ms 6,720 30m 0.01s <1 ms 7,680 36m 0.02s <1 ms 8,640 39m 0.02s <1 ms 9,600 43m 0.02s <1 ms 16,000 72m 0.07s <1 ms 32,000 145m 0.36s <1 ms TABLE II
COMPUTING TIME OF DIFFERENT PHASES FOR DIFFERENT TRAINING SET SIZES AND PARAMETERS ONXEONE5. ALL PHASES ARE
PRE-PROCESSING PHASES EXCEPT FOR REGRESSION.
VI. EXPERIMENTALEVALUATION
The goal of this section is to assess the quality of our model. First, we compare our best-ranked solutions with the solutions computed by iterative search-based approaches, which have been generated after a long compilation process. Second, we focus on a given code and input size and analyze the quality
of the obtained ranking with a metric existing in the literature, i.e., the Kendallτ.
We evaluate our framework using nine stencil codes, listed in Table III, which represent different shapes and memory patterns. These stencils are executed with different input sizes, for a total of 17 test benchmarks. The experiments have been performed on an Intel Xeon E5-2680 v3 with 12 cores running at 2.50 GHz, with 256K of L2 cache and 32 GB of RAM. A. Ordinal Regression vs Iterative Search
The goal of this experiment is to assess the quality of the ordinal regression model. For this, we compare the best-ranked solution provided by our model on a pre-defined set of configurations against the results computed by search-based iterative compilation methods.
The quality of the configurations returned by search meth-ods depends on the performed number of evaluations, which usually lead to high compilation times. In our approach, the computational effort is moved to a previous training phase. Once this phase is completed, ranking several tuning config-urations is immediate (see Table II), and so is the generation of a high performance version of a stencil in compile time.
As some search methods perform better than others de-pending on some search space properties [46], we consider here four different search techniques performing 1024 evalu-ations each: evolutive strategy, differential evolution, and two different genetic algorithms, a generational one and a steady-state [47]. We could have used a framework like OpenTuner, which also includes these search techniques. However, Open-Tuner automatically drops the evaluation of under-performing search algorithms in early stages of the search (as soon as an algorithm shows an inferior behavior than others). On the contrary, we run every search for a fixed number of iterations regardless of their performance. Therefore, if the search algo-rithms are properly implemented and the same search space is used for each tuning parameter, the considered search methods and OpenTuner should lead to the same results.
We train our model using a linear kernel, C = 0.01 and four different training sizes, i.e., 960, 3840, 6720, and 16000 different points. Once the model is built for each different training size, we use it for ranking the pre-defined set of tuning configurations. This set consists of 1600 for 2d stencils and 8640 for the 3d cases. These options are statically chosen in a way that the search space is hierarchically sampled, by considering all combinations consisting of power of two values for each tuning parameter. We compare the top ranked tuning configuration out of the pre-defined set versus the search methods. It is worth highlighting that the performance we obtain with our approach is bound by the solution performing the best in the pre-defined set. Nevertheless, our point is that if we achieve a performance comparable to search methods, then our method has been able to accurately rank the presented 1600 (8640) tuning alternatives.
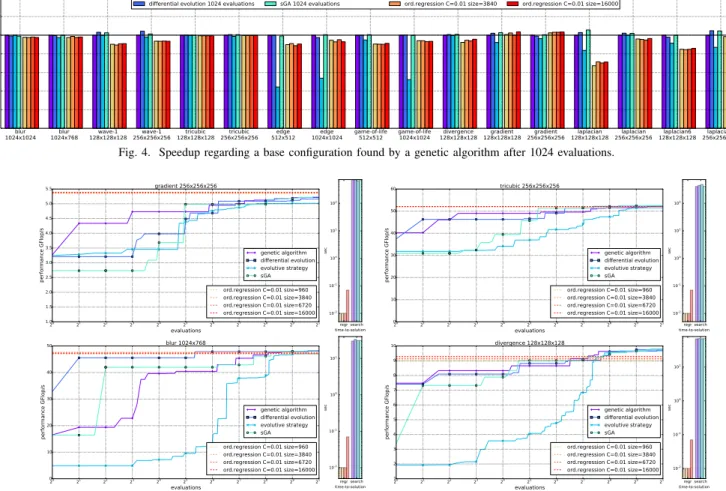
Fig. 4 shows the speedup of the different benchmarks achieved by the analyzed search techniques and the ordinal regression model with the different training sizes. These
speedups are relative to a base configuration for every bench-mark, as will be explained below. Fig. 5 shows the intermediate search results, which help us to understand how search-based iterative compilation techniques work. Details of the analyzed test benchmarks can be found in Table III. In the following, we further analyze the data depicted in Figures 4 and 5. We selected the best solution found by a generational genetic algorithm after 1024 evaluations as the base configuration to compute the speedup. We considered this algorithm because in our experiments it has shown to be the most stable of the analyzed search techniques. It is important to highlight that such a configuration is usually generated by the genetic algorithm in a tuning process that lasts from minutes to hours, depending on the stencil computation. Fig. 4 shows that the top ranked configurations within our model lead to performances similar to those achieved by search-based iterative compila-tions. Furthermore, in two computations (gradient with input size 1283 and2563) our model computed solutions of higher
quality than any of the analyzed search techniques. The top-ranked solution for the laplacian stencil with input 1283 represents the case where differences between our approach and search-based methods are the largest. However, even in this case, the regression model is still able to rank the pre-defined set achieving a performance of 75% of the genetic algorithm solution.
A closer look at the figure indicates that ordinal regression performs well even with small training sizes. For example, the smallest training set, whose generation took less than five minutes, returns results similar to those of the larger models with more samples. Apparently, in this experiment the training set size partially influences the quality of the best-ranked solution; however, we will see in the next section that the training set size remarkably improves the overall quality of the produced rankings. This experiment shows that even with a small training size, the model is able to produce fast top-ranked solutions.
Fig. 5 includes further details for four stencil codes. In particular, it shows the performance of different search tech-niques across different number of evaluations. The vertical axis represents the performance in GFlops/s. The horizontal axis represents the number of evaluations performed by the search techniques. The results of our ordinal regression approach are depicted by a horizontal line. The bar chart on the side shows the time-to-solution for all methods.
Firstly, we show an example of agradientstencil with size 2563. The ordinal regression method has ranked the evaluated
points correctly and the top ranked configuration outperforms the tuning achieved by any of the applied search methods.
The second graph shows the results for thetricubic stencil with size 2563. Due to its simple memory access pattern, it represents an easy-to-tune problem. Search-based autotuning and ordinal regression reached the same solution. In spite of the low complexity of tricubic, any of the search-based ap-proaches needed hundreds of evaluations to find a sub-optimal configuration. Also for the third analyzed stencil computation, blurwith size1024×768, search-based autotuning and the top
Stencil Code Type Shape Buffer read Sizes
Blur 2D 5×5hypercube 1 float 10242,1024×768
Edge 2D 3×3hypercube 1 float 5122,10242
Game of life 2D 3×3hypercube 1 float 5122,10242
Wave 3D 13 laplacian + 1 1 float 1283,2563
Tricubic 3D 4×4×4hypercube 3 float 1283,2563
Divergence 3D 6 laplacian (center point not read) 3 double 1283
Gradient 3D 6 laplacian (center point not read) 1 double 1283,2563
Laplacian 3D 7 laplacian 1 double 1283,2563
6th order laplacian 3D 19 laplacian 1 double 1283,2563
TABLE III
STENCIL TEST BENCHMARKS. THE TEST SET INCLUDES9KERNELS WITH DIFFERENT SIZES,FOR A TOTAL OF17BENCHMARKS.
blur
1024x1024 1024x768blur 128x128x128wave-1 256x256x256wave-1 128x128x128tricubic 256x256x256tricubic 512x512edge 1024x1024edge game-of-life512x512 game-of-life1024x1024 128x128x128divergence 128x128x128gradient 256x256x256gradient 128x128x128laplacian 256x256x256laplacian 128x128x128laplacian6 256x256x256laplacian6
0.0 0.2 0.4 0.6 0.8 1.0 1.2 1.4 speedup
genetic algorithm 1024 evaluations
differential evolution 1024 evaluations evolutive strategy 1024 evaluationssGA 1024 evaluations ord.regression C=0.01 size=960ord.regression C=0.01 size=3840 ord.regression C=0.01 size=6720ord.regression C=0.01 size=16000
Fig. 4. Speedup regarding a base configuration found by a genetic algorithm after 1024 evaluations.
20 21 22 23 24 25 26 27 28 29 210 evaluations 1.0 1.5 2.0 2.5 3.0 3.5 4.0 4.5 5.0 5.5 performance GFlop/s gradient 256x256x256 genetic algorithm differential evolution evolutive strategy sGA ord.regression C=0.01 size=960 ord.regression C=0.01 size=3840 ord.regression C=0.01 size=6720 ord.regression C=0.01 size=16000 regr search time-to-solution 10-2 10-1 100 101 102 sec 20 21 22 23 24 25 26 27 28 29 210 evaluations 0 10 20 30 40 50 60 performance GFlop/s tricubic 256x256x256 genetic algorithm differential evolution evolutive strategy sGA ord.regression C=0.01 size=960 ord.regression C=0.01 size=3840 ord.regression C=0.01 size=6720 ord.regression C=0.01 size=16000 regr search time-to-solution 10-2 10-1 100 101 102 sec 20 21 22 23 24 25 26 27 28 29 210 evaluations 0 10 20 30 40 50 performance GFlop/s blur 1024x768 genetic algorithm differential evolution evolutive strategy sGA ord.regression C=0.01 size=960 ord.regression C=0.01 size=3840 ord.regression C=0.01 size=6720 ord.regression C=0.01 size=16000 regr search time-to-solution 10-2 10-1 100 101 sec 20 21 22 23 24 25 26 27 28 29 210 evaluations 1 2 3 4 5 6 7 8 9 10 performance GFlop/s divergence 128x128x128 genetic algorithm differential evolution evolutive strategy sGA ord.regression C=0.01 size=960 ord.regression C=0.01 size=3840 ord.regression C=0.01 size=6720 ord.regression C=0.01 size=16000 regr search time-to-solution 10-2 10-1 100 101 sec
Fig. 5. Performance results for four stencil benchmarks on a Xeon E5-2680. Ordinal ranking results are shown as horizontal lines. The horizontal axis shows the number of evaluations performed by the different search techniques. The side chart shows the time-to-solution for all methods, in logarithmic scale.
configuration ranked by the regression led to similar results. The fourth stencil is called divergence and has size 1283. This code is more challenging than the ones described above, since it has non-homogeneous buffer accesses and its three buffers are accessed in different ways (i.e., line shape on the x, y and z axes respectively, which we have represented as laplacian in our system). We observe in this case that the top ranked configuration by ordinal regression is outperformed by search based solutions only after hundred of evaluations.
Summing up, given a defined set of tuning configurations, the ordinal regression is able to accurately rank them. In our experiments the top ranked configuration of a pre-defined set
is close in performance to that of a genetic algorithm with 1024 evaluations. It is worth to highlight again that a) the performance obtained by our method is bound to the solution performing the best in the pre-defined set for this experiment; and b) the regression methods compute these solutions in less than a second, while the genetic algorithm may require hours to arrive to that solution.
B. Ranking Evaluation
In this section we evaluate the accuracy or the ordinal regression when ranking configurations. Different ways of measuring the similarity between rankings exist. In this paper,
we use the Kendall τ [48] coefficient to assess the quality of our approach. This coefficient measures the ordinal association between two measured quantities; in other words, whether the order between pair of solutions is maintained across the two quantities. In our case, the measured quantities are the order of different stencil instances when looking at their actual execution time, and the ranking provided by the SVM-rank method.
Formally,τ is defined as follows. Given two finite ordering ra, rb ⊂Q×Q, where Q is the set of all stencil instances,
the Kendall τ is defined based on the number of concordant pairsConand the number of discordant pairsDis(number of inversions): τ(ra, rb) = Con−Dis Con+Dis= 1− 2Dis m 2 .
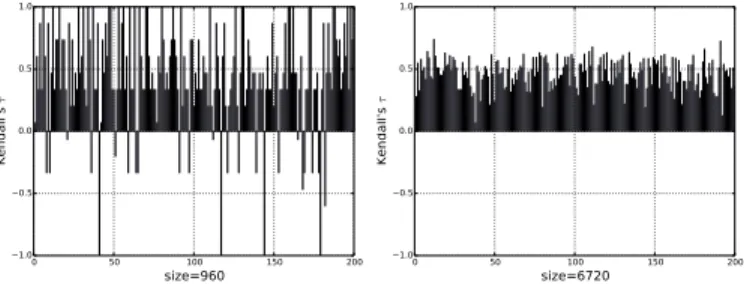
If the agreement between the two rankings is perfect, the coefficient has the value 1. If the the two rankings totally disagree, the coefficient has the value –1. If the two rankings are independent, then we would expect the coefficient to be approximately zero. 0 50 100 150 200 size=960 1.0 0.5 0.0 0.5 1.0 Ke nd all 's τ 0 50 100 150 200 size=6720 1.0 0.5 0.0 0.5 1.0 Ke nd all 's τ
Fig. 6. The Kendallτon the training set with two different sizes.
We take the existing orderings in the training set and com-pare them with those we obtain with our model. Fig. 6 shows the τ coefficients for two different sizes. As we only evaluate partial rankings, for each stencil instance in the training pattern q = (k, s), we show the τ value for all configurations with such q. Theτ coefficients are higher with larger training sets, and they correlate with training set size. Therefore, when the number of points used for training increases, the ranking prediction also improves.
0.96K 1.92K 2.88K 3.84K 4.8K 5.76K 6.72K 7.68K 8.64K 9.6K 16.0K 32.0K size 1.0 0.5 0.0 0.5 1.0 Ke nd all 's τ
Fig. 7. The Kendallτdistribution with different sizes, and C=0.01.
Fig. 7 shows: in blue, the inter-quartile range and outliers (box plot); in yellow, a violin plot of a Gaussian kernel density estimation of the underlying τ distribution; finally, the red point in the middle represents the median value.
The results show that, by increasing the number of samples, Kendall’s τ distribution slightly improves on average, but consistently improves in variance, therefore stabilizing the quality of the ranking over the whole training set.
VII. CONCLUSION
We presented a novel structural learning approach aimed at automatically tuning stencil computations. In the proposed autotuning framework, static information of the stencil code, input size and the applied code transformations are captured in a feature vector, which is used to enable structural learning. With respect to other traditional machine learning ap-proaches used for automatic tuning, typically based on clas-sification or regression, we formulate the problem as ordinal regression. For each pair of stencil code and input size, differ-ent code transformations are sorted by performance, therefore exposing a partial ordering of all the stencil executions in the training set. This partial ordering, i.e., ranking, is used to train an ordinal regression support vector machine able to predict the ranking of any possible code transformation, for a given input code and size. From the resulting ranking of possible transformations, the best ranked is selected to be executed.
Experimental evaluations show that even with a small training set consisting of a few thousand points, the best-ranked code version performs close to the sub-optimal solution delivered by 1024 evaluations of an iterative genetic algorithm. Larger training sets, however, considerably improve the ability of the model to correctly rank code versions, measured in Kendall’sτ correlation coefficient.
The proposed approach can be used in any software opti-mization scenario where the runtime of different code variants can be organized into partial rankings. In future work, we plan to exploit the ability to rank multiple code variants without executing them to speed up autotuning compilers based on iterative compilation. In addition, we want to analyze different mechanisms for generating training sets (such as the use of heuristic methods to gather training data) in order to improve the quality of the model generated.
REFERENCES
[1] C. Olschanowsky, M. M. Strout, S. Guzik, J. Loffeld, and J. Hittinger, “A study on balancing parallelism, data locality, and recomputation in
existing PDE solvers,” inInt. Conf. for High Performance Computing,
Networking, Storage and Analysis (SC), 2014, pp. 793–804.
[2] J. Ragan-Kelley, C. Barnes, A. Adams, S. Paris, F. Durand, and S. Amarasinghe, “Halide: A language and compiler for optimizing parallelism, locality, and recomputation in image processing pipelines,”
inACM SIGPLAN Conference on Programming Language Design and
Implementation (PLDI), 2013, pp. 519–530.
[3] S. Kronawitter and C. Lengauer, “Optimization of two Jacobi smoother
kernels by domain-specific program transformation,” inInt. Workshop
on High-Performance Stencil Computations, 2014, pp. 75–80.
[4] I. J. Bertolacci, C. Olschanowsky, B. Harshbarger, B. L. Chamberlain, D. G. Wonnacott, and M. M. Strout, “Parameterized diamond tiling
for stencil computations with chapel parallel iterators,” in ACM Int.
[5] T. Malas, J. Hornich, G. Hager, H. Ltaief, C. Pflaum, and D. Keyes, “Optimization of an electromagnetics code with multicore wavefront diamond blocking and multi-dimensional intra-tile parallelization,” in IEEE International Parallel and Distributed Processing Symposium
(IPDPS), 2016, pp. 142–151.
[6] R. Strzodka, M. Shaheen, D. Paja, and H.-P. Seidel, “Cache accurate time
skewing in iterative stencil computations,” inInternational Conference
on Parallel Processing (ICPP), 2011, pp. 571–581.
[7] T. Henretty, K. Stock, L.-N. Pouchet, F. Franchetti, J. Ramanujam, and P. Sadayappan, “Data layout transformation for stencil computations
on short-vector SIMD architectures,” in International Conference on
Compiler Construction (CC), 2011, pp. 225–245.
[8] S. Kamil, C. Chan, L. Oliker, J. Shalf, and S. Williams, “An auto-tuning
framework for parallel multicore stencil computations,” in IEEE Int.
Symp. on Parallel & Distributed Processing (IPDPS), 2010, pp. 1–12.
[9] Y. Luo, G. Tan, Z. Mo, and N. Sun, “Fast: A fast stencil autotuning
framework based on an optimal-solution space model,” in ACM Int.
Conference on Supercomputing (ICS), 2015, pp. 187–196.
[10] J. Ansel, S. Kamil, K. Veeramachaneni, J. Ragan-Kelley, J. Bosboom, U.-M. O’Reilly, and S. Amarasinghe, “Opentuner: An extensible
frame-work for program autotuning,” inInt. Conference on Parallel
Architec-tures and Compilation Techniques (PACT), 2014.
[11] H. Leather, E. Bonilla, and M. O’Boyle, “Automatic feature generation
for machine learning based optimizing compilation,” inInt. Symp. on
Code Generation and Optimization (CGO), 2009, pp. 81–91.
[12] Y. Tang, R. A. Chowdhury, B. C. Kuszmaul, C.-K. Luk, and C. E.
Leiserson, “The Pochoir stencil compiler,” inProc. of ACM Symposium
on Parallelism in Algorithms and Architectures, 2011, pp. 117–128.
[13] V. Bandishti, I. Pananilath, and U. Bondhugula, “Tiling stencil
computations to maximize parallelism,” in Int. Conference on High
Performance Computing, Networking, Storage and Analysis (SC), 2012,
pp. 40:1–40:11.
[14] J. Shirako, K. Sharma, N. Fauzia, L.-N. Pouchet, J. Ramanujam, P. Sadayappan, and V. Sarkar, “Analytical bounds for optimal tile size
selection,” inInternational Conference on Compiler Construction (CC),
2012, pp. 101–121.
[15] X. Zhou, J.-P. Giacalone, M. J. Garzar´an, R. H. Kuhn, Y. Ni, and
D. Padua, “Hierarchical overlapped tiling,” in Int. Symp. on Code
Generation and Optimization (CGO). ACM, 2012, pp. 207–218.
[16] M. Wahib and N. Maruyama, “Scalable kernel fusion for memory-bound
GPU applications,” inInternational Conference for High Performance
Computing, Networking, Storage and Analysis, (SC), 2014, pp. 191–202.
[17] H. Stengel, J. Treibig, G. Hager, and G. Wellein, “Quantifying perfor-mance bottlenecks of stencil computations using the
execution-cache-memory model,” inACM International Conference on Supercomputing
(ICS), 2015, pp. 207–216.
[18] M. G. Lagoudakis and M. L. Littman, “Algorithm selection using
reinforcement learning,” inProc. of the Int. Conference on Machine
Learning (ICML), 2000, pp. 511–518.
[19] C. T¸ ˘apus¸, I.-H. Chung, and J. K. Hollingsworth, “Active harmony:
Towards automated performance tuning,” inACM/IEEE Conference on
Supercomputing (SC), 2002, pp. 1–11.
[20] S. Long and M. F. P. O’Boyle, “Adaptive Java optimisation
using instance-based learning,” in International Conference on
Supercomputing, ICS, 2004, pp. 237–246.
[21] R. Vuduc, J. W. Demmel, and K. A. Yelick, “OSKI: A library of
automatically tuned sparse matrix kernels,” inProc. SciDAC, J. Physics:
Conf. Ser., vol. 16, 2005, pp. 521–530.
[22] N. Thomas, G. Tanase, O. Tkachyshyn, J. Perdue, N. M. Amato, and L. Rauchwerger, “A framework for adaptive algorithm selection in
stapl,” in ACM SIGPLAN Symposium on Principles and Practice of
Parallel Programming (PPoPP), 2005, pp. 277–288.
[23] F. V. Agakov, E. V. Bonilla, J. Cavazos, B. Franke, G. Fursin, M. F. P. O’Boyle, J. Thomson, M. Toussaint, and C. K. I. Williams, “Using
machine learning to focus iterative optimization,” inInt. Symposium on
Code Generation and Optimization (CGO), 2006, pp. 295–305.
[24] J. Cavazos and M. F. P. O’Boyle, “Method-specific dynamic
compilation using logistic regression,” inACM SIGPLAN Conference on
Object-Oriented Programming, Systems, Languages, and Applications
(OOPSLA), 2006, pp. 229–240.
[25] J. Pjesivac-Grbovic, G. Bosilca, G. E. Fagg, T. Angskun, and J. Dongarra, “Decision trees and MPI collective algorithm selection
problem,” inEuro-Par: International European Conference on Parallel
and Distributed Computing, 2007, pp. 107–117.
[26] J. Ansel, C. Chan, Y. L. Wong, M. Olszewski, Q. Zhao, A. Edelman, and S. Amarasinghe, “Petabricks: A language and compiler for algorithmic
choice,” in ACM SIGPLAN Conf. on Programming Language Design
and Implementation (PLDI), 2009, pp. 38–49.
[27] D. Grewe and M. F. P. O’Boyle, “A static task partitioning approach for
heterogeneous systems using opencl,” inProc. of the 20th International
Conference on Compiler Construction (CC), 2011, pp. 286–305.
[28] K. Kofler, I. Grasso, B. Cosenza, and T. Fahringer, “An automatic
input-sensitive approach for heterogeneous task partitioning,” in ACM
International Conference on Supercomputing (ICS), 2013, pp. 149–160.
[29] H. Jordan, S. Pellegrini, P. Thoman, K. Kofler, and T. Fahringer,
“INSPIRE: The Insieme parallel intermediate representation,” in Int.
Conference on Parallel Architectures and Compilation Techniques
(PACT), 2013, pp. 7–18.
[30] Z. Wang, G. Tournavitis, B. Franke, and M. F. P. O’Boyle, “Integrating profile-driven parallelism detection and
machine-learning-based mapping,”TACO, vol. 11, no. 1, p. 2, 2014.
[31] K. Kofler, B. Cosenza, and T. Fahringer, “Automatic data layout
optimizations for GPUs,” in Euro-Par: International Conference on
Parallel and Distributed Computing, 2015, pp. 263–274.
[32] K. Datta, M. Murphy, V. Volkov, S. Williams, J. Carter, L. Oliker, D. Patterson, J. Shalf, and K. Yelick, “Stencil computation optimization
and auto-tuning on state-of-the-art multicore architectures,” in
ACM/IEEE Conf. on Supercomputing (SC), 2008, pp. 4:1–4:12.
[33] Y. Zhang and F. Mueller, “Autogeneration and autotuning of 3d stencil
codes on homogeneous and heterogeneous GPU clusters,”IEEE Trans.
Parallel Distributed System, vol. 24, no. 3, pp. 417–427, Mar. 2013.
[34] T. Gysi, T. Grosser, and T. Hoefler, “Modesto: Data-centric
analytic optimization of complex stencil programs on heterogeneous
architectures,” in ACM International Conference on Supercomputing
(ICS), 2015, pp. 177–186.
[35] M. Christen, O. Schenk, and H. Burkhart, “Patus: A code generation and autotuning framework for parallel iterative stencil computations
on modern microarchitectures,” in IEEE International Parallel &
Distributed Processing Symposium (IPDPS), 2011, pp. 676–687.
[36] C. Yount, J. Tobin, A. Breuer, and A. Duran, “Yask-yet another stencil kernel: A framework for hpc stencil code-generation and tuning,” in Workshop on Domain-Specific Languages and High-Level Frameworks
for HPC (WOLFHPC), 2016, pp. 30–39.
[37] M. Christen, O. Schenk, and Y. Cui, “Patus for convenient
high-performance stencils: evaluation in earthquake simulations,” in Conference on High Performance Computing Networking, Storage and
Analysis (SC), 2012, p. 11.
[38] D. Guerrera, H. Burkhart, and A. Maffia, “Reproducible experiments in parallel computing: Concepts and stencil compiler benchmark study,” in
Euro-Par 2014: Parallel Processing Workshops, 2014, pp. 464–474.
[39] P. Auer, N. Cesa-Bianchi, and P. Fischer, “Finite-time analysis of the
multiarmed bandit problem,” Machine Learning, vol. 47, no. 2, pp.
235–256.
[40] S. Muralidharan, M. Shantharam, M. Hall, M. Garland, and B.
Catan-zaro, “Nitro: A framework for adaptive code variant tuning,” in IEEE
International Parallel and Distributed Processing Symposium (IPDPS),
2014, pp. 501–512.
[41] M. Stephenson and S. P. Amarasinghe, “Predicting unroll factors using
supervised classification,” inIEEE / ACM International Symposium on
Code Generation and Optimization (CGO), 2005, pp. 123–134.
[42] K. Stock, L.-N. Pouchet, and P. Sadayappan, “Using machine learning
to improve automatic vectorization,”ACM Trans. Archit. Code Optim.,
vol. 8, no. 4, pp. 50:1–50:23, Jan. 2012.
[43] T. Joachims, “Training linear SVMs in linear time,” inACM SIGKDD
International Conference on Knowledge Discovery and Data Mining
(KDD), 2006, pp. 217–226.
[44] ——, “Optimizing search engines using clickthrough data,” in ACM
SIGKDD International Conference on Knowledge Discovery and Data
Mining (KDD), 2002, pp. 133–142.
[45] G. H. Bakir, T. Hofmann, B. Sch¨olkopf, A. J. Smola, B. Taskar, and
S. V. N. Vishwanathan,Predicting Structured Data (Neural Information
Processing). The MIT Press, 2007.
[46] D. H. Wolpert and W. G. Macready, “No free lunch theorems for
optimization,”Trans. Evol. Comp, vol. 1, no. 1, pp. 67–82, Apr. 1997.
[47] M. Gendreau and J.-Y. Potvin, Handbook of Metaheuristics, 2nd ed.
Springer Publishing Company, Incorporated, 2010.