Dynamic Bayesian Networks to predict sequences of organ failures in
patients admitted to ICU
Micol Sandri
a, Paola Berchialla
b, Ileana Baldi
c, Dario Gregori
c,⇑, Roberto Alberto De Blasi
d aAnesthesiology, Intensive Care and Pain Therapy Centre, University of Verona, Department of Surgical Science, Italy b
Department of Clinical and Biological Sciences, University of Torino, Italy c
Unit of Biostatistics, Epidemiology and Public Health, Department Cardiac, Thoracic and Vascular Sciences, University of Padova, Italy d
Department of Medical Surgical Sciences, University of Rome ‘‘Sapienza’’, Italy
a r t i c l e
i n f o
Article history:
Received 12 June 2013 Accepted 11 December 2013 Available online 19 December 2013
Keywords:
Dynamic Bayesian Network Intensive Care
SOFA score
a b s t r a c t
Multi Organ Dysfunction Syndrome (MODS) represents a continuum of physiologic derangements and is the major cause of death in the Intensive Care Unit (ICU). Scoring systems for organ failure have become an integral part of critical care practice and play an important role in ICU-based research by tracking dis-ease progression and facilitating patient stratification based on evaluation of illness severity during ICU stay.
In this study a Dynamic Bayesian Network (DBN) was applied to model SOFA severity score changes in 79 adult critically ill patients consecutively admitted to the general ICU of the Sant’Andrea University hospital (Rome, Italy) from September 2010 to March 2011, with the aim to identify the most probable sequences of organs failures in the first week after the ICU admission. Approximately 56% of patients were admitted into the ICU with lung failure and about 27% of patients with heart failure. Results suggest that, given the first organ failure at the ICU admission, a sequence of organ failures can be predicted with a certain degree of probability. Sequences involving heart, lung, hematologic system and liver turned out to be the more likely to occur, with slightly different probabilities depending on the day of the week they occur.
DBNs could be successfully applied for modeling temporal systems in critical care domain. Capability to predict sequences of likely organ failures makes DBNs a promising prognostic tool, intended to help phy-sicians in undertaking therapeutic decisions in a patient-tailored approach.
Ó2014 Published by Elsevier Inc.
1. Introduction
The Multi Organ Dysfunction Syndrome (MODS) has a reported incidence in Intensive Care Unit (ICU) patients of approximately 20%[1]and it is the main cause of morbidity and mortality among the admittance diagnoses [2–6]. The mortality rate ranges from 30% to 100% [7] depending on the number of organs involved and the degree or the duration of their dysfunction[5,8]. Notwith-standing the use of newer and more effective drugs and advanced technologies supporting the organ function, the incidence of MODS has increased in the last decade[9]extending patients’ length of ICU stay, raising the use of invasive equipment and the need for qualified nursing and medical assistance, with a huge impact on the healthcare costs[10,11].
Since MODS implies a systemic inflammatory reaction leading to diffuse microcirculatory dysfunction, it can be seen as a dynamic process in which at least two organs are consecutively or simulta-neously involved[12].
Organ dysfunction can be assessed by a few severity scores: the Sequential Organ Failure Assessment (SOFA)[13], the Logistic Or-gan Dysfunction Score (LODS)[14]and the Multiple Organ Failure Score (MOFS)[15]. All of them consider the degree of dysfunction of six organ systems: lung, heart, liver, kidney, central nervous sys-tem and hematologic syssys-tem.
Using organ severity scores facilitates physicians in sharing a common language, elaborating and comparing statistical surveys and providing quality control in health care. Despite these scores are appropriate in describing the characteristics of patients admit-ted to an ICU and their expecadmit-ted outcome, they are not meant to support the decision-making process during the daily management in the ICU.
Whereas LODS predicts mortality on the basis of many param-eters recorded within the first 24 h after admission, SOFA and MOFS are computed on admission and every 24 h until patient
1532-0464/$ - see front matterÓ2014 Published by Elsevier Inc.
http://dx.doi.org/10.1016/j.jbi.2013.12.008
⇑Corresponding author. Address: Department of Cardiac, Thoracic and Vascular Sciences, University of Padova, Via Loredan, 18, 35131 Padova, Italy. Fax: +39 02 700445089.
E-mail address:[email protected](D. Gregori).
Contents lists available atScienceDirect
Journal of Biomedical Informatics
death or discharge from the ICU fulfilling the need of evaluating changes in patient status over time. Besides the feasibility of repet-itive measurements with low margin of error[7]and a good out-come prediction[16], the SOFA score, unlike the MOFS, takes into account the vasoactive drugs for cardiovascular system evaluation
[17]. It was designed to be simple enough for regular use and, de-spite some lack of accuracy in recording it in clinical practice, it en-ables the recognition of organ failure and detection of change[18]. In fact, the SOFA score is based on a variety of easily measurable clinical parameters and provides a graded score from 0 to 4 for each of the following organ systems: cardiovascular, respiratory, central nervous, renal, hematologic and hepatic[13].
SOFA-based models at admission seem to be competitive in pre-dicting mortality with severity of illness models limited to the first 24 h from admission. Furthermore models based on sequential SOFA scores have shown comparable performance with other indi-vidual organ failure scores[19].
For these reasons, this study was focused on SOFA score. Results from many clinical studies showed SOFA score changes over time are associated with ICU mortality[7,17,20]. Thus, a tem-poral modeling approach of SOFA scores could allow for an inves-tigation on the evolution of organ failures in critically ill patients
[21].
While most of the research on MODS focuses on the relation be-tween organ failures and ICU or hospital mortality [20,22–25], some attempts in describing the dynamics of organ failure over time have already been made[26,27]. In[28]hierarchical Dynamic Bayesian Networks (DBNs) have been used to model day-to-day changes in organ failure in ICU patients.
During the last decade, Bayesian Networks (BNs) have raised much interest in medicine[29]for their capability to model com-plex systems in which relationships between the many variables involved are not completely known and to provide a causal inter-pretation instead of merely capture association. For these reasons they have become popular as prognostic models. DBNs add to BNs the benefits of temporal modeling[30], allowing, for example, to model the temporal order and duration of the symptoms, which are often closely related to the prognosis as well as treatment selection.
In this study a DBN was applied to model SOFA score changes in adult critically ill patients consecutively admitted to a general ICU, with the aim to identify the most probable sequences of organs failures in the first week after the ICU admission. This was be done by identifying a set of clinical patient states, i.e. a set of possible or-gan failures, and modeling probabilities that states are followed by other states or persist over time.
As a generalization of the model implemented by[28], in which the complexity of the model was restricted by allowing only rela-tions among organ failures at different time points, conditional probabilistic dependencies among multiple organ failures which can occur within the same day, were also modeled.
2. Materials and methods
2.1. Data collection
The study was conducted at the Sant’Andrea University hospital in Rome using the ICU clinical database (Margherita Core Data Set 4.2 and Dasila). Data were retrospectively collected from patients who were consecutively admitted to the general ICU of the San-t’Andrea University hospital from September 2010 to March 2011. Patients were included if they had at least two organ systems with a SOFA scoreP2. Patients younger than 18 years or with hos-pital stay shorter than 48 h were excluded. Only the first admission was considered for patients who had multiple ICU admissions.
After application of inclusion and exclusion criteria, 73 patients were eligible for the analysis. During the ICU stay, patients were treated according to the revised international guidelines and the organ function was mechanically replaced when needed (i.e. mechanical ventilation, hemodyalisis, etc.). The final data set in-cluded demographic data, type of ICU admission according to the Simplified Acute Physiology Score II (SAPS II)[31], Major Diagnos-tic Category (MDC) based on the mapping defined by the National Health System’s Diagnostic Related Group, ICU mortality rate and final hospital outcome.
Data were collected from clinical reports, laboratory tests, car-diovascular monitoring and vasoactive drugs dosage for the daily SOFA score compilation[13]. For patients who were sedated during the period of data collection we considered the Glasgow Coma Score[32]assessed before sedation[33]. Missing values were re-placed by the mean computed on the values recorded the previous and the following day.
For each patient included in the study, the SOFA score was com-puted daily for 7 consecutive days. For each day we considered a 24 h period starting from 12.00 a.m. except for the first day (the day of entry into the ICU), for which: (i) when inclusion criteria ap-peared before 12:00 p.m. we considered the 24 h period starting from the previous12:00 a.m.; (ii) when inclusion criteria appeared after 12:00 p.m. we pooled the fraction of the day until the subse-quent 12:00 a.m. and the following 24 h. The observational period was shorter than 7 days for patients who died or were discharged from the ICU. The online calculator of the French Society of Anes-thesia and Intensive Care (Société Française d’Anesthesie et de Réanimation) was used [13]. Finally for each organ system, the SOFA score was categorized into a binary variable: ‘‘non-failure’’ (SOFA score62) and ‘‘failure’’ (SOFA score >2)[7].
The institutional review board approved the study protocol. 2.2. Bayesian networks
BNs belong to the family of probabilistic graphical models[34]. They consist in a set of nodes and a set of arcs that form a directed acyclic graph (DAG); each node represents a domain variable whereas arcs represent conditional probabilistic relationships among variables[35].
The relationships in the graph are usually described as it is done in human genealogies. A variable, which is dependent on other variables, is often referred to as a child node, so for example par-ent–child relationship betweenX1andX2nodes is present when
there is an arrow fromX1toX2. Likewise, directly preceding
vari-ables are called parents.
Beside the graphical structure, a fully specified BN requires the construction of conditional probability tables for each node. For nodes with no arcs entering them (no parent nodes), only single prior distribution needs to be specified. For nodes with a single parent, a conditional probability distribution has to be specified for each possible state of the parent variable. Finally, for nodes with more than one parent, a conditional probability distribution is required for every possible combination of parent states. 2.3. Dynamic Bayesian Networks
While a BN is a static model, representing the joint probability distribution at a fixed point, a DBN can represent the evolution of a system over time. In particular, DBNs allow for representing vari-ables at multiple time points within the same network structure.
One of the most popular methods to model time within BNs is due to[36]. In their approach, time is modeled as in discrete Mar-kov Chain model and each variable of the domain has a time index to indicate which time slice it belongs to. Beside the static (within slice) conditional probabilistic dependencies, DBNs contain
additional temporal dependencies, which are represented by arcs between the time slices.
3. Calculation
3.1. Dynamic Bayesian Network formulation
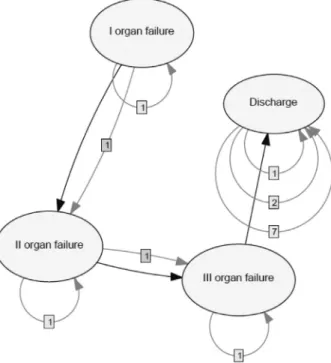
The DBN is shown inFig. 1. The arcs identify direct probabilistic dependencies between the variables. The static structure of the BN is given by the arrows without number, i.e. when there is no num-ber on an arc the relationship is within the same time slice.
Since the analysis of six potential organ failures has a poor clin-ical utility and reduces the statistclin-ical significance of the results, only a maximum of three organ failures at a fixed time t was modeled.
The node variables ‘‘I organ failure’’, ‘‘II organ failure’’ and ‘‘III organ failure’’ take as value the organ that has failed. Furthermore they have an additional state ‘‘no organ failure’’ that a patient en-ters if his/her SOFA score is62. Since more than one organ failure can occur and the order of the failures was not known, it was sug-gested by physicians to consider the following priority order for assigning each failure to the relevant node variable: heart, lung, central nervous system, kidney, hematological system and liver. For example, if on the same day heart, kidney and lung organ fail-ures are observed, the node variables I, II and III organ failure take value ‘‘heart’’, ‘‘lung’’ and ‘‘kidney’’, respectively. However, when an organ failure at timetpersists at timet+ 1, this will be the first organ failure att+ 1, regardless of the priority order. For example, if a kidney failure (as I organ failure) persists from timetto time t+ 1, it will be recorded as I organ failure at time t+ 1 even if a heart failure occurs at timet+ 1.
The static structure of the BN was built so that within the same time slice (same day) the second organ to fail depends on the first organ which has failed in the same day, and the potential third fail-ure is conditioned to the second organ that has failed and indi-rectly to the first one.
Instead, the number appearing on arrows indicates dependence across time slices and the number itself denotes the order of the
dependence. So for example inFig. 1, the first organ failure at time slices (day)tandt+ 1 are probabilistically dependent.
In addition a node for patient discharge was also considered. Discharge variable takes only two states: still in the ICU vs. dis-charged from the ICU. At a fixed timetpatient discharge is directly conditioned by the third organ failure and thus indirectly by the first and the second ones. Over time, beside a first order depen-dence, (i) a second order dependence was imposed in order to take into account the fact that no patient discharges were recorded on the second day, according to the inclusion criteria; and (ii) a sev-enth order dependence was imposed to take into account that after a week all patients were discharged or deceased.
The Expectation Maximization (EM) algorithm was run for learning conditional probabilities. The EM algorithm starts with some initial parameter vector, which specifies a current estimate of the transition between states probability matrix and the condi-tional probability of hidden states given observations (a DBN can be viewed as BNs with identical repetition over time where each network contains a number of random variables representing observations and hidden states of the process). In our case, since no hidden states were modeled and no missing values were pres-ent, the EM algorithm computes the expected sufficient statistics (ESS) of the observed data using the matrices of the process to cal-culate the Expectation. A new parameter vector can then be com-puted from the ESS by a simple maximum likelihood step. These two steps are iterated until an appropriate stopping condition is met[37]. The learning of the conditional probability tables was performed on the entire dataset. Then a 10-fold cross-validation
[38]was run in order to assess the accuracy of the model on the nodes: I, II and III organ failure.
The DBN was implemented using GeNIe[39].
4. Results
The 73 consecutive patients included in the study had a preva-lence of males, medical ICU admission and respiratory diseases. The mean age was 65.96 ± 14.25. The ICU mortality rate was 42.5% (Table 1). Overall, 41 out of 73 patients (56%) were evaluated for less than 8 days.
Fig. 1.Dynamic Bayesian Network for organ system failure.
Table 1
Demographic data,type of ICU admission, major diagnostic categories and ICU and Hospital Outcomes of the 73 patients considered for the analysis.
Characteristics
Age, years, mean ± SD 65.95 ± 14.25 Gender, male,n(%) 49 (67.1)
Type of ICU admission, n (%)
Medical 48 (65.8)
Elective surgery 12 (16.4) Emergency surgery 13 (17.8)
Major diagnostic categories, n (%)
Respiratory diseases 28 (38.3) Gastrointestinal diseases 11 (15.1) Nervous system diseases 10 (13.7) Liver and pancreatic diseases 7 (9.6) Cardiocirculatory diseases 6 (8.2) Systemic infectious diseases 6 (8.2) Myeloproliferative disorders and poorly differentiated
tumors
3 (4.1) Hematologic, immunological and hemopoietic organ diseases 1 (1.4) Endocrine, metabolic and nutritional diseases 1 (1.4)
Outcomes
ICU stay, days, median, (IQR) 7 (3–106) Hospital length of stay, days, median (IQR) 19 (3–116) ICU deaths, n (%) 31 (42.5) Hospital deaths, n (%) 30 (41.1)
InFig. 1, the DBN is depicted. The network was constructed in order to model a maximum of three organ failures. The numbered arrows represent the time dependence (the order is given by the number, e.g. 1 indicates a dependency between the daytand the dayt 1), while the not numbered arrows indicate the probabilis-tic relationships between nodes (I organ failure; II organ failure; III organ failure and Discharge) on the same day. The node labeled Discharge was introduced for taking into account the discharge/ mortality of patients admitted at the ICU. InFig. 2, the DBN un-rolled (limited to times from 0 to 2) is shown.
Table 2shows the transition probabilities between the first or-gan failure at timet 1 and timet, i.e. probability of observing a first organ failure at timetconditioned to the first organ failures observed at timet 1. For example if at timet 1 a heart failure is observed, there is about 82% of probability that the heart failure persists at timetand 8% of probability that heart recovers whereas lung fails at timet. Presence of zeros is mainly due to the imposed ordering of organ failures occurrence in the same day. As an exam-ple a first hematologic system failure at timet 1 can either per-sist at timetor recover. Other first organ failure probabilities at timetconditional to hematologic system failure at timet 1 are equal to zero since the hematologic system is ranked low in the or-gan priority ordering.
Approximately 56% of patients were admitted into the ICU with lung failure and about 27% of patients with heart failure. During the subsequent 7 days there was a steady decrease in the probabil-ity of observing again lung and heart failures.
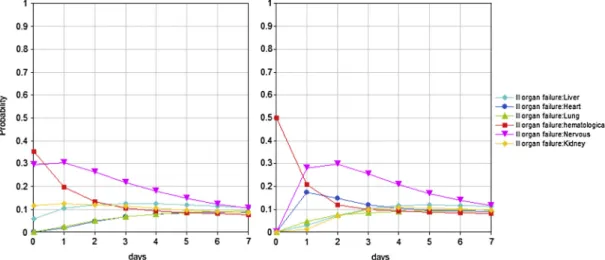
Overall, 85% of patients who are admitted into the ICU with heart failure have also lung failure at the entry.Fig. 3shows the probability of a third organ failure given lung and heart organ fail-ure at the entry into the ICU (day 0). Approximately, 35% of pa-tients have the probability to experience a failure at the hematological system at day 0. This probability decreases to 20% at day 1.
Given no III organ failure at day 0, there is also 12% of probabil-ity to have a liver failure at day 2.
Given heart failure at day 0, 10% of patients have also kidney failure as II organ failure and 11.7% as III organ failure among those 85% who experienced a lung failure as II organ failure.
Furthermore, among those who had heart and kidney failure at day 0, there is 50% of probability of observing as III organ failure a hematological system failure at day 0 and 27% and 29% of probabil-ity of nervous system failure at day 1 and day 2, respectively (Fig. 4).
Among patients with lung failure only (without heart failure) at day 0, about 17% have also nervous system and about 19% have
Fig. 2.DBN unrolled from timet= 0 (slice 0) to timet= 2 (slice 2). Inter-slice dependencies do not change over time. A further dependency was draw between the node Discharge att= 0 andt= 7, due to the limited observation time frame, restricted to 7 days after which all patients were either discharged or dead.
Table 2
Probability of I organ failure at timetgiven organ failure at timet 1. Timet-1
Timet Liver Lung Heart Hematologic system Nervous system Kidney None
Liver 0.692 0.014 0 0 0 0.026 0 Lung 0.231 0.780 0.088 0 0 0 0.038 Heart 0 0.014 0.824 0 0 0 0.005 Hematologic system 0 0.007 0 0.733 0.040 0 0.011 Nervous system 0 0.014 0.011 0 0.840 0 0 Kidney 0 0.007 0.033 0 0.040 0.872 0.005 None 0.077 0.164 0.044 0.267 0.080 0.103 0.940
hematological system failures on the same day (seeSupplemental tables). Among those with hematological system failure (Fig. 4), there is 33%, 23% and 17% of probability to have liver failure at day 0, day 1 and day 2, respectively. Among those with nervous system failure, there is 25% of probability of kidney or hematologic failure at day 0 (Fig. 4).
Among patients with kidney failure as I organ failure, probabil-ity to develop another organ failure is very low, whereas the prob-ability of a persistent kidney failure ranges from 76% to 58% from day 1 to day 4 (seeSupplemental material).
Cross-validation results were reported inTable 3. Accuracy for predicting specific organ failure or no failure for the three variables I, II and III organ failure was reported at the different time points. Multiclass AUC[40]and Brier score were also reported. Overall, I organ failure node achieved over time an accuracy of 71.62%, II or-gan failure node of 75.54% and III oror-gan failure node 74.95%.
5. Discussion
While the use of new and more effective drugs and sophisti-cated technology supporting the organ function reduced the mor-tality of patients by avoiding a rapid fatal outcome, it also extended the ICU recovery time due to an increased risk of onset and
persistence of systemic inflammation and MODS, which alters the functional relationship among organs.
It has often been pointed out that usual therapies are initiated too late, when MODS is already present. Since the performance of each organ affects the behaviour of the whole body, it is impor-tant to set up prognostic tools for studying the organs’ temporal patterns, which allow physicians to anticipate MODS’s develop-ment or limit the extent of organ dysfunction when the syndrome arises[10,14,41].
BNs have been amply utilized in biomedical field as prognostic tools. Much of their appeal can be attributed to the flexibility the modeling framework provides. For example the same BN can pre-dict the probability of a clinical adverse outcome as well as diag-nose its causes. However, the MODS dynamics is an unfolding of events over time, which makes new evidence available in time-points. While BNs and more traditional prognostic models hardly account for the temporal pattern of ongoing processes, the benefit of temporal modeling of clinical problems has become clear in practice. In a few cases, DBNs have been successfully applied for modeling temporal systems in medical domain[42–44].
Recently, DBNs have been used to describe changes in organ failure in ICU patients. In[45], DBNs were implemented to predict mortality outcome in ICUs and showed the cardiovascular and re-nal system SOFA scores were among the most dominant predictors Fig. 3.Sequence probability of a III organ failure given lung and heart failure at the entry into the ICU (left); sequence probability of a III organ failure given heart and kidney failure at the entry into the ICU (right).
Fig. 4.Sequence probability of a III organ failure given lung and hematologic system failure at the entry into the ICU (left); sequence probability of a III organ failure given lung and nervous system failure at the entry into the ICU (right).
of survival. Data were used to learn both the structure and the probability tables of stationary and non-stationary DBNs. Another application of DBNs, which made use of SOFA score, was given by[28]who implemented
Three different models: a first to describe the relationship be-tween the amount of organ failures, expressed as the number of or-gan failures (0, 1, 2, 3, >3), and the probability of a prolonged ICU stay and death; a second to investigate the relationship between a specific organ failure at timet and the potential organ failure on day t+ 1 and the final outcome. Finally, a third model was implemented to relax assumptions made in the second model that organ failure persistence and organ failure development follow the same clinical process. In the second and the third model, a hierar-chical Bayesian network structure was developed along with mul-tinomial logistic regression models for estimating the transition probabilities.
One important difference between these studies and ours is that we focused on predicting sequences of organ failures rather than clinical exit (ICU death or ICU discharge). For this purpose, we introduced the node Discharge in the model to control for the fixed observation time frame (7 days). With this regard, the limited observational period of 7 consecutive days, after which patients were either discharged or deceased, resulted in a DBN that was not Markovian since it required the definition of a conditional probabilistic dependency between the observation at the seventh day and the observation at day one.
As opposed to[45], we did not use the data to learn the struc-ture of the DBN. Indeed, as pointed out by[28], the choice of work-ing with a fixed model structure is common in medical statistics since the procedure of variable selection, which is usually based on significance testing, is considered arbitrary depending on the le-vel of significance and the size of the data.
Following[28], with have used a fixed model structure. How-ever we choose to use a learning algorithm strategy to estimate the conditional probability tables. This allowed us to overcome the drawback of a linear relationship assumption between the
pre-dictor variables and the state the patient enters at timet+ 1 as in Peelen et al.[28]who used additive logistic regression equations. Moreover, in our study the DBN was developed by modeling both the probability of organ failure at timet+ 1 given organ fail-ures at timetand the probability of observing multiple organ fail-ures at the same time pointt, i.e. over the same day. In fact, to reduce the complexity of the model, in[28]only relations between variables from different time points were allowed, whereas rela-tions between variables within the same time slice were absent.
Over the time frame of 7 days, the accuracy achieved by the DBN over I, II and III organ failure node is quite good, ranging from about 71.62% to 74.95%. More likely, the lack of performance in detecting some specific organ failures is affected by the limited sample size and consequently by having some specific states rep-resented by very few data instances. It is also worth to be noted that the accuracy is discrete/good for timet= 1 andt= 2 when spe-cific organ failures are sufficiently large and worsen at later times. Calibration (Brier score) is good enough for I and II organ failure.
Since in[28]the accuracy of the models is assessed on ICU mor-tality, only for comparison purposes, a 10-fold cross-validation was carried out on the Discharge node. Over the time frame of 7 days, the DBN achieved an accuracy of 76.54%, which is comparable with the accuracy of model II (82%, 95%CI:73–90%) and model III 82% (95%CI:74–90%) in[28]for death within a week.
Our results showed the existence of organ failure sequences that are more likely to occur and suggest that, given the first organ failure at the ICU admission, a sequence of organ failures can be predicted. Using our limited set of data, given the first organ fail-ure, sequences of organ failures more likely to occur turned out to be: (i) Heart?Lung?Nervous system or Hematologic system; (ii) Lung?Nervous system?Kidney or Hematologic system; (iii) Lung?Hematologic system?Liver; and (iv) Heart? Kid-ney?Hematologic system or Nervous system. Finally, according to what reported in[28], once renal failure occurs, probability of developing a subsequent heart failure is nearly around zero, show-ing (i) no association between renal failure and development of Table 3
Accuracy of DNB for predicting specific organ failure or no failure for variables I organ failure, II organ failure and III organ failure at different time points. Results are reported as%(nr of predicted failures/nr of actual failures).
Accuracy Multiclass AUC Brier score
Liver Lung Heart Hematologic system Nervous system Kidney No Organ Failure
I organ failure (Node accuracy: 71.62%)
t= 1 100(2/2) 86.67(26/30) 83.33(15/18) 0(0/2) 80(4/5) 50(2/4) 91.67(11/12) 0.73 0.19 t= 2 0(0/2) 81.48(22/27) 78.57(11/14) 0(0/3) 50(2/4) 33.33(2/6) 88.24(15/17) 0.77 0.2 t= 3 0(0/1) 47.62(10/21) 66.67(8/12) 0(0/4) 0(0/2) 16.67(1/6) 92.59(25/27) 0.77 0.18 t= 4 0(0/1) 50(9/18) 70(7/10) 0(0/2) 0(0/3) 14.29(1/7) 100(32/32) 0.77 0.19 t= 5 0(0/1) 57.14(8/14) 77.78(7/9) 0(0/2) 0(0/4) 14.29(1/7) 100(36/36) 0.77 0.21 t= 6 0(0/3) 66.67(8/12) 87.5(7/8) 0(0/1) 0(0/3) 0(0/6) 97.5(39/40) 0.79 0.19 t= 7 0(0/2) 70(7/10) 85.71(6/7) 0(0/1) 0(0/3) 0(0/4) 95.65(44/46) 0.75 0.22
II organ failure (Node accuracy: 75.54%)
t= 1 0(0/2) 94.12(16/17) - 22.22(2/9) 0(0/3) 0(0/7) 94.29(33/35) 0.76 0.19 t= 2 0(0/2) 85.71(12/14) 0(0/1) 22.22(2/9) 0(0/4) 0(0/3) 100(40/40) 0.82 0.23 t= 3 0(0/1) 81.82(9/11) 0(0/2) 42.86(3/7) 20(1/5) 0(0/3) 100(44/44) 0.69 0.24 t= 4 100(1/1) 80(8/10) 0(0/5) 50(3/6) 50(2/4) 0(0/2) 100(45/45) 0.68 0.26 t= 5 0(0/3) 54.55(6/11) 0(0/3) 42.86(3/7) 0(0/3) 0(0/3) 90.7(39/43) 0.62 0.22 t= 6 0(0/2) 55.56(5/9) 0(0/1) 42.86(3/7) 0(0/3) 0(0/3) 89.58(43/48) 0.71 0.2 t= 7 0(0/1) 33.33(2/6) 0(0/2) 20(1/5) 0(0/3) 0(0/4) 96.15(50/52) 0.69 0.21
III organ failure (Node accuracy: 74.95%)
t= 1 0(0/4) 50(2/4) – 40(2/5) 100(6/6) 66.67(2/3) 92.16(47/51) t= 2 0(0/1) 40(2/5) 0(0/1) 0(0/3) 71.43(5/7) 50(2/4) 82.69(43/52) 0.60 0.27 t= 3 0(0/3) 0(0/4) – – 20(1/5) 80(4/5) 87.5(49/56) 0.62 0.26 t= 4 0(0/2) 0(0/1) 0(0/1) 0(0/1) 20(1/5) 40(2/5) 87.93(51/58) 0.71 0.29 t= 5 0(0/3) 0(0/1) 0(0/2) 0(0/2) 0(0/2) 0(0/4) 93.22(55/59) 0.58 0.27 t= 6 0(0/3) 0(0/3) 0(0/2) 0(0/1) 0(0/2) 0(0/1) 88.52(54/61) 0.62 0.28 t= 7 0(0/2) 0(0/4) 0(0/4) 0(0/3) 0(0/2) – 94.83(55/58) 0.64 0.29
cardiovascular failure, whereas probability of persistence in renal failure remains high.
6. Conclusions
The DBN showed the existence of sequences of organ failures more likely to occur than others.
Further analysis is demanded in order to assess the severity of the organ dysfunction as function of the SOFA score on a larger sample, distinguishing between organ failure and organ insuffi-ciency, and to validate results in different populations of patients to determine whether adaptation of the model is necessary to make it suitable for applications in all clinical settings. The use of other severity scores, such as SAPSII, could be considered to refine the model further.
The fact that the order in which organ failures occurred was not known and a fictitious ordering was imposed must be acknowl-edged as a limitation of the current model. In this context, more than one organ failure should be interpreted as multiple organ fail-ures which occur in association rather than in a causation relation-ship. Indeed, apart from the order in which failures appear, their combination is also important[46]. A solution to this issue would be collecting the time of each organ failure.
A prompt and well-timed treatment besides bearing on mortal-ity and morbidmortal-ity related to MODS would be the best way to limit the inflammatory response[3]and improve the availability of crit-ical care, mostly by achieving a shorter length of stay. Capability to predict sequences of likely organ failures makes DBNs a promising prognostic tool for physicians, who can thus treat patients timely in order to avoid further organ dysfunctions. A tool for predicting organs that are likely to fail in an individual patient might help in undertaking a therapeutic strategy tailored to that patient, mod-ifying his/her prognosis or testing a treatment efficacy.
Appendix A. Supplementary material
Supplementary data associated with this article can be found, in the online version, athttp://dx.doi.org/10.1016/j.jbi.2013.12.008.
References
[1]Cabre L, Mancebo J, Solsona JF, Saura P, Gich I, Blanch L, et al. Multicenter study of the multiple organ dysfunction syndrome in intensive care units: the usefulness of sequential organ failure assessment scores in decision making. Intensive Care Med 2005;31:927–33.
[2]Baue AE. Multiple organ failure, multiple organ dysfunction syndrome, and systemic inflammatory response syndrome. Why no magic bullets? Arch Surg 1997;132:703–7.
[3]Deitch EA. Multiple organ failure. Pathophysiology and potential future therapy. Ann Surg 1992;216:117–34.
[4]Tran DD, Cuesta MA, van Leeuwen PA, Nauta JJ, Wesdorp RI. Risk factors for multiple organ system failure and death in critically injured patients. Surgery 1993;114:21–30.
[5]Zimmerman JE, Knaus WA, Wagner DP, Sun X, Hakim RB, Nystrom PO. A comparison of risks and outcomes for patients with organ system failure: 1982–1990. Crit Care Med 1996;24:1633–41.
[6]Lopez SA, Diaz JS, Lopez EB, Olivares PG, Garcia JG, Munoz IR. Analysis of morbimortality in patients with multiorgan dysfunction. Crit Care 2008;12:P498.
[7]Vincent JL, de Mendonca A, Cantraine F, Moreno R, Takala J, Suter PM, et al. Use of the SOFA score to assess the incidence of organ dysfunction/failure in intensive care units: results of a multicenter, prospective study. Working group on ‘‘sepsis-related problems’’ of the European society of intensive care medicine. Crit Care Med 1998;26:1793–800.
[8]Knaus WA, Draper EA, Wagner DP, Zimmerman JE. Prognosis in acute organ-system failure. Ann Surg 1985;202:685–93.
[9] Cuenca Solanas M. Multiple organ dysfunction syndrome. Enfermeria intensiva/Sociedad Espanola de Enfermeria Intensiva y Unidades Coronarias; 1999;10:71–80.
[10]Rogers J, Fuller HD. Use of daily acute physiology and chronic health evaluation (APACHE) II scores to predict individual patient survival rate. Crit Care Med 1994;22:1402–5.
[11]Vincent JL, Sakr Y, Sprung CL, Ranieri VM, Reinhart K, Gerlach H, et al. Sepsis in European intensive care units: results of the SOAP study. Crit Care Med 2006;34:344–53.
[12]Levy MM, Fink MP, Marshall JC, Abraham E, Angus D, Cook D, et al. 2001 SCCM/ ESICM/ACCP/ATS/SIS international sepsis definitions conference. Intensive Care Med 2003;29:530–8.
[13]Vincent JL, Moreno R, Takala J, Willatts S, De Mendonca A, Bruining H, et al. The SOFA (sepsis-related organ failure assessment) score to describe organ dysfunction/failure. On behalf of the working group on sepsis-related problems of the European society of intensive care medicine. Intensive Care Med 1996;22:707–10.
[14]Le Gall JR, Klar J, Lemeshow S, Saulnier F, Alberti C, Artigas A, et al. The logistic organ dysfunction system a new way to assess organ dysfunction in the intensive care unit. ICU scoring group. JAMA, J Am Med Assoc 1996;276: 802–10.
[15]Marshall JC, Cook DJ, Christou NV, Bernard GR, Sprung CL, Sibbald WJ. Multiple organ dysfunction score: a reliable descriptor of a complex clinical outcome. Crit Care Med 1995;23:1638–52.
[16]Khwannimit B. A comparison of three organ dysfunction scores: MODS, SOFA and LOD for predicting ICU mortality in critically ill patients. J Med Assoc Thailand = Chotmaihet Thangphaet 2007;90:1074–81.
[17]Peres Bota D, Melot C, Lopes Ferreira F, Nguyen Ba V, Vincent JL. The multiple organ dysfunction score (MODS) versus the sequential organ failure assessment (SOFA) score in outcome prediction. Intensive Care Med 2002;28:1619–24.
[18]Tallgren M, Backlund M, Hynninen M. Accuracy of sequential organ failure assessment (SOFA) scoring in clinical practice. Acta Anaesthesiol Scand 2009; 53:39–45.
[19]Minne L, Abu-Hanna A, de Jonge E. Evaluation of SOFA-based models for predicting mortality in the ICU: a systematic review. Crit Care 2008;12:R161. [20]Moreno R, Vincent JL, Matos R, Mendonca A, Cantraine F, Thijs L, et al. The use of maximum SOFA score to quantify organ dysfunction/failure in intensive care. Results of a prospective, multicentre study. Working group on sepsis related problems of the ESICM. Intensive Care Med 1999;25:686–96. [21]Kilic YA, Yorganci K, Sayek I. Visualizing multiple organ failure: a method for
analyzing temporal and dynamic relations between failing systems and interventions. Crit Care 2007;11:417.
[22]Toma T, Abu-Hanna A, Bosman RJ. Discovery and inclusion of SOFA score episodes in mortality prediction. J Biomed Inform 2007;40:649–60. [23]Levy MM, Macias WL, Vincent JL, Russell JA, Silva E, Trzaskoma B, et al. Early
changes in organ function predict eventual survival in severe sepsis. Crit Care Med 2005;33:2194–201.
[24]Ferreira FL, Bota DP, Bross A, Melot C, Vincent JL. Serial evaluation of the SOFA score to predict outcome in critically ill patients. JAMA, J Am Med Assoc 2001;286:1754–8.
[25]Russell JA, Singer J, Bernard GR, Wheeler A, Fulkerson W, Hudson L, et al. Changing pattern of organ dysfunction in early human sepsis is related to mortality. Crit Care Med 2000;28:3405–11.
[26] Visscher S, Lucas P, Ildik/, /#243, Flesch, Schurink K. Using Temporal Context-Specific Independence Information in the Exploratory Analysis of Disease Processes. In: Proceedings of the 11th conference on Artificial Intelligence in Medicine. Amsterdam, The Netherlands: Springer-Verlag; 2007. p. 87–96.
[27]Charitos T, Gaag LCvd, Visscher S, Schurink KAM, Lucas PJF. A dynamic Bayesian network for diagnosing ventilator-associated pneumonia in ICU patients. Expert Syst Appl 2009;36:1249–58.
[28]Peelen L, de Keizer NF, Jonge E, Bosman RJ, Abu-Hanna A, Peek N. Using hierarchical dynamic Bayesian networks to investigate dynamics of organ failure in patients in the intensive care unit. J Biomed Inform 2010;43:273–86. [29]Lucas PJ, van der Gaag LC, Abu-Hanna A. Bayesian networks in biomedicine
and health-care. Artif Intell Med 2004;30:201–14.
[30] Ghahramani Z. Learning Dynamic Bayesian Networks. Adaptive Processing of Sequences and Data Structures, International Summer School on Neural Networks, ‘‘ER Caianiello’’-Tutorial Lectures: Springer-Verlag; 1998. p. 168–97. [31]Le Gall JR, Lemeshow S, Saulnier F. A new simplified acute physiology score (SAPS II) based on a European/North American multicenter study. JAMA, J Am Med Assoc 1993;270:2957–63.
[32]Teasdale G, Jennett B. Assessment of coma and impaired consciousness. Lancet 1974;304:81–4.
[33]Livingston BM, Mackenzie SJ, MacKirdy FN, Howie JC. Should the pre-sedation Glasgow coma scale value be used when calculating acute physiology and chronic health evaluation scores for sedated patients? Scottish intensive care society audit group. Crit Care Med 2000;28:389–94.
[34] Lauritzen SL. Graphical models. Repr. with corrections. ed. Oxford: Oxford University Press; 2004.
[35] Jensen FV. Bayesian Networks and Decision Graphs: Springer; 2001. [36]Dean T, Kanazawa K. A model for reasoning about persistence and causation.
Comput Intell 1989;5:142–50.
[37]Murphy KP. Dynamic Bayesian networks: representation inference and learning. UC Berkeley; 2002.
[38]Frank E, Harrell J. Regression modeling strategies. New York: Springer-Verlag, Inc.; 2006.
[39] Decision Systems Laboratory – University of Pittsburgh. GeNIe 2.0, <http:// www.sis.pitt.edu/~genie/>; 2006.
[40]Hand DJ, Till RJ. A simple generalisation of the area under the ROC curve for multiple class classification problems. Mach Learn 2001;45:171–86.
[41]Murray MJ, Coursin DB. Multiple organ dysfunction syndrome. Yale J Biol Med 1993;66:501–10.
[42]Andreassen S, Benn JJ, Hovorka R, Olesen KG, Carson ER. A probabilistic approach to glucose prediction and insulin dose adjustment: description of metabolic model and pilot evaluation study. Comput Methods Programs Biomed 1994;41:153–65.
[43]Hernando ME, Gomez EJ, Corcoy R, del Pozo F. Evaluation of DIABNET, a decision support system for therapy planning in gestational diabetes. Comput Methods Programs Biomed 2000;62:235–48.
[44]van Gerven MA, Taal BG, Lucas PJ. Dynamic Bayesian networks as prognostic models for clinical patient management. J Biomed Inform 2008;41:515–29. [45] Kayaalp M, Cooper GF, Clermont G. Predicting ICU mortality: a comparison of
stationary and nonstationary temporal models. In: Proceedings/AMIA Annual Symposium AMIA Symposium; 2000. p. 418–22.
[46]Lausevic Z, Lausevic M, Trbojevic-Stankovic J, Krstic S, Stojimirovic B. Predicting multiple organ failure in patients with severe trauma. Can J Surgery J Can Chirurgie 2008;51:97–102.