Research Article
Stability analysis in fenugreek (
Trigonella foenum-graecum
L.)
Jyoti Kumari, G.U. Kulkarni and L.K. Sharma
Department of Genetics and Plant Breeding, Junagadh Agricultural University, Junagadh
E-mail: [email protected]
(Received: 13 April 2014; Accepted: 10 Nov 2016)
Abstract
Thirty genotypes of fenugreek were grown at Instructional Farm, JAU, Junagadh in three different environments created by manipulating dates of sowing during rabi season of the year 2012-2013. Stability analysis was carried out to identify phenotypically stable genotypes. Pooled analysis of variance for stability in the performance of different genotypes of fenugreek were significant for all the characters viz., days to 50% flowering,plant height, number of pods per plant, number of seeds per pod, days to maturity and seed yield per plant . Mean square due to G×E was highly significant for all the characters and significant mean square due to environment (linear) indicated the existence of real genotypic differences in characters for regression over environmental mean. On the basis of stability component analysis, four genotypes viz., RMt-1, AFg-RMt-1, RMt-143 and AM-326 were found stable for seed yield per plant as having high mean, regression coefficient near to unity and least non-significant deviation.
Key words
Fenugreek, g×e interactions, regression coefficient, stability
Introduction
Fenugreek (Trigonella foenum-graecum L.) belongs to family Fabaceae, is a diploid species with chromosome number of 2n=16. The genus
Trigonella is one of the largest genera of the tribe
Trifoliate in the family Fabaceae and sub-family
Papilionaceae (Balodi and Rao, 1991).Fenugreek which is actually a legume used both as a herb and as a spice. As a matter of fact, after turmeric, fenugreek seeds are the most medically useful item in an Indian kitchen and it is third important seed spice in India after coriander and cumin. In India fenugreek is cultivated in an area of about 81200 ha with production of about 118400 tonnes and productivity of 1458 kg/ha (Anonymous 2011- 12). The low productivity of fenugreek in India is mainly due to low harvest index, low number of flowers and non-availability of suitable high yielding varieties for various agro-climatic regions. In order to evolve a suitable and stable fenugreek variety, it is necessary to test different genotypes in different targeted environments. The relative performance of cultivars for quantitative traits like yield, varies from one environment to another and interaction between genotype x environment has an important impact on the improvement of varieties (Allard and Bradshaw, 1964). Therefore, extensive testing is needed to identify genotypes that show minimum interaction with the environment. The present study was conducted to evaluate and identify the fenugreek varieties with wider adaptation over a range of environments using various stability parameters.
Materials and methods
Experimental material for present investigation comprised of thirty genotypes of fenugreek collected from the National Research Centre on Seed Spices (ICAR), Tabiji, Ajmer (Rajasthan). The genotypes were sown in a randomized block
design (RBD) with, three replications during rabi
season of the year 2012-2013, at Instructional farm, JAU Junagadh. Three different environments were created by sowing the genotypes at the interval of 20 days viz., 17th November, 8th December and 29th December 2012. Observations were recorded on five randomly selected plants per genotype per replication in each environment for plant height, number of pods per plant, number of seeds per pod and seed yield per plant, whereas days to 50% flowering and days to maturity were recorded on plot basis. The analysis of variance was carried out for individual as well as over the environments as per standard procedure given by Panse and Sukhatme (1985).
The regression analysis of thirty genotypes six characters was carried out using the model given by Eberhart and Russell, 1966. Then, stability parameters, phenotypic index (Pi), regression coefficient (bi), deviation from regression (S2di) of thirty genotypes were computed as per the method suggested by Finlay and Wilkinson (1963) and further amplified and generalized by Eberhart and Russell (1966).
Results and discussion
http://ejplantbreeding.com 905 variation into linear and non-linear component
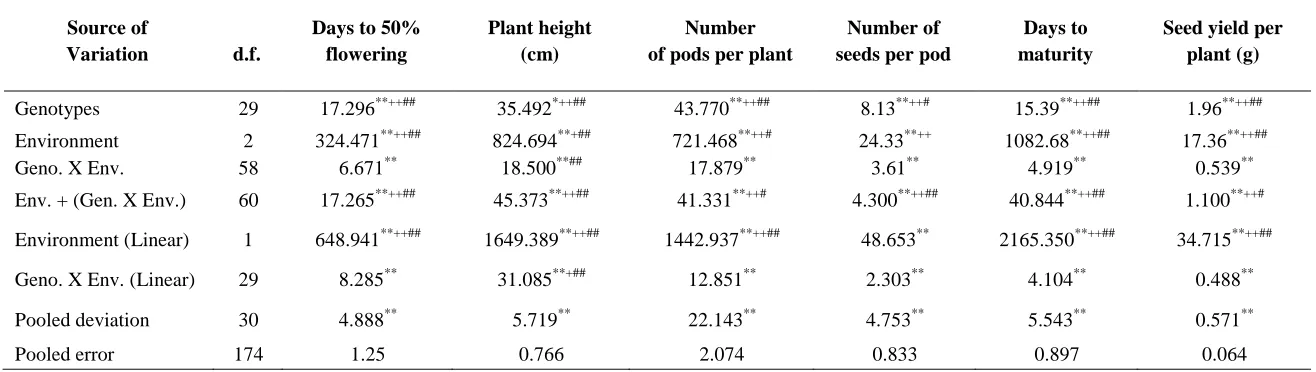
revealed that the mean square due to environment (linear) were significant for all the traits. The significant mean square confirm that the environment were random and different and they exercised influence on expression of traits and this variation could have arisen due to linear response of regression of the cultivar to the environment. The mean square due to the G × E (linear) were significant for all characters revealed that the behavior of genotype could be predicted over the environment more precisely and accurately as the G × E interaction was the outcome of the linear function of the environmental components. The non-linear component arising due to heterogeneity measured as mean square due to the pooled deviation was significant for all the traits except 100 seed weight revealed the presence of non-linear response of the genotypes to the changing environment for these traits. The significant of pooled deviation confirms contribution of non-linear component to the total G × E interaction. The genotype differed with respect to stability of these traits making its prediction more difficult. However, the magnitude of linear component i.e.
environment (linear) and genotype × environment (linear) was many time higher than the non linear component for most of the characters revealed that the prediction of stability could be reliable though it may get affected to some extent. The results obtained in present study are in agreement with the finding of Kole 2005 and Gangopadhyay et al.
(2012).
In the present study, the mean (
g
) phenotypic index (Pi =g
-X
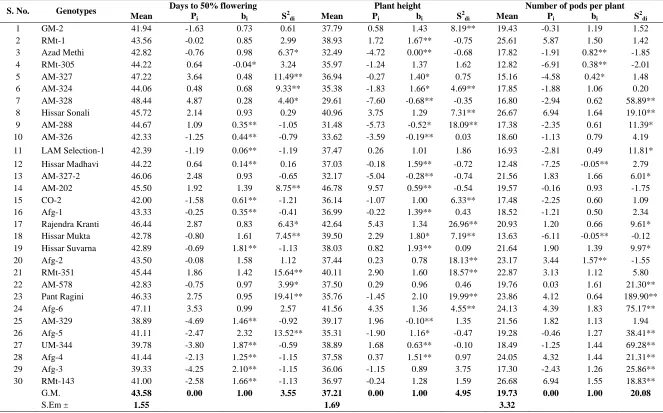
), linear regression (bi) and deviation from regression (S2di) of all the traits studied are presented in table 2.Early flowering (-ve Pi value) genotypes viz., GM-2, RMt-1, Afg-2 found most stable since they show regression coefficient (0.73, 0.85, 1.58) near to unity and least non-significant deviation from regression. Genotypes viz., RMt-305, AFg-3 and RMt-143 exhibited lower mean height than population mean (-ve Pi value) and were found most stable as having regression coefficient near to unity while the genotypes which showed higher mean value (+ve Pi value) for pods per plant over three environments were RMt-1, RMt-351, AM-329 and Afg-2. Out of them, RMt-1, RMt-351 and AM-329 were found most stable, since they showed regression coefficient value (1.49, 1.12, 1.13) respectively) near to unity and least non-significant deviation from regression.
Eleven genotypes had higher mean value than population mean (+ve Pi value) so were suitable for breeding for number of seeds per pod. However from stability point of view AM-288, LAM Selection-1 and AM-202 were found most stable
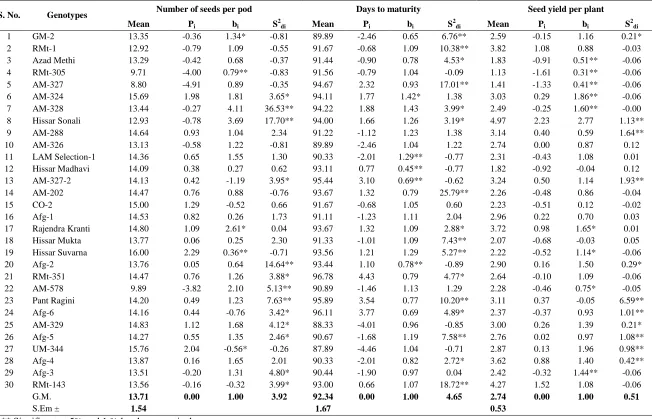
over variable environment as having regression coefficient (1.05, 1.55, and 0.88, respectively) around unity and least non-significant deviation from regression. Late maturing genotype AM-324 (+ve Pi value) was high responsive (bi>1) so suitable for rich environment only, while, Hissar Madhavi, AM-327-2 and Afg-2 were above average stable as having bi value below unity and low deviation from regression. Early maturing (-ve Pi value) genotypes viz., RMt-305, 288, AM-326, CO-2, Afg-1, AM-578, AM-329, UM-344 and Afg-3 exhibited average stability over environment as having regression coefficient near to unity and least non significant deviation from regression. However LAM Selection -1 was high responsive (bi>1) so suitable for favourable environment only.
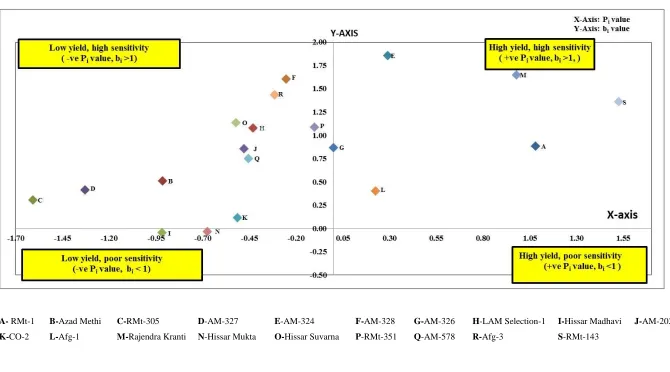
Estimates ofstability parameters revealed that out of thirty genotypes, nineteen genotypes showed predictable behaviour for seed yield per plant as they exhibited non-significant deviation from regression. Among them only six genotypes had higher mean than population mean (+ve Pi value), out of which RMt-143 exhibited highest mean and regression coefficient (1.36) around unity so it was found stable over varying environment. Genotypes RMt-1 and Afg-1were also found most stable over different environment as having regression coefficient value (0.88, 0.70 respectively) near to unity, mean value higher than population mean and least non-significant deviation from regression. However, the genotype, AM-326 had regression coefficient (0.87) near to unity and mean value equal to population mean (Pi=0) hence this genotype was also suitable for cultivation over varying environment. Genotypes
viz., AM-324 and Rajendra Kranti were suitable for rich environment only since they showed regression coefficient significantly higher than unity. Result of the present study based on mean performance, phenotypic index, regression coefficient for seed yield per plant for genotypes and non-significant deviation from regression are graphically represented in fig 1.
stability in the diverse genotypes which constituted the material of this study.
References
Allard, R.W. and Bradshaw, A.D. 1964. Implications of genotype- environmental interactions in applied plant breeding. Crop Sci., 4(6): 503-508.
Anonymous, 2012. Indian Horticulture Database, NHB, Ministry of Agriculture, Government of India. Balodi, B. and Rao, R.R. 1991.The genus Trigonella L. (Fabaceae) in the Northwest Himalaya. J. Econ. Taxon., 5: 11–16.
Breese, E.L. 1969. The measurement and significance of genotype- environment interactions in grasses.
Heredity, 24(1): 27-44.
Gangopadhyay, K.K., Tehlan, S.K., Saxena, R.P., Mishra, A.K., Raiger, H.L., Yadav S.K., Kumar, G., Arivalagan, M. and Dutta, M. 2012. Stability analysis of yield and its component traits in fenugreek germplasm.
Indian J. Horticulture, 69(1): 79-85.
Kole, P.C. 2005. Stability analysis for seed yield and its component characters in fenugreek (Trigonella foenum-graecum L.) J. of Spices and Aromatic Crops, 14(1): 47-50.
Mathur, V.L., Ladu-Lal and Lal, L. 1998. Stability of fenugreek varieties under saline conditions. Legume Res., 21(3&4):151-158.
Panse, V.G. and Sukhatme, P.V. 1985. Statistical Methods for Agricultural Workers (Second edition), ICAR, New Delhi.
http://ejplantbreeding.com 907
Fig. 1. Adaptive specificities of genotypes which show non-significant deviation from regression for seed yield per plant in fenugreek
A- RMt-1 B-Azad Methi C-RMt-305 D-AM-327 E-AM-324 F-AM-328 G-AM-326 H-LAM Selection-1 I-Hissar Madhavi J-AM-202
Table 1. Analysis of variance for phenotypic stability in fenugreek
Source of
Variation d.f.
Days to 50% flowering
Plant height (cm)
Number of pods per plant
Number of seeds per pod
Days to maturity
Seed yield per plant (g)
Genotypes 29 17.296**++## 35.492*++## 43.770**++## 8.13**++# 15.39**++## 1.96**++##
Environment 2 324.471**++## 824.694**+## 721.468**++# 24.33**++ 1082.68**++## 17.36**++##
Geno. X Env. 58 6.671** 18.500**## 17.879** 3.61** 4.919** 0.539**
Env. + (Gen. X Env.) 60 17.265**++## 45.373**++## 41.331**++# 4.300**++## 40.844**++## 1.100**++# Environment (Linear) 1 648.941**++## 1649.389**++## 1442.937**++## 48.653** 2165.350**++## 34.715**++##
Geno. X Env. (Linear) 29 8.285** 31.085**+## 12.851** 2.303** 4.104** 0.488**
Pooled deviation 30 4.888** 5.719** 22.143** 4.753** 5.543** 0.571**
Pooled error 174 1.25 0.766 2.074 0.833 0.897 0.064
+, ++ Significant at 5 and 1 per cent levels, respectively when tested against G x E
http://ejplantbreeding.com 909
Table 2. Mean performance and stability parameters for different characters in fenugreek
[
S. No. Genotypes Days to 50% flowering Plant height Number of pods per plant
Mean Pi bi S2di Mean Pi bi S2di Mean Pi bi S2di
1 GM-2 41.94 -1.63 0.73 0.61 37.79 0.58 1.43 8.19** 19.43 -0.31 1.19 1.52
2 RMt-1 43.56 -0.02 0.85 2.99 38.93 1.72 1.67** -0.75 25.61 5.87 1.50 1.42
3 Azad Methi 42.82 -0.76 0.98 6.37* 32.49 -4.72 0.00** -0.68 17.82 -1.91 0.82** -1.85
4 RMt-305 44.22 0.64 -0.04* 3.24 35.97 -1.24 1.37 1.62 12.82 -6.91 0.38** -2.01
5 AM-327 47.22 3.64 0.48 11.49** 36.94 -0.27 1.40* 0.75 15.16 -4.58 0.42* 1.48
6 AM-324 44.06 0.48 0.68 9.33** 35.38 -1.83 1.66* 4.69** 17.85 -1.88 1.06 0.20
7 AM-328 48.44 4.87 0.28 4.40* 29.61 -7.60 -0.68** -0.35 16.80 -2.94 0.62 58.89**
8 Hissar Sonali 45.72 2.14 0.93 0.29 40.96 3.75 1.29 7.31** 26.67 6.94 1.64 19.10**
9 AM-288 44.67 1.09 0.35** -1.05 31.48 -5.73 -0.52* 18.09** 17.38 -2.35 0.61 11.39*
10 AM-326 42.33 -1.25 0.44** -0.79 33.62 -3.59 -0.19** 0.03 18.60 -1.13 0.79 4.19
11 LAM Selection-1 42.39 -1.19 0.06** -1.19 37.47 0.26 1.01 1.86 16.93 -2.81 0.49 11.81*
12 Hissar Madhavi 44.22 0.64 0.14** 0.16 37.03 -0.18 1.59** -0.72 12.48 -7.25 -0.05** 2.79
13 AM-327-2 46.06 2.48 0.93 -0.65 32.17 -5.04 -0.28** -0.74 21.56 1.83 1.66 6.01*
14 AM-202 45.50 1.92 1.39 8.75** 46.78 9.57 0.59** -0.54 19.57 -0.16 0.93 -1.75
15 CO-2 42.00 -1.58 0.61** -1.21 36.14 -1.07 1.00 6.33** 17.48 -2.25 0.60 1.09
16 Afg-1 43.33 -0.25 0.35** -0.41 36.99 -0.22 1.39** 0.43 18.52 -1.21 0.50 2.34
17 Rajendra Kranti 46.44 2.87 0.83 6.43* 42.64 5.43 1.34 26.96** 20.93 1.20 0.66 9.61*
18 Hissar Mukta 42.78 -0.80 1.61 7.45** 39.50 2.29 1.80* 7.19** 13.63 -6.11 -0.05** -0.12
19 Hissar Suvarna 42.89 -0.69 1.81** -1.13 38.03 0.82 1.93** 0.09 21.64 1.90 1.39 9.97*
20 Afg-2 43.50 -0.08 1.58 1.12 37.44 0.23 0.78 18.13** 23.17 3.44 1.57** -1.55
21 RMt-351 45.44 1.86 1.42 15.64** 40.11 2.90 1.60 18.57** 22.87 3.13 1.12 5.80
22 AM-578 42.83 -0.75 0.97 3.99* 37.50 0.29 0.96 0.46 19.76 0.03 1.61 21.30**
23 Pant Ragini 46.33 2.75 0.95 19.41** 35.76 -1.45 2.10 19.99** 23.86 4.12 0.64 189.90**
24 Afg-6 47.11 3.53 0.99 2.57 41.56 4.35 1.36 4.55** 24.13 4.39 1.83 75.17**
25 AM-329 38.89 -4.69 1.46** -0.92 39.17 1.96 -0.10** 1.35 21.56 1.82 1.13 1.94
26 Afg-5 41.11 -2.47 2.32 13.52** 35.31 -1.90 1.16* -0.47 19.28 -0.46 1.27 38.41**
27 UM-344 39.78 -3.80 1.87** -0.59 38.89 1.68 0.63** -0.10 18.49 -1.25 1.44 69.28**
28 Afg-4 41.44 -2.13 1.25** -1.15 37.58 0.37 1.51** 0.97 24.05 4.32 1.44 21.31**
29 Afg-3 39.33 -4.25 2.10** -1.15 36.06 -1.15 0.89 3.75 17.30 -2.43 1.26 25.86**
30 RMt-143 41.00 -2.58 1.66** -1.13 36.97 -0.24 1.28 1.59 26.68 6.94 1.55 18.83**
G.M. 43.58 0.00 1.00 3.55 37.21 0.00 1.00 4.95 19.73 0.00 1.00 20.08
S.Em ± 1.55 1.69 3.32
Table 2. Contd.,
S. No. Genotypes Number of seeds per pod Days to maturity Seed yield per plant
Mean Pi bi S2di Mean Pi bi S2di Mean Pi bi S2di
1 GM-2 13.35 -0.36 1.34* -0.81 89.89 -2.46 0.65 6.76** 2.59 -0.15 1.16 0.21*
2 RMt-1 12.92 -0.79 1.09 -0.55 91.67 -0.68 1.09 10.38** 3.82 1.08 0.88 -0.03
3 Azad Methi 13.29 -0.42 0.68 -0.37 91.44 -0.90 0.78 4.53* 1.83 -0.91 0.51** -0.06
4 RMt-305 9.71 -4.00 0.79** -0.83 91.56 -0.79 1.04 -0.09 1.13 -1.61 0.31** -0.06
5 AM-327 8.80 -4.91 0.89 -0.35 94.67 2.32 0.93 17.01** 1.41 -1.33 0.41** -0.06
6 AM-324 15.69 1.98 1.81 3.65* 94.11 1.77 1.42* 1.38 3.03 0.29 1.86** -0.06
7 AM-328 13.44 -0.27 4.11 36.53** 94.22 1.88 1.43 3.99* 2.49 -0.25 1.60** -0.00
8 Hissar Sonali 12.93 -0.78 3.69 17.70** 94.00 1.66 1.26 3.19* 4.97 2.23 2.77 1.13**
9 AM-288 14.64 0.93 1.04 2.34 91.22 -1.12 1.23 1.38 3.14 0.40 0.59 1.64**
10 AM-326 13.13 -0.58 1.22 -0.81 89.89 -2.46 1.04 1.22 2.74 0.00 0.87 0.12
11 LAM Selection-1 14.36 0.65 1.55 1.30 90.33 -2.01 1.29** -0.77 2.31 -0.43 1.08 0.01
12 Hissar Madhavi 14.09 0.38 0.27 0.62 93.11 0.77 0.45** -0.77 1.82 -0.92 -0.04 0.12
13 AM-327-2 14.13 0.42 -1.19 3.95* 95.44 3.10 0.69** -0.62 3.24 0.50 1.14 1.93**
14 AM-202 14.47 0.76 0.88 -0.76 93.67 1.32 0.79 25.79** 2.26 -0.48 0.86 -0.04
15 CO-2 15.00 1.29 -0.52 0.66 91.67 -0.68 1.05 0.60 2.23 -0.51 0.12 -0.02
16 Afg-1 14.53 0.82 0.26 1.73 91.11 -1.23 1.11 2.04 2.96 0.22 0.70 0.03
17 Rajendra Kranti 14.80 1.09 2.61* 0.04 93.67 1.32 1.09 2.88* 3.72 0.98 1.65* 0.01
18 Hissar Mukta 13.77 0.06 0.25 2.30 91.33 -1.01 1.09 7.43** 2.07 -0.68 -0.03 0.05
19 Hissar Suvarna 16.00 2.29 0.36** -0.71 93.56 1.21 1.29 5.27** 2.22 -0.52 1.14* -0.06
20 Afg-2 13.76 0.05 0.64 14.64** 93.44 1.10 0.78** -0.89 2.90 0.16 1.50 0.29*
21 RMt-351 14.47 0.76 1.26 3.88* 96.78 4.43 0.79 4.77* 2.64 -0.10 1.09 -0.06
22 AM-578 9.89 -3.82 2.10 5.13** 90.89 -1.46 1.13 1.29 2.28 -0.46 0.75* -0.05
23 Pant Ragini 14.20 0.49 1.23 7.63** 95.89 3.54 0.77 10.20** 3.11 0.37 -0.05 6.59**
24 Afg-6 14.16 0.44 -0.76 3.42* 96.11 3.77 0.69 4.89* 2.37 -0.37 0.93 1.01**
25 AM-329 14.83 1.12 1.68 4.12* 88.33 -4.01 0.96 -0.85 3.00 0.26 1.39 0.21*
26 Afg-5 14.27 0.55 1.35 2.46* 90.67 -1.68 1.19 7.58** 2.76 0.02 0.97 1.08**
27 UM-344 15.76 2.04 -0.56* -0.26 87.89 -4.46 1.04 -0.71 2.87 0.13 1.96 0.98**
28 Afg-4 13.87 0.16 1.65 2.01 90.33 -2.01 0.82 2.72* 3.62 0.88 1.40 0.42**
29 Afg-3 13.51 -0.20 1.31 4.80* 90.44 -1.90 0.97 0.04 2.42 -0.32 1.44** -0.06
30 RMt-143 13.56 -0.16 -0.32 3.99* 93.00 0.66 1.07 18.72** 4.27 1.52 1.08 -0.06
G.M. 13.71 0.00 1.00 3.92 92.34 0.00 1.00 4.65 2.74 0.00 1.00 0.51
S.Em ± 1.54 1.67 0.53