Vol.7 (2017) No. 2
ISSN: 2088-5334
Feature Selection for Multi-Label Document Based on Wrapper
Approach through Class Association Rules
Roiss Alhutaish
#, Nazlia Omar
# #Research Center for Artificial Intelligence Technology, Faculty of Information Science and Technology, Universiti Kebangsaan Malaysia, Bangi, Selangor, 43600, Malaysia
E-mail: [email protected], [email protected]
Abstract— Each document in a multi-label classification is connected to a subset of labels. These documents usually include a big
number of features, which can hamper the performance of learning algorithms. Therefore, feature selection is helpful in isolating the redundant and irrelevant elements that can hold the performance back. The current study proposes a Naive Bayesian (NB) multi-label classification algorithm by incorporating a wrapper approach for the strategy of feature selection aiming at determining the best minimum confidence threshold. This paper also suggests transforming the multi-label documents prior to utilizing the standard algorithm of feature selection. In such a process, the document was copied into labels that belonged to by adopting all the assigned characteristics for each label. Then, this study conducted an evaluation of seven minimum confidence thresholds. Additionally, Class Association Rules (CARs) represents the wrapper approach for this evaluation. The experiments carried out with benchmark datasets revealed that the Naïve Bayes Multi-label (NBML) classifier with business dataset scored an average precision of 87.9% upon using a 0.1 % of minimum confidence threshold.
Keywords— multi-label classification; wrapper approach; Naive Bayesian; class association rules
I. INTRODUCTION
Each document or example in the dataset of a traditional single-label classification is characterized by some set features and connected only to one label from a formerly recognized finite set of labels (L). By contrast, each document of a multi-label classification is connected with just a set of labels. Different methods in the literature have been suggested to sort out the multi-label classification hitches [1]. Such approaches can be categorized into two main types: algorithm adaptation approaches as well as problem transformation approaches [2], [3]. Basically, transformation hitch is defined as the process in which a multi-label hitch is altered into one or more single-label problems [2]. On the other hand, algorithm adaptation approaches are viewed as the procedures which expand specific learning algorithms so as to deal with multi-label data directly [2].
Two approaches can be performed to reduce the features. The first is a feature selection approach that takes a subset of features from the set of original feature. This approach removes redundant and irrelevant elements that can hold the performance back. Such approach contains three types of feature selection approaches [4]. These approaches are filter, wrapper, and hybrid. The second approach is feature extraction. This approach transforms the original features
into a fresh set of features built from the original one by a combination of the existing features. It entails the transformation of high-dimensional space into low-dimensional space [5].
Research related to feature-based multi-label classification using wrapper approach is quite limited. Accordingly, the aim of the paper is to further assess the wrapper approach in multi-label data. In order to carry out this assessment, the data of multi-label training was firstly altered into single-label data. The class association rules were then used for the wrapper approach. The minimum confidence was utilized to select the most suitable subset of features for classification. Subsequently, seven values were used as minimum confidence threshold for selected of features. These values are considered fixed values for each dataset. These values are as follows: 0.1%, 1%, 5%, 10%, 20%, 40% and 80% which represented by θ1 ,
2
θ ,θ3 ,θ4 ,θ5 ,θ6 and θ7 respectively. This stage avoids determining a different value for each dataset.
machines [10]. This study, however, utilized the Naïve Bayesian (NB) classifier, which was similar to the one adopted by Wei et al. [11]. To the best of knowledge of the researchers, most previous works proposed filter methods, which are helpful in saving time when dealing with large textual datasets [12]. Most previous research applied genetic algorithm as wrapper approach [13]. In particular, this research aims to improve the wrapper approach based on Class Association Rules. This method takes advantage of minimum confidence that shows strength correlation of feature with labels.
There are several studies on the reduction of feature space, and likewise, researchers suggested various approaches to minimize the features as well [12]. Accordingly, these approaches could be organised into two types, namely feature extraction and feature selection [14]. Feature selection approaches are techniques that find the best subset from a genuine feature set applying certain standards. Meanwhile, regardless of the large body of work in the field, such approaches are still a well-liked research topic in non-supervised, semi-non-supervised, and supervised machine learning [15]. On the contrary, the number of research on the selection of multi-label feature is quite small, particularly when compared to a large number of research on conventional single-label selection. In the second approach, the main aim of feature extraction approach is to convert the representation of original features. These methods minimize the high dimension of the space of the feature to a lower dimension based on a projecting process through algebraic transformations [16], [17].
Much research on feature selection of multi-label documents was carried out through the filter approach. However, only a handful of studies on feature selection for multi-label documents were conducted through the wrapper approach. Thus, genetic algorithm is considered a famous algorithm in wrapper approach [18]. Basically, the wrapper approach chooses the best subset of the feature through a search in the space of feature and evaluates it based on predictive classification metrics. This approach usually has better performance than the filter approach, because the former directly uses the metrics of the classifier as the evaluation function of a feature subset [19]. Thus, the wrapper approach executes the algorithm of classification for every selection of feature subset. Therefore, such a method is often more computationally costly than the filter approach [20].
Moreover, the wrapper method often utilizes feature selection approaches of single-label documents. In particular, such approaches are greedy search, best-first search, and genetic algorithm. The support vector machine (SVM) approach of Recursive Feature Elimination (RFE), also known as SVM-RFE, was suggested by [21] for gene selection. The study utilised the wrapper approach extensively [22] and, in addition, genetic algorithms were considered famous representatives of wrapper methods [23]. Furthermore, the application of genetic algorithms as wrapper methods has been studied, for example, in [24]-[27]. On the other hand, few studies were carried out on multi-label documents. Yu and Wang [17] particularly suggested two steps for selecting the feature in case of a multi-label hitch. The first step utilizes mutual information (MI) to
choose the most significant features for every label. According to the wrapper approach, the GA algorithm selects the feature subset from the first step results. The authors use the average precision to determine the best subset feature as the final output. Zhang et al. [18] suggested feature selection approaches on the basis of two-stage filter-wrapper for multi-label: a Genetic Algorithm (GA) as well as Principal Component Analysis (PCA). This approach proposes the significance of integrating the feature selection approaches. Such methods are useful in selecting helpful features for multi-label learning on the basis of Naive Bayes classifiers. The authors select the best subset feature as the final output. Thabtah et al. [28] suggested a new method for multi-label classification. This approach utilises characteristics of class association rules in order to generate much more competent classifiers than conventional techniques. The rules are discovered through just one scan of the training data. It employs detailed ranking methods and pruning of redundant rules to ensure at least one effective rule is used. Our paper use Class Association Rules for feature selection. This method makes use of the minimum confidence to show a strong correlation of features with labels.
II. MATERIALS AND METHODS
A. Preliminaries: Multi-Label Classification Assessment
A single-label classifier is regarded as a conventional learning of the algorithm of machine learning in which the dataset of documents is D, and a set of labels is Y, with each document d connected to a single label y from a previously recognized finite set of labels Y. Therefore, the single-label representation is (d, y)., each document in a multi-label classification is connected to a set of labels y⊆Y. Let D t be the training set (denoting the space of input) with n documents andXi =
{
xi1,xi2,..xim}
, wheredi =(
X Yi, i)
, and1, 2,...,
i= n . Each document d is connected to the vector of 1 feature, Xi =
{
xi1,xi2,..xim}
and a subset of labels, Yi ⊆Y , where Y ={
yj: j= …1 q}
[29], [18]. Table 1 shows the represented multi-label problem. The documents are represented by d to 1 d . These documents contain the n features, represented by x to 11 xnm , where x11 represent the first feature in the first document, and the last is represented by xnm. The last representation in Table 1 is labels. These labels represent as follows: Sports (L1), Religion (L2), Science (L3) and Politics (L4).TABLEI MULTI-LABEL DATA
Documents Features Labels
L1 L2 L3 L4
d1 x11 x12 …. x1M 1 0 0 1
d2 x21 x22 …. x2M 0 1 1 0
. . . …. … .. .. .. ..
dN xN1 xN2 …. xNM 0 1 1 1
the labels
Y
ˆ
ifor every invisible document. It is believed thatspecified document x and its connected label set1 y , the 1 system of successful learning will be suggesting an ordering of the potential labels based onf x Y . In other words, a ( , )
label y is considered to be ranked higher than 1 y if 2
1 2
( , ) ( , )
f x y 〉f x y . Note that the corresponding multi-label
classifier h(.) can be conveniently derived from the ranking
functionf(.,.):
h x( )=
{
y| f x y( , )ft x y( ), ∈Y}
(1)here t(x) is the threshold function which it is mean of all possible labels.
Multi-label classification needs to use different measures than those used in traditional single-label classification. Popular evaluation measures used in the single-label system include accuracy, precision, recall, and F-measure. In multi-label learning, the evaluation is much more complicated [29]. Through the above preliminaries, the following multi-label evaluation metrics are used by [1].
1) Hamming Loss: Hamming loss is a metric which
assesses how often a label not relevant to document is predicted, or a label relevant to the document is not predicted. The best performance happens with a smaller value of Hamming loss ( )s D . So, when
0
Hamming loss ( ) s D = the performance is considered perfect. The formula of this metric is:
1 ^
1
Hamming loss ( ) s n Yi Yi i NL
D = ∑ ∆
= (2)
here ∆ stands for the symmetric difference of two sets
(XOR operation).
2) One-Error: One-error metric is a metric which
assesses how often the top-ranked label is not related to label set. The values of this metric are between 0 and 1. The best performance is with the smallest value of one-error. The formula of this metric is:
s
1
{ ^ ( , ) }
1
One-error ( ) n ArgMax f xi y Yi i
N y Yi
D = ∑ ∉
= ∈ (3)
3) Average Precision: Average precision is a metric which assesses the ratio of the labels ranked more than a particular label
l
∈
Y
i .s
^ ^
| ( , ) ( , ) | 1
( , ) ^
1
1 =
Average precision ( ) n Y Yi i f x Yi i f x yi Yi f x yi i
Y Yi i
N
D ∑ ∑ { ∈ : ≥ }
= ∈
(4)
Where N is the number of testing documents. Yi is the
actual label that appears with a document.
^
i
Y is the prediction labels.Xi is a document in the testing dataset.
y is particular label( or threshold).
It can be noticed that if all possible labels of all test documents are ranked above a particular label, the average
precision will be equal to 1. In this case, the perfect performance will be achieved by the learning system due to the base that the best performance occurs with the biggest value of average precision.
B. Proposed Method: Wrapper Approach by Class Association Rules
This work is in three phases. The first phase includes training, reading document and convert multiple data label to one label. The second phase is the method of the feature selection. In this phase, the rules of class association represent a wrapper approach. The third phase is about adapting the classifier of the Naive Bayes.
Fig. 1 Architecture of multi-label text classification based on wrapper approach
• Stage 1: Multi-label Document Transformation: Suppose d is a document that belongs to a set of labels L1, L2, .., Lq. The All Label Assignment (ALA) approach aims to assign d to all the q different labels [30]. The approach copies document d for q times. Each copy of d belongs to a unique label of special labels of the document, which is different from the other copies. This method aims to keep as much label information as possible. Otherwise, the method as Largest Label Assignment (LLA), this method attempts to assign the multi-label document into a label with the largest size.
approach [34]. The advantages of both categories, filters, and wrappers, are available in the third category which is the hybrid [35]. So, different methods to select features are used by the hybrid feature selection strategy as it is clear in [36]-[37], [18].
In the wrapper stage, the many applications use the wrapper approach for feature selection. Genetic Algorithm (GA) is considered the most renowned feature selection method in those applications [18]. However, in applications those have thousands of attributes such as text mining, this leads to slow processing [38]. On the other hand, class association rules discover strong associations between features and labels [39]. Therefore, this work uses class association rules for Feature Subset Selection (FSS) at a wrapper approach.
Suppose Dt is training data, it contains the set of all featuresand the set of class labels (y ,y ,..,y )1 2 q . In general, these associations are expressed using rules of the form X→y1,..,X →yq , where X ⊆
{
x x1, 2,..,xm}
, the condition of the rules is a feature, and the consequent is class labels. Two statistical measures are used, called support (denoted as σ(X →Y) ) and confidence (denoted as (θ X →yq)); these metrics express the strength of the association between X andci. The metrics are described as follows.The actual occurrence of the condition of the rules (X Y)
π → is an occurrence that features in training data. In support stageσ , this step discovers features by scanning the training data once. It computes the number of occurrences for each feature singly. The support of X is defined as shown in equation 5.
(X Y)= (X Y)
D
π
σ
→ → (5)These features pass if support is greater than or equal to the minimum support thresholdσmin.
In confidence stageθ, after the discovery of all possible features, the minimum confidence determines the features for each label. The support count of the condition of the rules π(X →yq) is the number of occurrences of these features in the class labely . The confidence of X is defined q
as shown in equation 6.
( )= ( )
( )
q q
X y
X y
X Y
π
θ
π
→ →
→ (6)
These features are chosen if confidence θ is greater than
or equal to the minimum confidence thresholdθmin.
This paper uses seven different values of minimum confidence thresholds. These values are gradually progressed in ascending manner in order to cover the possible effects of the results.
• Stage 3: Text Classification: Naive Bayesian (NB): Algorithm, as important classifiers, [40] has been used in different applications. For instance, it is used in systems of spam filtering [41], sets of synthetic data [31] and web search [11]. Algorithm adaptation and problem transformation are considered two key
approaches to solving the multi-label text classification problem [2], [1]. The Naive Bayes algorithm also deals directly with multi-label data. For those documents, which are transformed into q single-label datasets, every document relates to a set label. However, in this work, the multi-label data is transformed into a single-label data based on the All Label Assignment (ALA). For transforming multi-label data, there are a number of methods, such as No Label Assignment (NLA), Largest Label Assignment (LLA) and Smallest Label Assignment (SLA) and Entropy-based Label Assignment (ELA) [30]. These methods are as Expectation Maximization (EM) [42], BP-MLL [8], ML-RBF [12]. This work uses Naive Bayes Multi-Label (NBML) for multi-label data classification.
Naive Bayesian is used to classify single-label as follows for a random document dj associated with set
label L=
{
l l1, ,..,2 lq}
and features X ⊆{
x x1, 2,..,xm}
. The Naive Bayes classifier estimates the conditional probability of the document d with relation to each label ( |j P l di j).
( |
)=
( ) (
| )
(
)
i j i
i j
j
P l P d
l
P l
d
P d
(7)This work ignores (P dj) shown in equation 7, as it does
not change the result.P d( j| )li can be obtained from the
following formula:
1
( |
)= ( ) (
| )
( )
(
| )
m
i j i j i i k i
k
P l d
P l P d
l
P l
P x
l
=
=
∏
(8)where P l( )i and P x( k| )li can be estimated according to the following formula:
( )
^
i i
n
p l
N
=
(9)where n is the number of documents in the label li, and
Nis the total number of documents:
(
)
^
1
1
|
kik i m
ki k
T
p x
l
m
T
=
+
=
+
∑
(10)where Tki is the total frequency of featurexkwhich appears in documents that belong toli , and m is the number of features in all documents.
The predicted label of the document d in the traditional j
single-label classification is considered the maximum probability of these labels. However, the Naive Bayes classifier in multi-label classification is adapted to deal with multi-label data directly. This research uses a threshold Pthres to predict the labels of the testing document. As in other literature, Romero and de Campos [43] used 0.5 as a fixed value of the threshold. Therefore, this work calculates the average of the posterior probability of the document djin each label as follows.
1
1
( | ) q
thres i j
i
l d q =
Regarding the above equation, the label li is regarded as a foreseeable label to the document dj. Thus, any new document d, under this strategy, should satisfy
( | )
l d
thresΡ
≥ Ρ
for all possible labels.III. RESULTS AND DISCUSSION
A. Dataset
This section describes the datasets that have been used in this work. It focuses on introducing the concepts of label cardinality, label density and distinct combinations of a dataset. The results were evaluated using three measures i.e. Hamming-loss, One-error, and Average precision.
We performed an experimental evaluation of feature selection using the wrapper approach based on multi-label Naive Bayes classification. Seven different thresholds were used as minimum confidence for class association rules that represents the wrapper approach. Thirteen benchmark multi-label datasets obtained from Mulan’s repository-11 Yahoo datasets [44], RCV1-v2 [45] and tmc2007 [46]-are used in the experiments. The Reuters Corpus Volume 1 (RCV1) dataset consists of 804,414 English-language stories produced by Reuters during 1996–1997. The RCV1-v2 dataset has been proposed by Lewis et al [45], following some corrections to the RCV1 dataset. The authors employ several steps in pre-processing documents. These steps include removing stop words, stemming, and transforming the documents to vectors such as TF-IDF method. The RCV1-v2 dataset is split into a training set of 23,149 documents with 101 labels, and a test set of 781,265 documents with 103 labels. It was then divided into five subsets, each subset containing 3,000 training documents and 3,000 testing documents, and each document falling into 101 categories. TMC2007 was sourced from the Text Mining Workshop that was held in conjunction with the Seventh SIAM International Conference on Data Mining. It contains instances of aviation safety reports that document problems which occurred during certain flights. The labels represent the problems being described by these reports. TMC2007 contains on 49060 features, 28596 documents and 159 labels. The YAHOO data set consists of 14 top-level categories, (e.g. "Arts & Humanities", "Business & Economy", "Computers & Internet"), and each category is classified into a number of second-level subcategories. Ueda and Saito [44] described multi-topic webpage Yahoo datasets by focusing on the second-level categories; the authors identified 11 categorisation subsets. This work employs the class association rules for reduced features these dataset. Table 2 shows the number of documents (N), the number of features (M), and the number of labels (Q) for each dataset.
1) Label Cardinality (LC): It is the average number of labels associated with each example as defined in equation 12:
1
1 ( )
D
i i
LC D Y
D =
=
∑
(12)2) Label Density (LD): It is a normalized version of LC divided by the total number of labels as defined in equation
13:
1
1 ( )
D i
i
Y LD D
D = L
=
∑
(13)3) Distinct Combinations (DC):It counts the number of distinct label sets appearing in the dataset. It is defined in equation 14.
DC D( )=
{
Yi ⊂Y|∃ ∈xi X:(
x Yi, i)
∈D}
(14) Initially, for each dataset, this study suggested the transformation of the multi-label data into single-label data through the All Label Assignment (ALA). The seven threshold minimum confidence was then used to select subset features, based on the class association rules. Furthermore, for each dataset D, equation 15 computes the average feature reduction in the feature space.1 1 `
1 1
Re ( ,
)=1-q m
ij
j i
q m
ij
j i
AveragFeature duction D X
X
χ = =
= =
∑∑
∑∑
(15)
Where χijis the number of features that selected, X is ij
the number of original features.
TABLEII BENCHMARK DATASETS
Dataset N M Q LC LD DC
Art 7,484 23,146 26 1.65 0.06 599 Computers 12,444 34,096 33 1.51 0.05 428 Health 9,205 30,605 32 1.64 0.05 335 Business 11,214 21,924 30 1.60 0.05 233 Education 12,030 27,534 33 1.46 0.04 511 Science 6,428 37,187 40 1.45 0.04 457 Entertainment 12,730 32,001 21 1.41 0.07 337 Recreation 12,828 30,324 22 1.43 0.06 530 Reference 8,028 39,679 33 1.17 0.04 275 Social 12,111 52,350 39 1.28 0.03 361 Society 14,512 31,802 27 1.67 0.06 1054 RCV1-v2 29,996 47,236 101 2.90 0.029 1383 TMC2007 28,596 49060 159 2.158 0.098 1341
This study proposes class association rules for feature space reduction based on the wrapper approach. This method is incorporated into the NBML classifier to evaluate each subset feature so as to identify the best threshold minimum confidence. Three metrics are used in the evaluation. Table 3 shows the average reduction in the feature space for each dataset. In general, reduction ratio increases when a higher threshold degree is used. This is self-evident in the text case. There is a loss of several features when restrictions are put on the choice of the features. This is because of the low frequency of the feature in the label. As can be observed, the RCV1-v2 dataset achieved higher reduction ratio in most cases of the threshold. Moreover, we observed that the average reduction in the feature space of the Society dataset is the best when compared to another dataset.
B. Results
obtained by the subset feature selection generated through Class Association Rules (CARs).
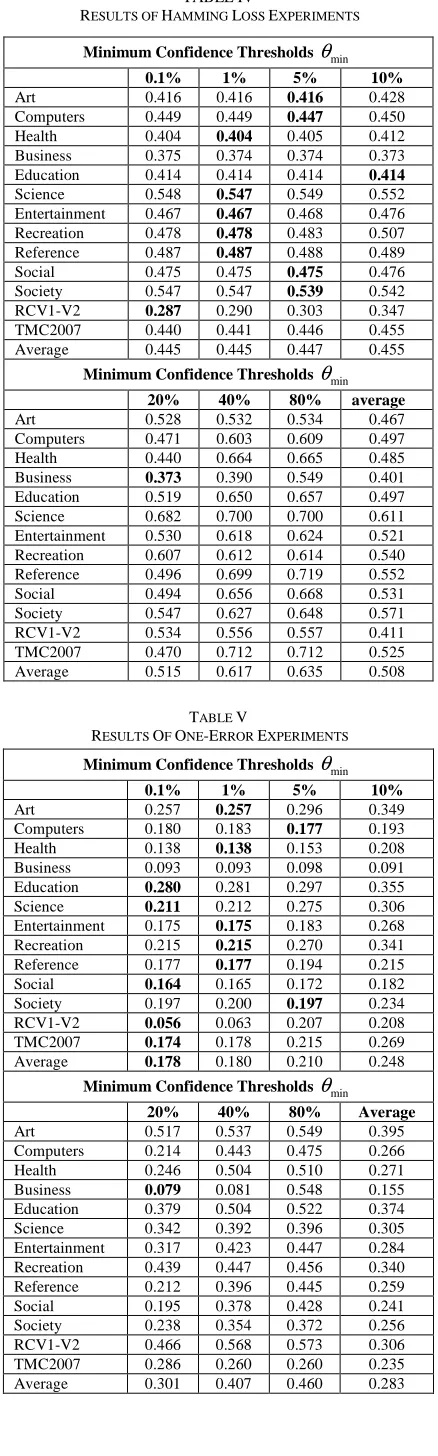
The NBML classifier shows the best performance with 0.1%, 1%, and 5% minimum confidence thresholds. When the average values of all datasets are computed, it obtains 0.445 as the average Hamming loss for all data. Therefore, most datasets showed better performance when 1%, and 5% were used as a threshold.
Table 5 shows One-error of the NBML classifier along with first three thresholds exhibited a better performance than other minimum confidence thresholds. Overall, this evaluation shows an inverse relationship between minimum confidence threshold and the results. In other words, if the value of the threshold is increased, most features are eliminated. These features may be important for classification. Thus, the performance dip is possible. Nevertheless, two cases excluded this vision.
In the first case, the minimum confidence threshold improved the performance when the value increased from 10% to 20%. This enhancement can be witnessed in the case of the Reference dataset. The case improves on One-error almost by 0.3%. The second case increased from 20% to 40%, wherein TMC2007 datasets improved the performance. It recorded an improvement of almost about 2.6%.
TABLEIII AVERAGE FEATURE REDUCTION
Minimum Confidence Thresholds θmin
0.1% 1% 5% 10%
Art 0.000 0.038 0.302 0.560 Computers 0.001 0.075 0.417 0.600 Health 0.001 0.056 0.286 0.466 Business 0.001 0.114 0.467 0.630 Education 0.002 0.082 0.303 0.522 Science 0.000 0.059 0.375 0.581 Entertainment 0.001 0.040 0.289 0.530 Recreation 0.000 0.039 0.319 0.593 Reference 0.001 0.046 0.282 0.480 Social 0.001 0.095 0.386 0.534 Society 0.001 0.066 0.477 0.753 RCV1-V2 0.034 0.328 0.669 0.791 TMC2007 0.001 0.073 0.304 0.439 Average 0.003 0.085 0.375 0.575
Minimum Confidence Thresholds θmin
20% 40% 80% average
Art 0.818 0.956 0.991 0.524 Computers 0.785 0.937 0.984 0.543 Health 0.699 0.906 0.978 0.485 Business 0.773 0.894 0.986 0.552 Education 0.768 0.939 0.986 0.515 Science 0.781 0.936 0.981 0.530 Entertainment 0.776 0.938 0.986 0.509 Recreation 0.826 0.949 0.987 0.530 Reference 0.676 0.872 0.963 0.474 Social 0.704 0.883 0.965 0.510 Society 0.879 0.965 0.997 0.591 RCV1-V2 0.894 0.971 0.996 0.669 TMC2007 0.572 0.843 0.963 0.456 Average 0.765 0.922 0.982 0.530
Table 6 shows the Average precision of the NBML classifier. It achieves better performance with a threshold 0.1% and 1% than other minimum confidence thresholds. However, two cases showed better performance after deteriorating the previous threshold.
TABLEIV
RESULTS OF HAMMING LOSS EXPERIMENTS
Minimum Confidence Thresholds θmin
0.1% 1% 5% 10%
Art 0.416 0.416 0.416 0.428 Computers 0.449 0.449 0.447 0.450 Health 0.404 0.404 0.405 0.412 Business 0.375 0.374 0.374 0.373 Education 0.414 0.414 0.414 0.414
Science 0.548 0.547 0.549 0.552 Entertainment 0.467 0.467 0.468 0.476 Recreation 0.478 0.478 0.483 0.507 Reference 0.487 0.487 0.488 0.489 Social 0.475 0.475 0.475 0.476 Society 0.547 0.547 0.539 0.542 RCV1-V2 0.287 0.290 0.303 0.347 TMC2007 0.440 0.441 0.446 0.455 Average 0.445 0.445 0.447 0.455
Minimum Confidence Thresholds θmin
20% 40% 80% average
Art 0.528 0.532 0.534 0.467 Computers 0.471 0.603 0.609 0.497 Health 0.440 0.664 0.665 0.485 Business 0.373 0.390 0.549 0.401 Education 0.519 0.650 0.657 0.497 Science 0.682 0.700 0.700 0.611 Entertainment 0.530 0.618 0.624 0.521 Recreation 0.607 0.612 0.614 0.540 Reference 0.496 0.699 0.719 0.552 Social 0.494 0.656 0.668 0.531 Society 0.547 0.627 0.648 0.571 RCV1-V2 0.534 0.556 0.557 0.411 TMC2007 0.470 0.712 0.712 0.525 Average 0.515 0.617 0.635 0.508
TABLE V
RESULTS OF ONE-ERROR EXPERIMENTS
Minimum Confidence Thresholds θmin
0.1% 1% 5% 10%
Art 0.257 0.257 0.296 0.349 Computers 0.180 0.183 0.177 0.193 Health 0.138 0.138 0.153 0.208 Business 0.093 0.093 0.098 0.091 Education 0.280 0.281 0.297 0.355 Science 0.211 0.212 0.275 0.306 Entertainment 0.175 0.175 0.183 0.268 Recreation 0.215 0.215 0.270 0.341 Reference 0.177 0.177 0.194 0.215 Social 0.164 0.165 0.172 0.182 Society 0.197 0.200 0.197 0.234 RCV1-V2 0.056 0.063 0.207 0.208 TMC2007 0.174 0.178 0.215 0.269 Average 0.178 0.180 0.210 0.248
Minimum Confidence Thresholds θmin
20% 40% 80% Average
In the first case, the minimum confidence threshold improved the performance when the value increased from 20% to 40%. This enhancement can be noticed in the case of the Business dataset. It recorded an improvement of almost about 0.3%. The second case improved from 10% to 20%, wherein there was an improvement in the performance with Reference datasets. It improved in the performance almost about 0.4%.
TABLEVI
RESULTS OF AVERAGE PRECISION EXPERIMENTS
Minimum Confidence Thresholds θmin
0.1% 1% 5% 10%
Art 0.755 0.754 0.697 0.615
Computers 0.817 0.814 0.794 0.760 Health 0.819 0.819 0.790 0.714 Business 0.879 0.876 0.858 0.851 Education 0.781 0.781 0.736 0.621 Science 0.818 0.815 0.728 0.685 Entertainment 0.848 0.847 0.825 0.716 Recreation 0.802 0.802 0.734 0.649 Reference 0.827 0.827 0.799 0.762 Social 0.844 0.843 0.829 0.805 Society 0.815 0.812 0.775 0.710 RCV1-V2 0.685 0.649 0.494 0.511 TMC2007 0.741 0.730 0.674 0.613 Average 0.802 0.798 0.749 0.693
Minimum Confidence Thresholds θmin
20% 40% 80% average
Art 0.497 0.475 0.463 0.608 Computers 0.729 0.559 0.527 0.714 Health 0.690 0.505 0.499 0.691 Business 0.816 0.819 0.453 0.793 Education 0.619 0.505 0.491 0.648 Science 0.664 0.613 0.608 0.704 Entertainment 0.671 0.577 0.554 0.720 Recreation 0.566 0.556 0.547 0.665 Reference 0.766 0.613 0.558 0.736 Social 0.787 0.632 0.576 0.759 Society 0.710 0.642 0.629 0.728 RCV1-V2 0.491 0.441 0.438 0.530 TMC2007 0.587 0.749 0.749 0.692 Average 0.661 0.591 0.546 0.691
In general, the frequent of item sets in market basket analysis association rules are huge. Therefore, the high values of minimum confidence threshold are useful. In the text documents - the frequency of words is small. Thus, the high values of minimum confidence threshold are not useful. For both datasets, the above results show the best performance on using the first of the three threshold minimum confidence. The complexities of multi-label data require caution to be exercised when selecting sub-features among several features. Therefore, this type of analysis is very useful in identifying the best threshold minimum confidence of class association rules.
IV. CONCLUSIONS
This work provides a novel wrapper approach for multi-label feature selection based on the Class Association Rules (CARs). To achieve this aim, the study proposed the transformation of the multi-label data to single-label data through the All Label Assignment (ALA). Then, the Naive Bayes classifier was expanded so as to handle multi-label data. Seven thresholds were assessed on a text dataset,
providing the features chosen by the thresholds of CARs to NBML classification algorithm and measuring the corresponding predictive hamming loss, one-error, and average precision in respect of the average reduction.
The experimented wrapper method used CARs with NBML to determine the best minimum confidence threshold. We observed that the first three thresholds give the best performance. It has been observed that if the threshold value is increased, the performance decreases. Thus, it is not clear whether ambiguity in the relationship between features and labels can hinder the performance. Going forward, we plan to investigate this ambiguity.
REFERENCES
[1] M. S. Sorower. A literature survey on algorithms for multi-label learning. Oregon State University, Corvallis, 2010.
[2] G. Tsoumakas and I. Katakis. “Multi label classification: an overview”. International Journal of Data Warehousing and Mining, vol. 3, pp. 1-13, 2007.
[3] G. Tsoumakas, I. Katakis, and I. Vlahavas. Mining multi-label data.
In Data mining and knowledge discovery handbook, pp. 667-685. Springer US, 2010.
[4] R. Kohavi and G. H. John. “Wrappers for feature subset selection”.
Artificial intelligence, vol. 97, pp. 273-324, 1997.
[5] N. Syifaun, O. Wahyunggoro, and L.E. Nugroho. "Mel-frequencies Stochastic Model for Gender Classification based on Pitch and Formant." International Journal on Advanced Science, Engineering and Information Technology. vol. 6(2) ,pp. 124-129. 2016.
[6] R. E. Schapire and Y. Singer. “BoosTexter: A Boosting-based System for Text Categorization”. Machine Learning, vol. 39, pp. 135-168, 2000.
[7] F. De Comité, R. Gilleron, and M. Tommasi. Learning multi-label alternating decision trees from texts and data. in Machine Learning and Data Mining in Pattern Recognition, ed: Springer, 2003, pp. 35-49.
[8] M. L. Zhang and Z. H. Zhou. “Multilabel neural networks with applications to functional genomics and text categorization”. IEEE Transactions on Knowledge and Data Engineering, vol. 18, no. 10, pp. 1338–1351, 2006.
[9] M.-L. Zhang and Z.-H. Zhou. “ML-KNN: A lazy learning approach to multi-label learning”. Pattern Recognition, vol. 40, pp. 2038-2048, 2007.
[10] A. Elisseeff and J. Weston. A kernel method for multi-labelled classification. In Advances in neural information processing systems, 2001, pp. 681-687.
[11] Z. Wei, H. Zhang, Z. Zhang, W. Li, and D. Miao. ”A Naïve Bayesian Multi-label Classification Algorithm with Application to Visualize Text Search Results”. International Journal of Advanced Intelligence, vol. 3, pp. 173-188, 2011.
[12] M. L. Zhang. “ML-RBF: RBF neural networks for multi-label learning”. Neural Processing Letters. vol. 29, no. 2, pp. 61–74, 2009.
[13] J. Leng, C. Valli, and L. Armstrong. “A wrapper-based feature selection for analysis of large data sets”. 3rd International Conference on Computer and Electrical Engineering (ICCEE 2010) .pp. 165-170, 2010.
[14] A. Janecek, W. N. Gansterer, M. Demel, and G. Ecker. “On the Relationship Between Feature Selection and Classification Accuracy”. Paper read at FSDM, pp. 90-105, 2008.
[15] Z. Zhao, F. Morstatter, S. Sharma, S. Alelyani, A. Anand, and H. Liu. “Advancing feature selection research”. ASU feature selection repository, pp. 1-28, 2010.
[16] M. Zareapoor. “Feature Extraction or Feature Selection for Text Classification: A Case Study on Phishing Email Detection”.
International Journal of Information Engineering and Electronic Business IJIEEB, vol. 7, no 2, pp. 60-65. 2015.
[17] D. Dhanya, P. Pranav, and G, Jeyakumar. "A Survey on Adaptation Strategies for Mutation and Crossover Rates of Differential Evolution Algorithm." International Journal on Advanced Science, Engineering and Information Technology , vol. 6 (5), pp. 613-623, 2016. [18] Yu, Y. & Wang, Y. Feature Selection for Multi-label Learning Using
Peters, G., Hu, Q. & Wang, R. (eds.). Rough Sets and Knowledge Technology: 454-463 Springer International Publishing. 2014 [19] S. Jungjit, A. A. Freitas, M. Michaelis, and J. Cinatl. “Two
Extensions to Multi-label Correlation-Based Feature Selection: A Case Study in Bioinformatics”. In 2013 IEEE International Conference on Systems, Man, and Cybernetics, pp. 1519-1524. IEEE. [20] M. L. Zhang, J. M. Peña, and V. Robles. “Feature selection for
multi-label naive Bayes classification”. Information Sciences, vol. 179, pp. 3218-3229, 2009.
[21] I. Guyon, J. Weston, S. Barnhill, and V. Vapnik.” Gene selection for cancer classification using support vector machines”. Machine learning, vol. 46, pp. 389-422, 2002.
[22] S. Alelyani. “On Feature Selection Stability: A Data Perspective”. PhD dissertation, Arizona State University, 2013.
[23] Janecek, Andreas. “Efficient feature reduction and classification methods”. PhD dissertation, University of Vienna, 2009.
[24] A. G. Karegowda, M. Jayaram, and A. Manjunath. Feature subset selection problem using wrapper approach in supervised learning. International journal of Computer applications, vol. 1, pp. 13-17, 2010.
[25] H W. H. Hsu, C. P. Schmidt, and J. A. Louis. “Genetic Algorithm Wrappers for Feature Subset Selection In Supervised Inductive Learning.” In Proceedings of the Genetic and Evolutionary Computation Conference GECCO, 2002, p. 680.
[26] J. Jarmulak and S. Craw. “Genetic algorithms for feature selection and weighting”. In Proceedings of the IJCAI Workshop on Automating the Construction of Case-Based Reasoners, 1999, pp. 28-33.
[27] L. Zhuo, J. Zheng, X. Li, F. Wang, B. Ai, and J. Qian. “A genetic algorithm based wrapper feature selection method for classification of hyperspectral images using support vector machine”. In Geoinformatics 2008 and Joint Conference on GIS and Built Environment: Classification of Remote Sensing Images, 2008, pp. 71471J-71471J-9.
[28] F. Thabtah, P. Cowling, and Y. Peng. “Multiple labels associative classification”. Knowledge and Information Systems, vol. 9, pp. 109-129, 2006.
[29] Sebastiani, F. 2002. “Machine learning in automated text categorization”. ACM Comput. Surv,.vol. 34, no 1, pp. 1-47. [30] W. Chen, J. Yan, B. Zhang, Z. Chen, and Q. Yang. “Document
transformation for multi-label feature selection in text categorization. In Data Mining”. Seventh IEEE International Conference on ICDM, 2007, pp. 451-456.
[31] H. Shao, G. Li, G. Liu, and Y. Wang. “Symptom selection for multi-label data of inquiry diagnosis in traditional Chinese medicine”.
Science China Information Sciences, vol. 56, pp. 1-13, 2013. [32] N. Spolaôr and G. Tsoumakas. “Evaluating Feature Selection
Methods for Multi-Label Text Classification.” In Proceedings of the first workshop on bio-medical semantic indexing and question answering, 2013.
[33] A. K. Uysal S. Gunal. “A novel probabilistic feature selection method for text classification”. Knowledge-Based Systems, vol. 36, pp.226-235, 2012.
[34] H. Yuan, S.S. Tseng, W. Gangshan and Z. Fuyan. “A two-phase feature selection method using both filter and wrapper”. In Systems, Man, and Cybernetics, 1999. IEEE SMC'99 Conference Proceedings. 1999 IEEE International Conference on, vol. 2, pp. 132-136. IEEE, 1999.
[35] S. Gunal. “Hybrid feature selection for text classification”. Turkish Journal of Electrical Engineering & Computer Sciences, vol. 20, pp. 1296-1311, 2012.
[36] D. Miao, Q. Duan, H. Zhang, and N. “Rough set based hybrid algorithm for text classification”. Expert Systems with Applications.
Vol. 36, no. 5, 9168-9174. 2009.
[37] S. S. Kannan and N Ramaraj. “A novel hybrid feature selection via Symmetrical Uncertainty ranking based local memetic search algorithm”. Knowledge-Based Systems. Vol. 23, no. 6, 580-585. 2010. [38] A. Freitas. A Review of Evolutionary Algorithms for Data Mining. In
Data Mining and Knowledge Discovery Handbook. Springer US, 2010, pp. 371-400.
[39] A. Veloso, W. Meira Jr, M. Gonçalves, H. M. Almeida, and M. Zaki. “Calibrated lazy associative classification”. Information Sciences, vol. 181, pp. 2656-2670, 2011.
[40] H. Zhang and J. Su. “Naive Bayesian classifiers for ranking”. In Machine Learning: ECML 2004, pp. 501-512. Springer Berlin Heidelberg, 2004.
[41] I, Androutsopoulos, J. Koutsias, K . V. Chandrinos, G. Paliouras, and C. D. Spyropoulos. “An evaluation of naive bayesian anti-spam filtering”. arXiv preprint cs/0006013 (2000).
[42] A. McCallum. “Multi-label text classification with a mixture model trained by EM”. Working Notes of the AAAI’99 Workshop on Text Learning, 1999.
[43] A. E. Romero and L. M. de Campos. “A probabilistic methodology for multilabel classification”. Intelligent Data Analysis, vol.. 19, no. 5, pp. 953-981, 2014 IOS Press.
[44] N. Ueda and K. Saito. “Parametric mixture models for multi-labeled text”. In Advances in neural information processing systems, 2002, pp. 721-728.
[45] D. D. Lewis, Y. Yang, T. G. Rose, and F. Li. “RCV1: A New Benchmark Collection for Text Categorization Research”. Journal of machine learning research. vol. 5, pp. 361-397, 2004.