rapid flood inundation mapping
Xiao Huang*, Cuizhen Wang, Zhenlong Li
University of South Carolina, Columbia, SC, U.S, [email protected], [email protected], [email protected]
* Corresponding author
Abstract: Recent years have seen the growth of popularity in social media, especially in social media based disaster studies. During a flood event, volunteers may contribute useful information regarding the extent and the severity of a flood in a real-time manner, largely facilitating the process of rapid inundation mapping. However, considering that on-topic (flood related) social media only comprises a small amount in the entire social media space, a robust extraction method is in great need. Taking Twitter as targeted social media platform, this study presents a visual-textual approach to automatic tagging flood related tweets in order to achieve real-time flood mapping. Two convolutional neural networks are adopted to process pictures and text separately. Their outputs are further combined and fed to a visual-textual fused classifier. The result suggests that additional visual information from pictures leads to better classification accuracy and the extracted tweets, representing timely documentation of flood event, can greatly benefit a variety of flood mitigation approaches.
Keywords: convolutional neural network, flood mapping, social media
1. Introduction
The rising of social media provides us an important way to share information during a disaster event. The timely documentation of the extent as well as severity of a disaster event enable rapid situational awareness, greatly benefiting first responders and local authorities, leading to better decisions on evacuation and rapid damage assessment. Flood, one of the most common natural hazards on earth, can greatly benefit from the characteristic of “real-time” in social media as traditional remote sensing method is hampered by extreme weather conditions and limited temporal resolution. Studies have been conducted to harvest the potential of social media for rapid flood mapping (Li et al., 2018; Huang et al., 2018a) and flood damage assessment (Schnebele et al., 2014). However, given the fact that flood relevant (on topic) social media only comprises a small amount in the entire social media space, how to automatically and efficiently select those on-topic social media becomes a huge challenge. In addition, the textual information and visual information contained in each social media post are both with great importance in providing useful flood situational awareness. Texts, for instance, can provide sentimental responses and flood severity while picture can provide in-situ visual evidence of an inundated area. How to effectively select flood relevant social media posts considering the information from both of their texts and pictures, however, still remains a challenge.
1.1 Textual classification
The common textual-based selection approach is to apply certain keyword restrictions, thanks to its simplicity. Vieweg et al. (2010), for instance, applied “fire” to sort out tweets about grassfire in Oklahoma. Li et al. (2018) applied a list of keywords including “flood”, “Hurricane
Joaquin”, etc. to select flood relevant tweets during 2015 SC flood in U.S. However, the uncertainty in keyword restriction is inevitable as a large amount of flood relevant tweets will be excluded if they don’t contain certain predefined keywords. With the development of machine learning algorithms, the textual-based classification of on-topic social media has been significantly improved. Those commonly used methods include: Decision Tree (DT), Random Forests (RF) and Support Vector Machine (SVM). Those machine learning methods above are not restricted to the existence of predefined keywords and therefore achieve better classification accuracy. The rapid advancement of deep learning techniques has been proved rather promising in many text classification tasks. Convolutional Neural Network (CNN), a famous deep learning technique inspired by biological processes, achieved even better performance than the aforementioned baseline models in machine learning. Through the application of word vectors, Kim (2014) designed a CNN architecture for sentence classification and achieved remarkable performance. Following his work, other CNN models have been adopted and widely applied in text classification tasks.
1.2 Visual classification
Krizhevsky et al. (2012) to ResNet by He et al. (2016), the accuracy of picture labelling continues to be improved and even goes beyond human-level. This huge improvement in classification accuracy coupled with the popularity of high-performance computing enables a real-time flood image extraction from massive social media pool. Studies have been conducted to extract flood pictures via CNN models and achieved promising results. Huang et al. (2018b) applied a self-designed simple CNN to recognize flood relevant pictures for inundation mapping purpose. Feng and Sester (2018) used GoogLeNet Inception V3 (Szegedy et al., 2016), a popular CNN proposed by Google, and achieved outstanding classification accuracy. 1.3 Trials of visual-textual fused classification
The outstanding performance of CNN in classifying both text and pictures urges the trials of linking pictures with texts towards a visual-textual fused classification. In a flood related social media post, the information from texts and pictures (if it has any) both contribute to its identification. Under the assumption that classification from texts and pictures allows self-correction of intrinsic errors from a single source (Laura et al., 2017), the visual-textual approach is believed to be more robust. Trials have been conducted to utilize both text and picture in a social media post. In our previous study (Huang et al., 2018b), we integrated flood sensitive words with self-design CNN model and found out that the existence of flood sensitive words contributes to the removal of wrongly classified pictures. Avgerinakis et al. (2017) proposed a visual and textual analysis by combining the results from two modalities using graph-based techniques. The visual-textual fused approach designed in this study integrates a CNN picture classification model (Inception V3) with a CNN text classification model (word embedded).
This study contributes to the literature in 1) designing a novel machine learning approach to automatically extracting flood related social media via the combination of two state-of-the-art CNN models; 2) exploring the potential of integrating both visual and textual information from social media in identifying on-topic posts; 3) coupling the extracted flood-related social media with existing flood inundation model for acquiring a rapid flood awareness.
2. Study Case
2.1 Study area
We chose two flood cases in this study. SC (South Carolina) Flood in 2015 and Houston Flood in 2017 were selected to train and test our algorithm respectively (Figure 1). In 2015, a severe flood occurred in SC due to the intense precipitation from Hurricane Joaquin. The intensive rainfall from Oct 1st to Oct 5th in 2015 caused
severe damage to personal properties and public infrastructures. In 2017, City of Houston experienced record-breaking flood due to Hurricane Harvey. The flood caused an estimated damage of $125 billion and was responsible for at least 64 deaths. Both selected flood cases have triggered intensive social responses that are ready to be harvested for rapid flood estimation. The spatial
distribution of those social responses from Twitter for 2015 SC flood and 2017 Houston flood is presented in Figure 1.
Figure 1. Study area and geotagged tweets during the flood event; (a) 2017 Houston Flood with 501,516 geotagged tweets from Aug 25th to Sep 1st; (b) 2015 SC flood in City of Columbia with 22,291 geotagged tweets from Oct 2nd to Oct 9th.
2.2 Datasets
The datasets used in this study contain 1) visual training set; 2) textual training set and 3) fused feature training set. Visual training set includes 5000 flood pictures and a balanced number of non-flood pictures derived from various social media platforms and searching engines. The pictures contained in this dataset were used to train the Inception V3 model to recognize flood pictures. Textual training set contains 13,830,023 sample tweets in 2017 from Jan 1st to December 31st. They were used to train the
samples used in this dataset was derived from 2017 Houston flood. It contains 2092 on-topic labels and 2092 off-topic labels.
3. Methodology
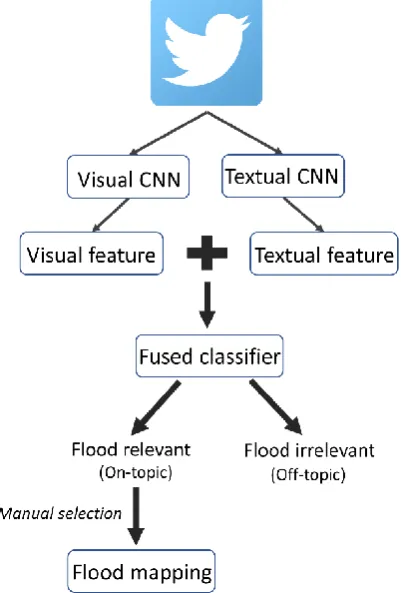
The framework of proposed method is presented in Figure 2. The social responses in Twitter during the 2017 Houston Flood were passed through two well trained CNN: visual CNN and textual CNN. Their generated visual and textual features were fused together and were passed to a visual-textual fused classifier. Then, the generated flood relevant tweets went through a manual selection process and they were further used to derive the flood inundation probability map.
Figure 2. Conceptual workflow.
3.1 Textual CNN
Before the textual information from a certain tweet is passed to the textual CNN network, it has to be converted to word vectors. To acquire those vectors, the technique used in this study is Word2Vec, a shallow neural network with single hidden layer, but proved to be powerful in providing 300-dimention vectors representing the word characteristics (Mikolov et al. 2013). The derived vectors were further passed to the CNN architecture adopted from Kim (2014), where it describes each input sentence with multiple 300-dmension vectors, forming an image-like matrix that can be processed by convolutional algorithms. The output of adopted textual CNN is 𝑍𝑡𝑒𝑥𝑡𝑢𝑎𝑙, a
1024-dimension textual feature vector that represents the characteristics of input sentence.
3.2 Visual CNN
The visual CNN for processing tweeted pictures is GoogLeNet Inception V3 (Szegedy et al., 2016). In order to train this network to our specific flood task, the architecture has been transfer-learned using flood pictures and non-flood pictures. Transfer learning is the technique that transfers the network weights on a previous task to a new task, under the assumption that features extracted from the previous dataset are generic enough to be useful in the context of new dataset (Yosinski et al., 2014). We assume that the weights in the GoogLeNet learned from training samples of ILSVRC (ImageNet Large-Scale Visual Recognition Challenge) (Russakovsky et al., 2015) can be applied to recognize flood texture in posted pictures. The output of visual CNN is 𝑍𝑣𝑖𝑠𝑢𝑎𝑙, a
1024-dimension visual feature vector that represents the characteristics of input pictures.
3.3 Integration of visual feature and textual feature The integration of visual feature and textual feature is the fusion of two vectors, i.e. 𝑍𝑡𝑒𝑥𝑡𝑢𝑎𝑙 and 𝑍𝑣𝑖𝑠𝑢𝑎𝑙. The two
vectors, describing the textual and visual information respectively, were concatenated to form a 2048-dimension vector (𝑍𝑓𝑢𝑠𝑒𝑑):
𝑍𝑓𝑢𝑠𝑒𝑑= 𝑍𝑡𝑒𝑥𝑡𝑢𝑎𝑙+ 𝑍𝑣𝑖𝑠𝑢𝑎𝑙 (1) where 𝑍𝑡𝑒𝑥𝑡𝑢𝑎𝑙 and 𝑍𝑣𝑖𝑠𝑢𝑎𝑙 represent vector for textual and visual respectively. 𝑍𝑓𝑢𝑠𝑒𝑑 represents a concatenated vector, describing both pictures and texts from a certain Twitter post.
The 𝑍𝑓𝑢𝑠𝑒𝑑 was further trained using several selected
machine learning algorithms to generate binary labels. Those machine learning algorithms include: Logistic Regression (LogR), Decision Tree (DT), Support Vector Machine (SVM) and Random Forest (RF). Those algorithms are tested to derive a final binary label from 𝑍𝑓𝑢𝑠𝑒𝑑 . It should be noted that feature vector is automatically padded with 0 if the input lacks visual or textual information source, meaning that the proposed fusion method doesn’t not require the coexistence of both visual and textual input.
3.4 Mapping inundation probability using a geostatistical method
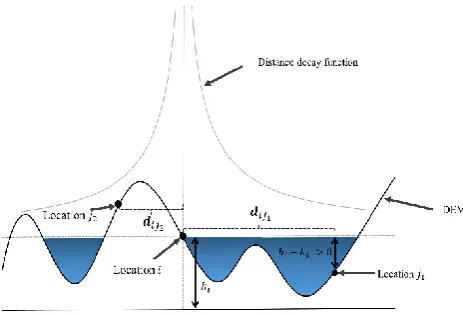
Figure 3. Geostatistical flood mapping model using selected flood relevant tweets.
We assume that location 𝑖 represents a flooded location (identified by a flood relevant tweet), we believe that location 𝑗1 is more likely to be inundated compared location 𝑗2 as location 𝑗1 has an elevation lower than
location 𝑖. The flooding probability for location 𝑗1 is assumed to be negatively correlated with the distance between location 𝑖 and location 𝑗1. Given a location 𝑖, the algorithm adopted in this study first calculates the elevation difference (ED) at location j:
𝐸𝐷𝑖𝑗= {
0, 𝐻𝑖− 𝐻𝑗< 0
𝐻𝑖− 𝐻𝑗, 𝐻𝑖− 𝐻𝑗≥ 0 (2)
where 𝐻𝑖 and 𝐻𝑗 represent the elevation at location 𝑖 and
location j respectively. 𝐸𝐷𝑖𝑗 represents the elevation difference when 𝐻𝑖≥ 𝐻𝑗 or 0 when 𝐻𝑖< 𝐻𝑗. Then the
derived 𝐸𝐷𝑖𝑗 was applied a popular distance decay function (Li et al., 2018):
𝑃𝑖𝑗= (𝐸𝐷𝑖𝑗)𝛼 × 1
(𝑑𝑖𝑗)𝛽 (3)
where 𝑑𝑖𝑗 represents the distance between location 𝑖 and location j, α and β are power parameters to adjust the influence of 𝐷𝐻𝑖𝑗 and 𝑑𝑖𝑗, respectively. 𝑃𝑖𝑗 represents the flood inundation probability at location j given the inundation at location 𝑖.
4. Results
4.1 Fused classification
Several algorithms were tested to generate binary labels from a visual-textual combined feature vector (𝑍𝑓𝑢𝑠𝑒𝑑),
their performances are summarized in Table 1. Table 1
Fused classification accuracy Method Average accuracy
in 5 folds SD
LogR 96.5% 0.73%
DT 91.1% 0.87%
RF 93.5% 0.64%
SVM:
Linear 96.3% 0.42%
Polynomial 69.7% 4.87%
RBF 94.4% 0.54%
Sigmoid 94.1% 0.43%
As Table 1 suggests, LogR achieved the best perform with an average accuracy of 96.5% in 5 folds, followed by SVM (linear) 96.3% and SVM (RBF) 94.4%. Significant overfitting was observed in SVM (Polynomial) as it has a low average accuracy (69.7%) and the highest SD (4.87%).
Table 2
Fused classification compared with textual only
Method
Accuracy
Textual only Visual-textual fused
LogR 82.6% 95.2%
SVM (Linear) 82.9% 92.7%
SVM (RBF) 79.5% 90.2%
To examine whether fused classification using (𝑍𝑓𝑢𝑠𝑒𝑑) is
better than using textual vector (𝑍𝑡𝑒𝑥𝑡𝑢𝑎𝑙) alone, we tested three algorithms: LogR, SVM (linear) and SVM (RBF). The result suggests that all the selected algorithms benefit from the additional input of pictures (Table 2). For instance, LogR achieved 95.2% of accuracy using fused vector, a 12.6% improvement compared with the accuracy using textual vector alone. The results above provide direct evidence that the on-topic tweet classification using integration of visual and textual information outperforms the situation when only textual information is used. 4.2 Inundation probability map in 2017 Houston Flood
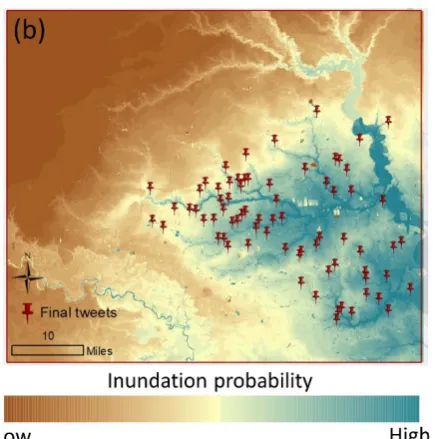
Figure 4. (a) Spatial distribution of final tweets selection; (b) Inundation probability map using selected flood relevant tweets.
5. Future directions
This study explores the integration of two popular CNN architectures in flood related tweets classification. The integration is based on vector fusion mechanism where visual vector and textual vector are concatenated to form a visual-textual vector, participating in the final classification task. Other fusing methods deserve further exploration as the vector concatenation method used in this study implies equal weights on both visual and textual information. In some cases, however, this assumption might not be true.
In addition, this study only tested the fusion of GoogLeNet and word embedded CNN in classifying flood related tweets. Other popular CNN models including ResNet (He et al., 2016) and Recurrent Neural Network (RNN) (Mikolov et al., 2010) should also be tested to shed lights on the robustness of proposed visual-textual fused classification method. Moreover, the application of proposed method should be examined against different social media sources in a variety of disasters in the future. 6. Conclusion
This study takes Twitter as targeted social media platform and presents a visual-textual fused approach to tagging flood related tweets in order to facilitate real-time flood inundation mapping. The study innovatively combines textual feature and visual feature vector from textual CNN and visual CNN respectively and uses the fused vector for the final classification. The result suggests that the additional visual information greatly contributes to the identification of flood relevant tweets. It confirms that the visual-textual fused approach leads to a better classification accuracy. The fused CNN classifier greatly refines the potential flood relevant posts, reducing the number to a degree where manual selection can be applied. Our result also indicates that, coupled with selected flood
relevant tweets, a simple geostatistical model can summarize the flood inundation probability in the study area in real-time, largely benefiting first responders and local authorities when rapid action is needed.
7. References
Avgerinakis, K., Moumtzidou, A., Andreadis, S., Michail, E., Gialampoukidis, I., Vrochidis, S., & Kompatsiaris, I. (2017, September). Visual and textual analysis of social media and satellite images for flood detection@ multimedia satellite task MediaEval 2017. In Proceedings of the Working Notes Proceeding MediaEval Workshop, Dublin, Ireland (pp. 13-15). Feng, Y., & Sester, M. (2018). Extraction of pluvial flood
relevant volunteered geographic information (VGI) by deep learning from user generated texts and photos. ISPRS International Journal of Geo-Information, 7(2), 39.
He, K., Zhang, X., Ren, S., & Sun, J. (2016). Deep residual learning for image recognition. In Proceedings of the IEEE conference on computer vision and pattern recognition (pp. 770-778).
Huang, X., Wang, C., & Li, Z. (2018a). Reconstructing Flood Inundation Probability by Enhancing Near Real-Time Imagery With Real-Time Gauges and Tweets. IEEE Transactions on Geoscience and Remote Sensing, 56(8), 4691-4701.
Huang, X., Wang, C., Li, Z., & Ning, H. (2018b). A visual–textual fused approach to automated tagging of flood-related tweets during a flood event. International
Journal of Digital Earth,
DOI: 10.1080/17538947.2018.1523956.
Huang, X., Wang, C., & Li, Z. (2018c). A near real-time flood-mapping approach by integrating social media and post-event satellite imagery. Annals of GIS, 24(2), 113-123.
Kim, Y. (2014). Convolutional neural networks for sentence classification. arXiv preprint arXiv:1408.5882. Krizhevsky, A., Sutskever, I., & Hinton, G. E. (2012). Imagenet classification with deep convolutional neural networks. In Advances in neural information processing systems (pp. 1097-1105).
Laura, L. F., Joost, W., Marc, B., & Harald, S. (2017). Multi-modal deep learning approach for flood detection. In Proceedings of the MediaEval. Workshop, Dublin Google Scholar.
Li, Z., Wang, C., Emrich, C. T., & Guo, D. (2018). A novel approach to leveraging social media for rapid flood mapping: a case study of the 2015 South Carolina floods. Cartography and Geographic Information Science, 45(2), 97-110.
Schnebele, E., Cervone, G., & Waters, N. (2014). Road assessment after flood events using non-authoritative data. Natural Hazards and Earth System Sciences, 14(4), 1007-1015.
for computer vision. In Proceedings of the IEEE conference on computer vision and pattern recognition (pp. 2818-2826).
Mikolov, T., Chen, K., Corrado, G., & Dean, J. (2013). Efficient estimation of word representations in vector space. arXiv preprint arXiv:1301.3781.
Yosinski, J., Clune, J., Bengio, Y., & Lipson, H. (2014). How transferable are features in deep neural networks?. In Advances in neural information processing systems (pp. 3320-3328).
Russakovsky, O., Deng, J., Su, H., Krause, J., Satheesh, S., Ma, S., ... & Berg, A. C. (2015). Imagenet large scale visual recognition challenge. International journal of computer vision, 115(3), 211-252.
He, K., Zhang, X., Ren, S., & Sun, J. (2016). Deep residual learning for image recognition. In Proceedings of the IEEE conference on computer vision and pattern recognition (pp. 770-778).