ISSN 0975-928X
Research Note
Relationship between seed yield and its
component characters in C
enchrus
spp.
S. Griffa*, M. Quiroga, A. Ribotta, E. López Colomba, E. Carloni, E. Tommasino, C. Luna and K. Grunberg Area de Recursos Genéticos Vegetales, Instituto de Fisiología y Recursos Genéticos Vegetales (IFRGV), Centro de
Investigaciones Agropecuarias (CIAP) (ex IFFIVE) - Instituto Nacional de Tecnología Agropecuaria (INTA). Córdoba, Argentina
*Email: [email protected]
(Received: 13 Jan 2012; Accepted: 10 Mar 2012)
Abstract:
Cenchrus setigerus, C. sp., eleven obligate apomictic cultivars and a sexual line of Cenchrus ciliaris L. were studied to determine the relationship between seed production and its component characters, through principal component analysis, path correlation analysis and analysis of variance. A completely randomized field design was used. Ten vegetative and reproductive morphological characters were measured. Seed production was influenced directly by panicle weight and indirectly by panicle length, 1000 seed weight, length and width of flag leaf lamina and length of flag leaf sheath. Panicle weight showed high heritability and variability among genotypes. Hence, panicle weight can be considered a selection criterion to obtain increased seed production in Cenchrus. The cultivar Lucero INTA PEMAN exhibited the highest panicle weight and, therefore, greatest seed production, which makes it suitable for selection as parental cultivar to obtain new germplasm in Cenchrus with high seed yield.
Keywords: Cenchrus spp., seed production, genetic breeding, path coefficient analysis.
The genus Cenchrus is distributed throughout the
tropics, mainly in Africa and India. It is a subtropical grass species adapted to arid and semiarid regions in
the world (Mansoor et al., 2002). Three forage
species have been identified within the genus: C.
ciliaris, C.setigerus and C. pennisetiformis; the first
two are the most important (Pengelly et al., 1992)
and can also be used as hay or silage and in soil
erosion control (Cook et al., 2005).
In northwestern Argentina, soils have low water retention, low fertility and high salt concentrations. These soils are subjected to overgrazing and are often exposed to several environmental stresses, such as high temperature, high radiation and scarce precipitation. In these environments, the introduction
of subtropical forage grasses, such as C. ciliaris, has
contributed with an important resource for the development of livestock production; however, seeds are obtained only through import or multiplication of introduced germplasm. Thus, genetic improvement of this species to obtain new germplasm for forage and seed production purposes, as well as better adaptation to stress conditions prevailing in northwestern Argentina, has economic and strategic importance for livestock production.
Seed production is a complex trait that is highly
influenced by several genetic factors and
environmental fluctuations (Ali et al., 2008). In
several species, seed production can be directly or
indirectly influenced by agro-morphological
characters, such as plant height, leaf area, dry matter production, flag leaf length and width (Grifiths, 1965;
Fang et al., 2004) as well as reproductive traits, such
as total number of seeds per panicle, number of
spikelet, panicle length (Abbott et al., 2007; Ali et
al., 2008), panicle weight, number of panicles per
plant (Coimbra et al., 1999; Korkut et al., 2001;
Abbott et al., 2009), and 1000 seed weight (Yesilova
et al., 2009; Chandirakala and Subbaraman, 2010). Path analysis decomposes correlations between two variables (X and Y) into a sum of the direct effect of X on Y, through other independent variables in a system of correlations. Path analysis is used to provide possible causal explanations of the correlations observed between a response variable
and a series of predictive variables (Abbott et al.,
2009). This procedure separates direct effects from indirect ones through other related characters, by
Electronic Journal of Plant Breeding, 3(1):701- 706 (Mar 2012) ISSN 0975-928X
http://sites.google.com/site/ejplantbreeding 702
Studying the associations among several seed production component characters and identifying those that have direct influence is useful for plant breeders to achieve successful selection of superior genotypes for future use as parents of new hybrids.
Furthermore, in the selection of primary or direct component characters, estimating the components of variance and heritability is a powerful tool for plant
breeders (Coimbra et al., 1999). A high heritability
value can be associated with greater additive genetic variance, lower environmental variation and lower genotype x environment interaction (Fehr, 1987), which would facilitate selection based on genes of greater effect on the phenotype.
Records on seed production and factors influencing
this trait have been poorly studied in Cenchrus spp.
The aims in the present work were: a) to determine the morphological characters associated with seed production and determining their heretability values and, b) to evaluate the variability among genotypes using variables that have a direct influence on seed
production in Cenchrus spp.
Fifteen genotypes belonging to an active collection of IFRGV-INTA, Córdoba, Argentina, were evaluated
in terms of seed production. They were: Cenchrus
setigerus, Cenchrus sp., an introduced sexual line, and 12 obligate apomictic cultivars (Texas 4464, Lucero INTA PEMAN, Bella, Nueces, Boorara, Molopo, Biloela, Toowomba, Messina, Nunbank,
Americana, and Thabazimbi) of C. ciliaris L. An
experimental plot (10 x 15 m) was established in the Experimental Area of the IFRGV-INTA with 10
plants per genotype, which were randomly
distributed. Sixty tillers per genotype were evaluated, considering the tiller as experimental unit. The following vegetative and reproductive morphological
characters were evaluated: total number of
seeds/panicle (Nºseeds/p), panicle weight (Wp), panicle length (Lp), 1000 seed weight (W1000), length (FLL) and width of flag leaf lamina (FLW), length of flag leaf sheath (FSL), plant height (PLH), and number of vegetative (VB) and reproductive branches (RB) per tiller.
Vegetative characters were measured in the field, with 30 observations per character. At harvest, mature panicles were collected and kept in paper bags to evaluate the reproductive characters. To calculate W1000, five samples of 200 seeds per genotype were weighed.
A multivariate analysis of principal components was conducted using the procedure of InfoStat (Di Rienzo
et al., 2010), to observe the associations between the characters and the genotypes evaluated, and to establish the response variable of seed production for further use in the correlation analysis.
Phenotypic correlations were further analyzed with path analysis, with the aim of exploring the relative importance of the component characters on seed production. Direct path coefficients were calculated using multiple regression analysis with Nºseeds/p as response variable and Wp, Lp, W1000, FLL, FLW, FSL, PLH, VB, and RB as causal variables or regressors. The path analysis was performed using
the InfoStat software (Di Rienzo et al., 2010).
To determine the broad-sense heritability, phenotypic
variation (σ2F), genotypic variance (σ2G) and
environmental variance (σ2A) were estimated with an
ANOVA, following Cruz and Regazzi (1997). Using the variables that most contributed to seed production, an ANOVA was performed with the 15 genotypes; the means were further compared using the multiple comparison Di Rienzo, Guzman, and
Casanoves test (DGC) (Di Rienzo et al., 2002) with a
confidence level of 5%, with the aim of identifying the genotypes of highest yield. Statistical analyses
were made using the software InfoStat (Di Rienzo et
al., 2010).
Principal Component Analysis: The first two components explained 62% of total accumulated variability and are presented in the biplot (Fig. 1).
According to PC1, cv Lucero INTA PEMAN (C.
ciliaris), a hybrid that was recently obtained and registered, is clearly different from the remaining genotypes, even from its parents, cv Biloela and the sexual line. Lucero was strongly associated with the characters: Lp and Wp, W1000 and Nºseeds/p, and cv Nueces was associated with PLH. The cultivar Americana was also very different and both Americana and Toowomba were associated with the character RB. PC2 showed a third group formed by the cultivars Nueces and Boorara, which were characterized by the variables FSL, FLW, FLL and PLH. The remaining genotypes were weakly differentiated from one another, presenting low inertia with respect to PC1 and PC2, and were not associated with any character. The inclusion of PC3 accounted for 81%; the remaining low variability (19%) would be explained by characters that were not included or would be due to experimental error.
PC3 included character VB with high inertia, and C.
sp. was weakly associated with such variable.
ISSN 0975-928X
variables were considered predictors or causal variables.
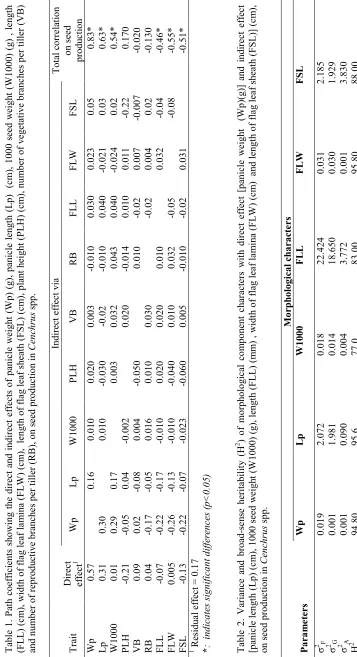
Path analysis: Wp was the only character with positive (r=0.57) and highly significant (p<0.0001) direct effect (Table 1) on seed production, explaining almost the totality of this parameter directly and
indirectly through the remaining characters
considered (RT Wp = 83%). Thus, only 17% can be
due to other non-controlled factors that may be influencing seed production. This suggests that this production component character, Wp, may be a good selection criterion to improve seed production, an
aspect that has not been explored in Cenchrus spp.
The characters PLH, VB and RB did not have any influence on seed production (p>0.05), whereas the remaining variables showed a highly significant correlation (p<0.001). Lp and W1000 were positively correlated (r=0.63 and 0.54, respectively) and FLL, FLW and FSL were negatively correlated (r=0.46, -0.55 and -0.51). Similar results were reported for
panicle length and flag leaf lamina (Abbott et al.,
2007) and for lamina width (Fang et al. 2004). By
contrast, in the present work, the correlations for leaf dimensions had negative signs. Despite showing a significant correlation according to the path analysis, these five variables, Lp, W1000, FLL, FLW and FSL, had low direct effects and high indirect effects, in all cases through Wp; therefore, they are considered secondary component characters of seed production in Cenchrus spp.
Broad-sense heritability:Phenotypic and genotypic variances, as well as broad-sense heritability, are
presented in Table 2. According to Coimbra et al.
(1999), several of the questions of improvement programs can be addressed by estimating variance and heritability. High heritability values were obtained, not only for the variable Wp, which has a direct effect, but also for those that influenced seed
production indirectly. Panicle weight had an h2 value
of 94.8%. According to Fehr (1987), such a high heritability value can be associated with high additive genetic variance, low environmental variation and low genotype-environment interaction. This result shows an increase in the probability of success in the
selection of Cenchrus spp. through Wp, because this
character would be significantly inherited from generation to generation.
The characters that have indirect effect on seed
production, W1000, Wp and FLW, showed high h2
values (77%, 95.6% and 95.8%, respectively), which
is in agreement with findings in other grasses (Ali et
al., 2008; Fang et al., 2004). FLL and FSL also had high heritability values (83% and 88%, respectively).
All these characters are considered reliable and of having low environmental influence for use as selection criteria.
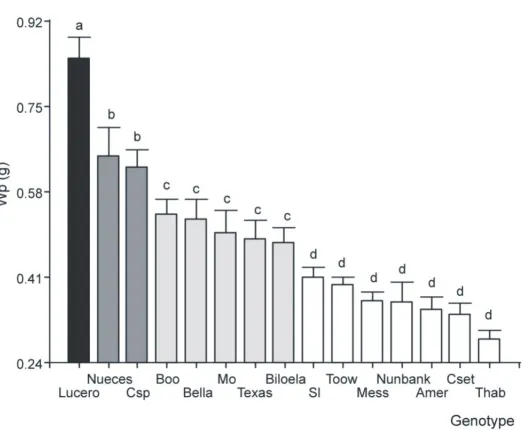
Analysis of Variance: Considering that according to the PCA and the path analysis, Wp is the component that most significantly contributes to seed production, the genotypes were evaluated by ANOVA and DGC test (p<0.05) in terms of Wp. The results are presented in Fig. 2.
The character Wp showed highly significant differences (p<0.0001), high discriminant power and high variation among genotypes. According to this character, genotypes were differentiated into four groups. The first group was composed of the cultivar Lucero INTA PEMAN, which had the greatest panicle weight (mean Wp = 0.85 g) (Fig. 2); the
second group included C. sp. and cv Nueces (0.63
and 0.65 g, respectively). Both C. ciliaris cultivars
(Lucero and Nueces) would be considered promising male parents for controlled crosses to obtain new
genotypes of higher seed production, whereas C. sp.
would be useful in interspecific crosses with C.
ciliaris sexual line. The third group was composed of
the apomictic cultivarsBoorara Bella, Molopo, Texas
and Biloela, with intermediate panicle weight (mean
values of 0.53 to 0.48 g). Finally, the fourth group
included C. setigerus, sexual line and the cultivars
Toowomba, Messina, Nunbank, Americana and Thabazimbi, which exhibited the lowest Wp (0.41 to 0.28 g) and would therefore be the genotypes of lowest seed production.
Overall, panicle weight was the morphological character that had a direct effect on seed production in Cenchrus spp., with high heritability and was very useful to discriminate among genotypes in the present
study. The new C. ciliaris cultivar, Lucero INTA
PEMAN, exhibited the highest panicle weight. Therefore, it would be the genotype of highest seed production and could be used as parent in future
controlled crosses to increase seed yield in Cenchrus.
Funding: Projects: FONCyT-PICT-N°507;
INTA-AEFP-N°261821.
References
Abbott, L. A., Pistorale, S. M. and Andrés, A. 2009. Evaluación de los componentes del rendimiento en semilla mediante coeficientes de sendero en poblaciones de agropiro alargado. Agriscientia,
26 (2): 55-62.
Abbott, L. A., Pistorale, S. M. and Filippini, O. S. 2007. Análisis de coeficientes de sendero para el rendimiento de semillas en Bromus catharticus.
Electronic Journal of Plant Breeding, 3(1):701- 706 (Mar 2012) ISSN 0975-928X
http://sites.google.com/site/ejplantbreeding 704
Ali, Y., Atta, B. M.; Akhter, J.; Monneveux, P. and Lateef, Z. 2008. Genetic variability, association and diversity studies in wheat (Triticum aestivum L.) germplasm. Pakistan J. Bot., 40: 2087-2097. Chandirakala, R. and Subbaraman, N. 2010. Character
association and path analysis for yield attributes in full sib progenies in Pigeonpea (Cajanus cajan (L.) Mill sp.). Electron J. Plant Breed., 1(4): 824-827.
Coimbra, J. L. M., Guidolin, A. F. and Carvalho, F. I. F. 1999. Parámetros genéticos do rendimiento de graos e seus componentes com implicacoes na selecao indireta em genótipos de feijao preto.
Ciênc. Rural, 29 (1): 1-6.
Cook, B. G., Pengelly, B. C.; Brown, S. D.; Donnelly, J. L.; Eagles, D. A.; Franco, M. A.; Hanson, J.; Mullen, B. F.; Partridge, I. J.; Peters, M. and Schultze-Kraft, R. 2005. Tropical Forages: an interactive selection tool. [CD-ROM], CSIRO, DPI&F (Qld), CIAT and ILRI, Brisbane, Australia. Cruz, C. D. and Regazzi, A. J. 1997. Modelos Biométricos
Aplicados ao Melhoramento genético. 2da Ed. Vicosa: UFV: Imprensa Universitaria, 390 pp. Di Rienzo J.A., Casanoves F., Balzarini M.G., Gonzalez L.,
Tablada M., Robledo C.W. InfoStat versión 2010. Grupo InfoStat, FCA, Universidad Nacional de Córdoba, Argentina. URL http://www.infostat.com.ar
Di Rienzo, J. A.; Guzmán, A. W. and Casanoves, F. 2002. A multiple comparisons method based on the distribution of the root node distance of a binary tree. J. Agric. Biol. Envir. S., 7 (2): 1-14. Fang, C., Aamlid, T. S.; Jorgensen, O. and Rognli, O. A.
2004. Phenotypic and genotypic variation in seed production traits within a full-sib family of meadow fescue. Plant Breed., 123: 241-246. Fehr, W.R. 1987. Principles of cultivars development.
Macmillan Inc. New York. 536 pp.
Grifiths, D.J. 1965. Breeding for higher seed yields from herbage varietes. J. Nat. Inst. Agric. Bot., 10: 320-331.
Korkut, K. Z.,Baser, I. and Bilgin, O. 2001. Genotypic and phenotypic variability, heritability and phenotypic correlation for yield and yield components in bread wheat varietes. Acta Agron.
Hung., 49 (3):237-242.
Mansoor, U., Mansoor, H.; Wahid, A. and Rao, A. R. 2002. Ecotypic variability for drought resistance in Cenchrus ciliaris L. germplasm from Cholistan Desert in Pakistan. Int. J. Agr. Biol., 4 (3): 392– 397.
Pengelly, B. C., Hacker, J. B. and Eagles, D. A. 1992. The classification of a collection of buffel grasses and related species. Trop. Grassl., 26 (1):1-6. Yesilova, A.,Gorttapeh, A. H.; Zardashty, M. R. and Talat,
E le ct ro n ic J o u rn al o f P la n t B re ed in g , 3 (1 ): 7 0 1 - 7 0 6 ( M ar 2 0 1 2 ) IS S N 0 9 7 5 -9 2 8 X h tt p :/ /s it es .g o o g le .c o m /s it e/ ej p la n tb re ed in g T ab le 1 . P at h c o ef fi ci en ts s h o w in g t h e d ir ec t an d i n d ir ec t ef fe ct s o f p an ic le w ei g h t (W p ) (g ), p an ic le l en g th ( L p ) ( cm ), 1 0 0 0 s ee d w ei g h t (W 1 0 0 0 ) (g ) , le n (F L L ) (c m ), w id th o f fl a g l ea f la m in a (F L W ) (c m ), le n g th o f fl a g l ea f sh ea th ( F S L ) (c m ), p la n t h ei g h t (P L H ) (c m ), n u m b er o f v eg et at iv e b ra n c h es p er t il le r (V an d n u m b er o f re p ro d u ct iv e b ra n ch e s p er t il le r (R B ), o n s ee d p ro d u ct io n i n C en ch ru s sp p . In d ir ec t ef fe c t v ia T o ta l co rr el at o n s ee d p ro d u ct io n T ra it D ir ec t ef fe c t 1 W p L p W 1 0 0 0 P L H V B R B F L L F L W F S L W p 0 .5 7 0 .1 6 0 .0 1 0 0 .0 2 0 0 .0 0 3 -0 .0 1 0 0 .0 3 0 0 .0 2 3 0 .0 5 0 .8 3 * L p 0 .3 1 0 .3 0 0 .0 1 0 -0 .0 3 0 -0 .0 2 -0 .0 1 0 0 .0 4 0 -0 .0 2 1 0 .0 3 0 .6 3 * W 1 0 0 0 0 .0 1 0 .2 9 0 .1 7 0 .0 0 3 0 .0 3 2 0 .0 4 3 0 .0 4 0 -0 .0 2 4 0 .0 2 0 .5 4 * P L H -0 .2 1 -0 .0 5 0 .0 4 -0 .0 0 2 0 .0 2 0 -0 .0 1 4 0 .0 1 0 0 .0 1 1 -0 .2 2 0 .1 7 0 V B 0 .0 9 0 .0 2 -0 .0 8 0 .0 0 4 -0 .0 5 0 0 .0 1 0 -0 .0 2 0 .0 0 7 -0 .0 0 7 -0 .0 2 0 R B 0 .0 4 -0 .1 7 -0 .0 5 0 .0 1 6 0 .0 1 0 0 .0 3 0 -0 .0 2 0 .0 0 4 0 .0 2 -0 .1 3 0 F L L -0 .0 7 -0 .2 2 -0 .1 7 -0 .0 1 0 0 .0 2 0 0 .0 2 0 0 .0 1 0 0 .0 3 2 -0 .0 4 -0 .4 6 * F L W 0 .0 0 5 -0 .2 6 -0 .1 3 -0 .0 1 0 -0 .0 4 0 0 .0 1 0 0 .0 3 2 -0 .0 5 -0 .0 8 -0 .5 5 * F S L -0 .1 3 -0 .2 2 -0 .0 7 -0 .0 2 3 -0 .0 6 0 0 .0 0 5 -0 .0 1 0 -0 .0 2 0 .0 3 1 -0 .5 1 *
1 R
Electronic Journal of Plant Breeding, 3(1):701- 706 (Mar 2012) ISSN 0975-928X
http://sites.google.com/site/ejplantbreeding 706
Fig. 1. Biplot graph of principal component analysis obtained by evaluating genotypes of Cenchrus spp., using
morphological characters, with respect to the first two axes (PC1 and PC2)
Fig. 2. Mean±standard error for panicle weight (Wp) of the apomictic cultivars Lucero INTA PEMAN (Lucero),
Nueces, Boorara (Boo), Bella, Molopo (Mo), Texas 4464 (Texas), Biloela, Toowomba (Toow), Messina (Mess),
Nunbank, Americana (Amer), Thabazimbi (Thab) and the sexual line (Sl); Cenchrus sp.(Csp) and C. setigerus (C.