4845 DEVELOPMENT AND VALIDATION OF Q-ABSORBANCE RATIO
SPECTROPHOTOMETRIC METHOD FOR SIMULTANEOUS ESTIMATION OF ALISKIREN AND LOSARTAN POTASSIUM IN SYNTHETIC MIXTURE
Rimpalben Patel*, Jignesh Shah, Dilip G. Maheshwari
Department of Quality Assurance, L. J. Institute of Pharmacy, Ahmedabad-380021, India.
*Corresponding author E-Mail: [email protected]
ARTICLE INFO ABSTRACT
Key words
Aliskiren, Losartan Potassium, Q-Absorbance Ratio,
Simultaneous Estimation, Method
Validation
An accurate, simple, precise and reproducible UV-spectrophotometric method was developed and validated for simultaneous determination of Aliskiren and Losartan Potassium in synthetic mixture. Spectrophotometric estimation of Aliskiren and Losartan Potassium was carried out at 272nm and 250nm by Q Absorbance ratio method using distilled water as solvent. Linearity was performed over the concentration range of 15-90μg/ml and 5-30μg/ml for Aliskiren and Losartan Potassium respectively with correlation coefficient greater than 0.999 for both the drugs. The developed method was validated according to ICH Q2 (R1) guidelines and whereby %RSD values were found to be less than 2% complying the validation requirements. Method can be applied for routine analysis of Aliskiren and Losartan Potassium in Synthetic mixture.
INTRODUCTION
Aliskiren is direct renin inhibitor and used in treatment of hypertension. Renin is secreted by the kidney which cleaves angiotensinogen to form the inactive decapeptide angiotensin I (Ang I). Ang I is converted to the active octapeptide angiotensin II (Ang II) by ACE and non‐ACE pathways. Ang II inhibits renin release, thus providing a negative feedback to the system. Aliskiren is soluble in water and methanol and available as white to bright to yellowish crystalline powder. Losartan potassium is angiotensin receptor blocker and used in treatment of hypertension. Losartan potassium competitively inhibits the binding of angiotensin II to AT1 in many
tissues including vascular smooth muscle and the adrenal glands. Inhibition of angiotensin II binding to AT1 inhibits its AT1-mediated vasoconstrictive and aldosterone-secreting effects and results in decreased vascular resistance and blood pressure. Losartan Potassium is soluble in water and methanol and available as white to off white crystalline powder. From the literature survey, it was observed that various methods are reported for analysis of Aliskiren and Losartan Potassium, individually as well as in combination with other drugs. But no analytical method has been reported for analysis of Aliskiren and Losartan Potassium in synthetic mixture. A successful attempt has been made to estimate both drugs simultaneously by Q
An Elsevier Indexed Journal ISSN-2230-7346
4846 Absorbance ratio spectrophotometric
method. The objective of the investigation
is to develop and validate an analytical method for the estimation of Aliskiren and Losartan Potassium in a
combined mixture by Q Absorbance ratio spectrophotometric method.
MATERIALS AND METHOD: Melting point apparatus, UV Visible Spectrophotometer: A Shimadzu model 1800 (Japan) with spectral width of 2nm, wavelength accuracy of 0.5nm and a pair of 10mm matched quartz cell. Spectra were automatically obtained by UV probe system software. (UV probe version 2.31) Digital Analytical balance-Wensar DAB 220, Sonicator- Equitron REAGENTS AND MATERIALS
Aliskiren and Losartan Potassium were procured as generous gift sample by (Novartis India) and (West cost Pharma Ahmedabad). Distilled water was used as solvent.
IDENTIFICATION BY MELTING POINT DETERMINATION [3,4]
Melting point of Aliskiren API and Losartan Potassium API has been determined by open capillary method using Melting point apparatus in which both the drugs were filled in Capillary tubes and kept in the Melting point apparatus which shows the Melting range Aliskiren and Losartan Potassium.
SOLUBILITY DETERMINATION: [5-6] The solubility study of Aliskiren and Losartan Potassium was determined by taking 10 mg of both drug in 10 ml volumetric flasks, add the required quantity of solvent for complete solubility.
UV SPECTROPHOTOMETRIC METHOD [7-8]
Q-Absorbance ratio method for Estimation of Aliskiren and Losartan Potassium
EXPERIMENTAL WORK
Preparation of standard stock solution (100µg/ml): Accurately weighed 10 mg of Aliskiren and Losartan Potassium and transferred into separate 100ml volumetric
flask, dissolved, sonicated and made up to the mark with Distilled water (100µg/ml). The solutions were scanned in the range 200-400nm and λmax found to be 279nm for Aliskiren and 250nm for Losartan Potassium.
Selection of wavelength:
3ml working standard stock solution of Aliskiren (100 µg/ml) and 1ml working standard stock solution of Losartan Potassium (100 µg/ml) was transferred in to different 10 ml volumetric flask and dilute up to mark with Distilled water to get 30µg/ml and 10µg/ml of Aliskiren and Losartan Potassium. Each solution was scanned in the range of 200-400 nm. From the overlain spectra of Aliskiren and Losartan Potassium, it is evident that Aliskiren and Losartan Potassium shows an isoabsorptive point at 272nm. The second wavelength used is 250nm, which is the λmax of Losartan Potassium.
Calibration Curve for Aliskiren (15-90 µg/ml):
An aliquots of stock solution of Aliskiren (100 µg/ml) 1.5, 3, 4.5, 6, 7.5, 9, ml was pipette out in 6 different 10ml volumetric flask and was made up to the mark with Distilled water to get 15, 30, 45, 60, 75, 90µg/ml respectively. Absorbance of each solution was measured at 272nm (isoabsorptive point) and 250nm (λmax of Losartan Potassium) using Distilled water as blank. Graph of Absorbance vs. Concentration (µg/ml) was plotted.
Calibration Curve for Losartan Potassium: (5-30µg/ml)
4847 Graph of Absorbance vs. Concentration
(µg/ml) was plotted. ASSAY: [7,8]
Preparation of Synthetic Mixture of Aliskiren and Losartan Potassium:
The synthetic mixture of Aliskiren and Losartan Potassium was prepared in ratio of 3:1. Common excipients: Microcrystalline cellulose, Lactose, Starch, Magnesium stearate, Talc. Accurately weigh powder equivalent to weight of Aliskiren (30mg) and Losartan Potassium(10mg) and transferred in 100 ml volumetric flask and make up to the mark with Distilled water. This solution was sonicated and filtered.
The mixture contains Aliskiren 300µg/ml and Losartan Potassium 100µg/ml.
Preparation of Sample Solution:
From the above synthetic mixture 1 ml was pipetted out in 10ml volumetric flask and made up to the mark with Distilled water to obtain final concentration of Aliskiren 30µg/ml and Losartan Potassium 10µg/ml. The concentration of each drug was calculated using equation of Q-absorption Ratio method. CX = [(QM-QY)/ (QX-QY)] × A1/ax1………… (1) and CY = [(QM-QX)/ (QY-QX)] × A1/ay1………… (2)
Where, Cx= concentration of Losartan Potassium, Cy= concentration of Aliskiren, A1 and A2 are absorbances of mixture at 272nm and 250nm, ax1 and ay1 are the absorptivities of Losartan Potassium and Aliskiren at 272nm, ax2 and ay2 are the absorptivities of Losartan Potassium and Aliskiren at 250nm, Qm = A2/ A1, QX= ax2/ax1, Qy= ay2/ay1
Method validation: [9]
The developed method was validated with respect to linearity, accuracy, and precision, limit of detection and limit of quantification in accordance with the ICH guideline Q2 (R1).
Linearity and range (N=6):
The linearity of Aliskiren and Losartan Potassium was found to be in the range of 15-90µg/ml and 5-30 µg/ml,
respectively. Linearity of both the drugs was checked in term of slope, intercept and correlation coefficient.
PRECISION
1. Intraday precision (n=3): Solution containing Aliskiren 15, 30, 45µg/ml and Losartan Potassium 5, 10, 15µg/ml were analysed three times on the same day and %R.S. D was calculated.
2. Interday precision (n=3): Solution containing Aliskiren 15, 30,45µg/ml and Losartan Potassium 5, 10, 15µg/ml analysed three times on analysed on three different successive days and %R.S. D was calculated.
3. Repeatability (n=6): Solutions containing of 30µg/ml of Aliskiren and 10µg/ml Losartan Potassium were analysed three times on the same day and % R.S.D. was calculated. %R.S. D was not more than 2%.
LIMIT OF DETECTION (LOD): The L.O.D. was estimated from the set of calibration curves of Aliskiren and Losartan Potassium used to determine method linearity. Limit of detection can be calculated using following equation as per ICH guidelines. LOD = 3.3 σ/S
Where,
σ = Standard deviation of the Y intercept of calibration curve
S = Mean slope of the corresponding calibration curve.
limit of quantitation:
The L.O.Q. was estimated from the set of calibration curves of Aliskiren and Losartan Potassium used to determine method linearity.
Limit of quantitation can be calculated using following equation as per ICH guidelines.
LOQ = 10 σ/S Where,
σ = Standard deviation of the Y intercept of calibration curve
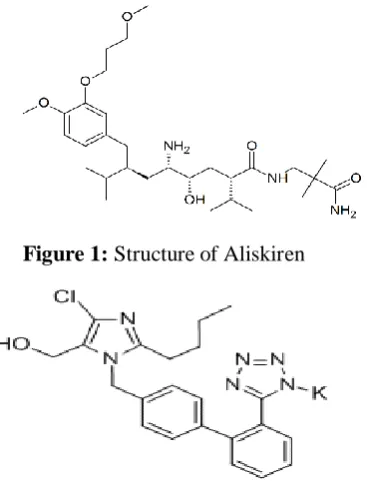
4848 Figure 1: Structure of Aliskiren
Figure 2: Structure of Losartan Potassium
Table 1: Melting Point of Aliskiren and Losartan Potassium.
Sr. no Drug Reported melting point Observed melting point
1 Aliskiren 60-65̊С 60-63̊С
2 Losartan
Potassium 270-276̊С 270-274̊С
Table 2: Solubility of Aliskiren and Losartan Potassium.
Solvent Aliskiren Losartan Potassium
Distilled Water Soluble Soluble
Methanol Soluble Soluble
0.1N NaOH Soluble Soluble
0.1N HCl Soluble Soluble
Table 3: Identification by UV Visible Spectroscopy
Drug Standard λmax Observed λmax
Aliskiren 279nm 279nm
Losartan Potassium 254nm 250nm
4849 Figure 4: Losartan Potassium UV Identification (10 µg/ml)
Figure 5: Overlain spectra of Aliskiren (30µg/ml) and Losartan Potassium (10µg/ml) in distilled water
4850
Figure 7: Overlay spectra of Losartan Potassium in distilled water (5-30µg/ml)
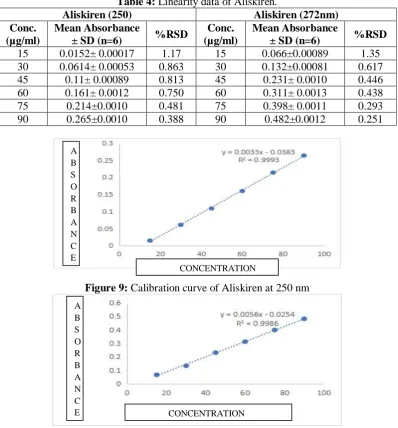
Table 4: Linearity data of Aliskiren.
Aliskiren (250) Aliskiren (272nm) Conc.
(µg/ml)
Mean Absorbance
± SD (n=6) %RSD
Conc. (µg/ml)
Mean Absorbance
± SD (n=6) %RSD
15 0.0152± 0.00017 1.17 15 0.066±0.00089 1.35
30 0.0614± 0.00053 0.863 30 0.132±0.00081 0.617
45 0.11± 0.00089 0.813 45 0.231± 0.0010 0.446
60 0.161± 0.0012 0.750 60 0.311± 0.0013 0.438
75 0.214±0.0010 0.481 75 0.398± 0.0011 0.293
90 0.265±0.0010 0.388 90 0.482±0.0012 0.251
Figure 9: Calibration curve of Aliskiren at 250 nm
Figure 10: calibration curve of Aliskiren at 272 nm A
B S O R B A N C E
CONCENTRATION
A B S O R B A N C
4851 Table 5: Linearity data of Losartan Potassium
Losartan Potassium (250 nm) Losartan Potassium (272nm)
Conc. (µg/ml)
Mean absorbance±
SD (n=6)
% RSD Conc. (µg/ml)
Mean absorbance ±
SD (n=6)
% RSD
5 0.121 ±0.00104 0.863 5 0.066±0.00089 1.35
10 0.314± 0.0013 0.422 10 0.132±0.00081 0.617
15 0.495± 0.0014 0.285 15 0.231± 0.0010 0.446
20 0.712±0.0014 0.198 20 0.311± 0.0013 0.438
25 0.911±0.0013 0.149 25 0.398± 0.0011 0.293
30 1.115±0.0012 0.108 30 0.482±0.0012 0.251
Figure 11: Calibration curve of Losartan Potassium at 250 nm
Figure 12: Calibration curve of Losartan Potassium at 272 nm
Table 6: Precision study of Aliskiren at 250 nm
Interday Precision of Aliskiren (n=3)
Conc. (µg/ml) Mean Absorbance ±SD (n=3) % RSD
15 0.017±0.00016 0.955
30 0.065±0.00058 0.892
45 0.111±0.00061 0.547
Intraday Precision of Aliskiren (n=3)
Conc. (µg/ml) Mean Absorbance ±SD (n=3) % RSD
15 0.016±0.00015 0.946
30 0.065±0.00055 0.852
45 0.111±0.00045 0.415
Repeatability of Aliskiren (n=6)
Conc. (µg/ml) Mean Absorbance ±SD (n=6) % RSD
30 0.063±0.00056 0.878
A B S O R B A N C E
CONCENTRATION
A B S O R B A N C E
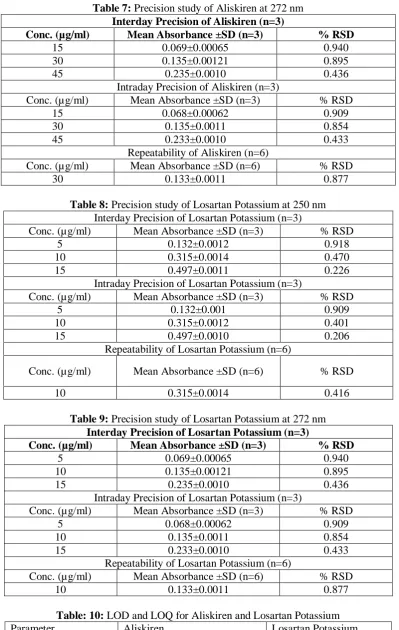
4852 Table 7: Precision study of Aliskiren at 272 nm
Interday Precision of Aliskiren (n=3)
Conc. (µg/ml) Mean Absorbance ±SD (n=3) % RSD
15 0.069±0.00065 0.940
30 0.135±0.00121 0.895
45 0.235±0.0010 0.436
Intraday Precision of Aliskiren (n=3)
Conc. (µg/ml) Mean Absorbance ±SD (n=3) % RSD
15 0.068±0.00062 0.909
30 0.135±0.0011 0.854
45 0.233±0.0010 0.433
Repeatability of Aliskiren (n=6)
Conc. (µg/ml) Mean Absorbance ±SD (n=6) % RSD
30 0.133±0.0011 0.877
Table 8: Precision study of Losartan Potassium at 250 nm Interday Precision of Losartan Potassium (n=3)
Conc. (µg/ml) Mean Absorbance ±SD (n=3) % RSD
5 0.132±0.0012 0.918
10 0.315±0.0014 0.470
15 0.497±0.0011 0.226
Intraday Precision of Losartan Potassium (n=3)
Conc. (µg/ml) Mean Absorbance ±SD (n=3) % RSD
5 0.132±0.001 0.909
10 0.315±0.0012 0.401
15 0.497±0.0010 0.206
Repeatability of Losartan Potassium (n=6)
Conc. (µg/ml) Mean Absorbance ±SD (n=6) % RSD
10 0.315±0.0014 0.416
Table 9: Precision study of Losartan Potassium at 272 nm
Interday Precision of Losartan Potassium (n=3)
Conc. (µg/ml) Mean Absorbance ±SD (n=3) % RSD
5 0.069±0.00065 0.940
10 0.135±0.00121 0.895
15 0.235±0.0010 0.436
Intraday Precision of Losartan Potassium (n=3)
Conc. (µg/ml) Mean Absorbance ±SD (n=3) % RSD
5 0.068±0.00062 0.909
10 0.135±0.0011 0.854
15 0.233±0.0010 0.433
Repeatability of Losartan Potassium (n=6)
Conc. (µg/ml) Mean Absorbance ±SD (n=6) % RSD
10 0.133±0.0011 0.877
Table: 10: LOD and LOQ for Aliskiren and Losartan Potassium
Parameter Aliskiren Losartan Potassium
LOD (µg/ml) 0.082 0.280
LOQ (µg/ml) 0.250 0.850
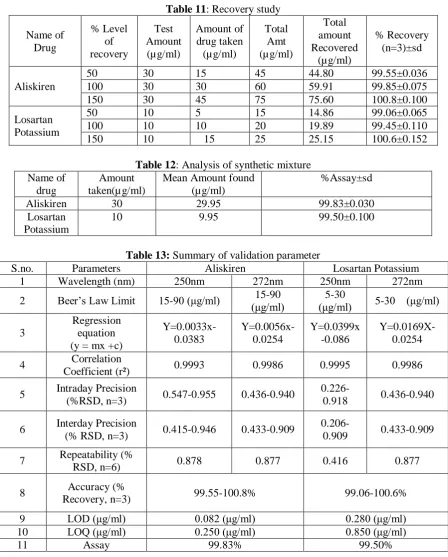
4853 Table 11: Recovery study
Name of Drug % Level of recovery Test Amount (µg/ml) Amount of drug taken (µg/ml) Total Amt (µg/ml) Total amount Recovered (µg/ml) % Recovery (n=3)±sd Aliskiren
50 30 15 45 44.80 99.55±0.036
100 30 30 60 59.91 99.85±0.075
150 30 45 75 75.60 100.8±0.100
Losartan Potassium
50 10 5 15 14.86 99.06±0.065
100 10 10 20 19.89 99.45±0.110
150 10 15 25 25.15 100.6±0.152
Table 12: Analysis of synthetic mixture Name of
drug
Amount taken(µg/ml)
Mean Amount found (µg/ml)
%Assay±sd
Aliskiren 30 29.95 99.83±0.030
Losartan Potassium
10 9.95 99.50±0.100
Table 13: Summary of validation parameter
S.no. Parameters Aliskiren Losartan Potassium
1 Wavelength (nm) 250nm 272nm 250nm 272nm
2 Beer’s Law Limit 15-90 (μg/ml) (μg/ml) 15-90 (μg/ml) 5-30 5-30 (μg/ml)
3
Regression equation (y = mx +c)
Y=0.0033x-0.0383 Y=0.0056x-0.0254 Y=0.0399x -0.086 Y=0.0169X-0.0254
4 Correlation
Coefficient (r²) 0.9993 0.9986 0.9995 0.9986
5 Intraday Precision
(%RSD, n=3) 0.547-0.955 0.436-0.940
0.226-0.918 0.436-0.940
6 Interday Precision
(% RSD, n=3) 0.415-0.946 0.433-0.909
0.206-0.909 0.433-0.909
7 Repeatability (%
RSD, n=6) 0.878 0.877 0.416 0.877
8 Accuracy (%
Recovery, n=3) 99.55-100.8% 99.06-100.6%
9 LOD (μg/ml) 0.082 (μg/ml) 0.280 (μg/ml)
10 LOQ (μg/ml) 0.250 (μg/ml) 0.850 (μg/ml)
11 Assay 99.83% 99.50%
ACCURACY (RECOVERY STUDY) (n=3)
The accuracy of an analytical procedure expresses the closeness of agreement between the value which is accepted either as conventional the value or an accepted reference value found.
Accuracy of the developed method concentration levels 50%, 100%, 150%. RESULT AND DISCUSSION:
4854 200-400 nm. The primary requirement for
developing a method for analysis is to follow the Beer’s law at all the wavelength, which was fulfilled in case of both these drugs. The two wavelengths were used for the analysis of the drugs were 272 nm (iso-absorptive point) and 250 nm (λ-max of Losartan Potassium) at which the calibration curves were prepared for both the drugs. The overlain UV absorption spectra of Aliskiren (279nm) and Losartan Potassium (250nm) showing iso-absorptive point (272nm) in distilled water is shown in (Figure 5). The validation parameters were studied at all the wavelengths for the proposed method. Accuracy was determined by calculating the recovery and the mean was determined (as shown in Table 11). Precision was calculated as repeatability for both the drugs. Hence, the method can be employed for the routine analysis of these two drugs in combined synthetic mixture. CONCLUSION:
A simple, accurate and precise Q-Absorbance method has been developed and validated for routine analysis of Aliskiren and Losartan Potassium. The developed method is recommended for routine and quality control analysis of both the drugs in synthetic Mixture.
ACKNOWLEDGMENT
The authors are highly thankful to Dr. K. Pundarikakshudu, Director of L. J. Institute of Pharmacy, Ahmedabad, India for providing valuable guidance and all the facilities to carry out the research work.
REFERENCES:
1. Pub chem, “national chemistry database”
September 2017,
https://pubchem.ncbi.nlm.nih.gov/compou nd/Aliskiren
2. “Pub chem, “national chemistry database”
September 2017,
https://pubchem.ncbi.nlm.nih.gov/compou nd/losartan_potassium
3. Vrecer, Skrabanja, Vida, Zajc, Natalija, Gojak, Urska, “Solid dosage form comprising aliskiren and pharmaceutical acceptable salt there of” World intellectual property organization patents WIPO 2008/116601 A4.
4. Maryadele NJ. The Merck index an Encyclopedia of chemicals drugs and biological; 14th Edn; Merch Research Laboratories, UK,2006, pp 247.
5. Kumara SG, Kumar JMR, Sheshagirirao JVLN, Vinay DK, Ratna CM, Eswara VNVK, “Validated Spectrophotometric Determination of Aliskiren in Pharmaceutical Dosage Form” JPR, 2011,4, pp 2574-2575.
6. Indian Pharmacopoeia. Government of India Ministry of Health and Family Welfare Published by Indian
Pharmacopoeia Commission,
Ghaziabad,2014 Vol-II, pp 2123-2124 7. Beckett AH and Stenlake JB: Practical
Pharmaceutical Chemistry.CBS Publication, Edition 4, part 1, 2001:87 8. Rowe RC, Sheskey PJ, Quinn ME.
Handbook of Pharmaceutical Excipients; 6th Edn; Pharmaceutical Press, London,2009, pp 210-214,404-407,663-665,728-730.