Available Online at www.ijpret.com 1
INTERNATIONAL JOURNAL OF PURE AND
APPLIED RESEARCH IN ENGINEERING AND
TECHNOLOGY
A PATH FOR HORIZING YOUR INNOVATIVE WORK
CLASSIFICATION OF LANDSAT 8 OPERATIONAL LAND IMAGER DATA USING
SUPPORT VECTOR MACHINE
AMIT KUMAR VERMA1, DR. P. K. GARG2, DR. K. S. HARI PRASAD3
1. Dept. of Geomatics Engg., IIT Roorkee, Roorkee-247667. 2. Vice Chancellor, UTU, Dehradun-248007.
3. Dept. of Civil Engg., IIT Roorkee, Roorkee-247667.
Accepted Date: 15/03/2016; Published Date: 01/05/2016
\
Abstract: Developments in remote sensing techniques offer a powerful and cost effective means for land use/land cover mapping. LULC mapping information has been identified as one of the crucial data components for many aspects of global change studies and environmental applications. Support Vector Machines (SVM) is a relatively new supervised classification technique for land cover mapping. In this paper, support vector machine is used to classify Landsat 8 operational land Imager data into six major land cover classes. The training area is determined carefully by visual interpretation of false colour composite (FCC) and with the aid of ground control points which are collected using Juno Global Positioning system (GPS). Overall the study shows that SVM is able to classify satellite imagery of Landsat 8 with high overall accuracy and kappa coefficient of 79.45% and 0.78 respectively.
Keywords: Satellite Images, Support vector machine, Classification, GPS
Corresponding Author: MR. AMIT KUMAR VERMA
Access Online On:
www.ijpret.com
How to Cite This Article:
Amit Kumar Verma, IJPRET, 2016; Volume 4 (9): 1-10
Available Online at www.ijpret.com 2
INTRODUCTION
Land mapping is one of the most important application of remote sensing. It has been widely used in many fields such as land resource planning, geological mapping, town planning and studies of environmental change. Remote sensing measures land surfaces at various spatial and temporal scales. One of the widely used approaches for deriving land cover information from satellite images is classification. Various classification algorithms have been developed since first Landsat image was acquired in early 1970 [1] [2]. Among the most popular are the MLC, artificial neural network and Decision tree classification. The MLC is a parametric classifier based on statistical theory which is most widely used classifier [3] [4]. MLC needs large training area and assumption that the data are normally distributed [5]. Artificial Neural networks avoid some of the problems of the MLC by adopting a non-parametric approach. The most widely used classification of RS images is a group of networks called a multi-layer perceptron (MLP) [6] [7]. A decision tree classifier breaks an often very complex classification problem into multiple stages of simpler decision-making processes [8]. Depending on the number of variables used at each stage, there are univariate and multivariate decision trees [9]. Multivariate decision trees are often more accurate and can be more compact than univariate decision trees [10]. In recent years, support vector machine have been developed for better and reliable classification methods for land cover mapping.
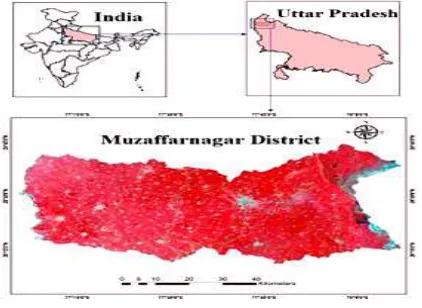
II. STUDY AREA
Muaffarnagar district of Uttar Pradesh has been taken for this work which lies between 29° 14' 28.35"N - 29° 42' 36.68"N Latitude and 77° 03' 45.26"E - 78° 11' 35.04"E Longitude. The study area is shown in Figure 1.
Available Online at www.ijpret.com 3
III. MATERIALS AND METHODS
Software: Three software have been used for this work. ERDAS IMAGINE 2014 is used for
geometric correction. ENVI 5.1 is used for atmospheric correction, radiometric correction, ROI (region of interest) generation and then classification. ARC GIS 10.2 is used for map preparation.
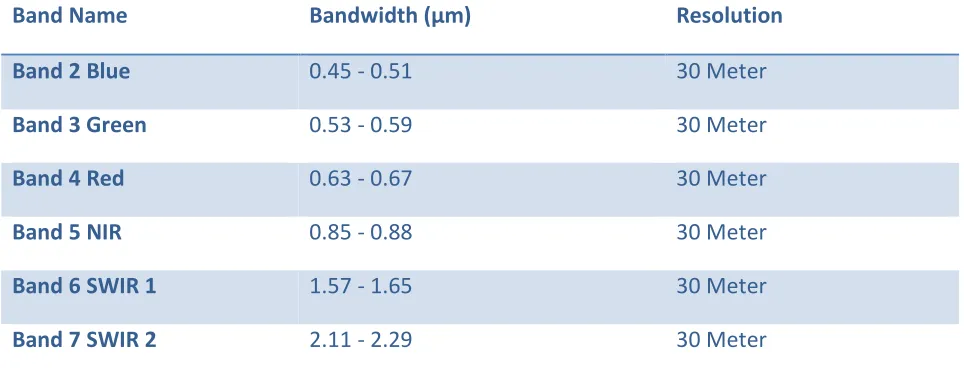
Satellite Data: U.S. Geological Survey (USGS) Landsat 8, operational land Imager (OLI) sensor
data (Entity ID LC81460402014312LGN00, Path 146, Row 40) of November 08, 2014 has been taken for the research work. This is 16-bit unsigned integer data. The OLI sensor has eleven band in different region of EMR in which we used only six bands (Blue, Green, Red, NIR, SWIR1 and SWIR2). The details of OLI sensor data are given below in Table1.
Band Name Bandwidth (µm) Resolution
Band 2 Blue 0.45 - 0.51 30 Meter
Band 3 Green 0.53 - 0.59 30 Meter
Band 4 Red 0.63 - 0.67 30 Meter
Band 5 NIR 0.85 - 0.88 30 Meter
Band 6 SWIR 1 1.57 - 1.65 30 Meter
Band 7 SWIR 2 2.11 - 2.29 30 Meter
Table 1. Specification of OLI Sensor data
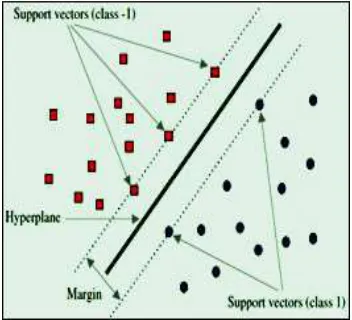
Support Vector Machine: SVM is a supervised classification technique which is characterised by
Available Online at www.ijpret.com 4
Figure 2. Linear support vector machine
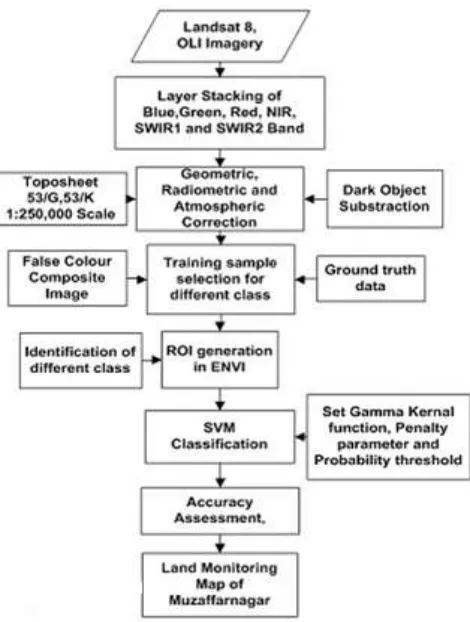
Methodology used for classification:
Available Online at www.ijpret.com 5
Figure 3. Methodology flow diagram
Histogram for each class:
Available Online at www.ijpret.com 6
(b) Fallow Land
(c) Built up
Available Online at www.ijpret.com 7
(e) Dense Vegetation
(f) Agriculture
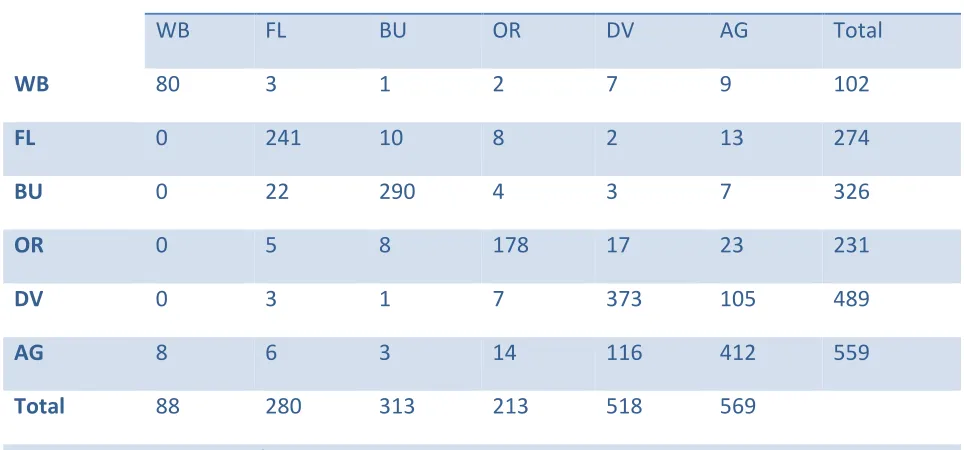
Accuracy Assessment: Accuracy assessment is used to compare the classification results with
reference data, which is assumed to be true for determining the classification results. There are many methods to analyse the accuracy of remotely sensed data [12] [13]. In this study, confusion matrix or error matrix is used [14]. Reference data has been taken during the field visit on November 8, 2014.
Available Online at www.ijpret.com 8
Class Reference
WB FL BU OR DV AG Total
WB 80 3 1 2 7 9 102
FL 0 241 10 8 2 13 274
BU 0 22 290 4 3 7 326
OR 0 5 8 178 17 23 231
DV 0 3 1 7 373 105 489
AG 8 6 3 14 116 412 559
Total 88 280 313 213 518 569
Overall Accuracy = 1574/1981=79.45
Kappa Coefficient (k)= 0.78
Where WB= Water body, FL=Fallow land, BU=Built up, OR= Orchard, DV= Dense Vegetation, AG=Agriculture.
Table 2. Confusion matrix
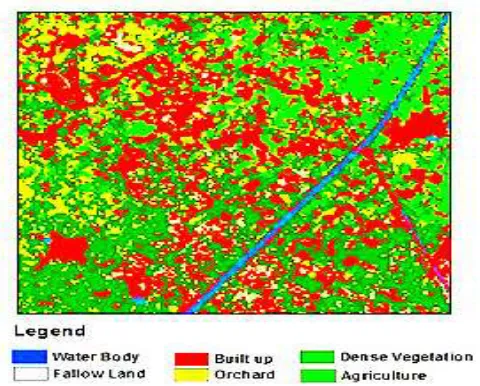
IV. RESULTS AND DISCUSSION
All pixels are classified into five groups (water body, fallow land, orchard, built up, dense vegetation and agriculture). Final classified images are depicted in Figure 4a and Figure 4b.
Available Online at www.ijpret.com 9
Figure 4b. Classified Image using SVM
V.CONCLUSION
In this paper, we have studied the SVM classification for Muzaffarnagar district on Landsat 8 OLI data. The satellite image having six major land cover classes, have been classified successfully without any pixel being unclassified. SVM appear to be especially advantageous if dealing with heterogeneous classes for which only a small number of training samples are available. The overall accuracy and kappa coefficient of 79.45% and 0.78 respectively shows that this classifier can give high classification accuracy and has high agreement between ground truth and classified data.
REFRENCES:
1. Townshend, J.R.G, “Land cover,” International Journal of Remote Sensing, 13, pp. 1319-1328, 1992.
2. Hall, F. G., Townshend, J. R., and Engman, E. T., “Status of remote sensing algorithms for estimation of land surface state parameters,” Remote Sensing of Environment, 51, pp. 138-156, 1995.
3. Wang, F., “Fuzzy supervised classification of remote sensing images,” IEEE Transactions on
Geoscience and Remote Sensing, 28, pp. 194-201, 1990.
4. Hansen, M., Dubayah, R., and DeFries, R., “Classification trees: an alternative to traditional land cover classifiers,” International Journal of Remote Sensing, 17, pp. 1075-1081, 1996.
Available Online at www.ijpret.com 10 6. Paola, J. D., and Schowengerdt, R. A., “A review and analysis of backpropagation neural networks for classification of remotely sensed multi-spectral imagery,” International Journal of
Remote Sensing, 16, pp. 3033-3058, 1995.
7. Atkinson, P. M., and Tatnall, A. R. L., “Neural networks in remote sensing,” International
Journal of Remote Sensing, 18, pp. 699-709, 1997.
8. Safavian, S. R., and Landgrebe, D., 1991, A survey of decision tree classifer methodology. IEEE Transactions on Systems, Man, and Cybernetics, 21, pp. 660-674, 1991.
9. Friedl, M. A., and Brodley, C. E., “Decision tree classification of land cover from remotely sensed data,” Remote Sensing of Environment, 61, pp. 399-409, 1997.
10. Brodley, C. E., and Utgoff, P. E., “Multivariate decision trees,” Machine Learning, 19, pp. 45-77, 1995.
11. Vapnik V, "The Nature of Statistical Learning Theory,” New York, Springer Verlag, 1995. 12. Congalton, R. G., & Green, K., “Assessing the accuracy of remotely sensed data: principles and practices,” Boca Raton: Lewis Publishers, 1999.
13. Koukoulas, S., and Blackburn, G. A., “Introducing new indices for accuracy evaluation of classified images representing semi-natural woodland environments,” Photogrammetric
Engineering and Remote Sensing, 67, pp. 499-510, 2001.
14. Foody GM, “Status of land cover classification accuracy assessment," Remote Sensing of