Organized by C.O.E.T, Akola, ISTE, New Delhi & IWWA. Available Online at www.ijpret.com133
INTERNATIONAL JOURNAL OF PURE AND
APPLIED RESEARCH IN ENGINEERING AND
TECHNOLOGY
A PATH FOR HORIZING YOUR INNOVATIVE WORK
EFFECT OF SONICATION ON COD OF INDUSTRIAL WASTE WATER
S. V. KHEDKAR, DR. N. W. INGOLE
1. Department Of Chemical Engineering College Of Engineering and Technology, NH-6, Murtizapur Road, Babhulgaon (Jh) Akola 444104, Maharashtra State.
2. Professor and Dean R & D, PRMIT & R Bandera, Amravati.
Accepted Date: 07/09/2016; Published Date: 24/09/2016
Abstract:In the recent few years ultrasound has resurfaced as a possible method for the treatment of industrial waste. The research in the area of ultrasound is increasing day by day. This can be seen easily from the number of papers published on ultrasound every year. Ultrasound is versatile and energetic method to treat industrial waste in a short duration of time with lesser costs. The method is still in its growing phase hence it’s not a process you will see in every industry. The application of the method differs with differing wastes. Still it is a method worth giving a try with respect to the simplicity, cost reduction and time reduction of treatment and finally the efficiencies obtained after treatment. Ultrasound has been tried on many industrial wastes consisting different physical and chemical compositions. It’s a most suitable method for the hazardous wastes where the volume is low and polluting power is more. The following work discusses a case study of pharmaceutical waste which has been treated by ultrasound.
Keywords: Chemical oxygen demand, oxidation, waste water, ultrasound.
.
Corresponding Author:MR.S. V. KHEDKAR
Co Author: DR. N. W. INGOLE
Access Online On:
www.ijpret.com
How to Cite This Article:
S. V. Khedkar, IJPRET, 2016; Volume 5 (2): 133-140 PAPER-QR CODE
SPECIAL ISSUE FOR
INTERNATIONAL CONFERENCE ON
Organized by C.O.E.T, Akola, ISTE, New Delhi & IWWA. Available Online at www.ijpret.com134
INTRODUCTION
Earthquakes produce low frequency infrasound before the main shock waves begin which possibly alerts the animals. Frequencies higher than 20 kHz are called ultrasonic sound or ultrasound (Uma Mukherjee 2003). Ultrasounds are high frequency waves. Ultrasounds are able to travel along well defined paths even in the presence of obstacles. Ultrasounds are used extensively in industries, medical purposes and many other applications.
Ultrasound is generally used to clean parts located in hard to reach places, for example, spiral tube, odd shaped parts, electronic components etc. Objects to be cleaned are placed in a cleaning solution and ultrasonic waves are sent through the solution. Due to high frequency, the particles of dust, grease and dirt get detached and drop out. The objects thus get thoroughly cleaned (Gandhi K. S. and Kumar R.1994).
Ultrasound can be used to detect cracks and flaws in the metal blocks. Metallic components are generally used in the construction of big structures like buildings, bridges, machines and also scientific equipment. The cracks and flaws which are invisible from the outside reduce the strength of the structure. Ultrasonic waves are allowed to pass through the metal block and detectors are used to detect transmitted waves. If there is even a small defect, the ultrasound gets reflected back indicating the presence of the flaw or defect (T. J. Mason & J.P. Lorimer 2002). In waste water treatment ultrasound is used as either a probe reactor or it is used as an ultrasonic bath (Parag R. Gogate 2002). The efficiency of the probe sonicator is better than the ultrasonic bath. The probe sonicator is used in places where process intensification is required. The ultrasonic bath maybe used in places where volume of waste is more and lesser efficiencies are required.
Organized by C.O.E.T, Akola, ISTE, New Delhi & IWWA. Available Online at www.ijpret.com135
MATERIALS AND METHODS
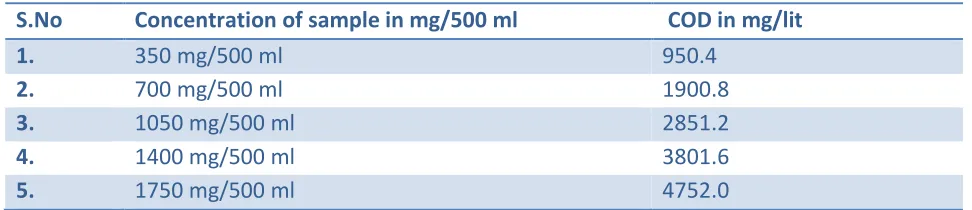
The materials used in this method are industrial waste samples having high chemical oxygen demand. The industrial waste samples were prepared (synthetic) was prepared in the laboratory for different concentrations. The concentrations of the synthetic waste sample are given in the table below. For preparing each sample 350 mg of aspirin was used in 500 ml of deionized water. Deionized water was taken for sample preparation to rule out any possible interference in the water.
Table 1 for presonication chemical oxygen demand for all concentrations of sample
S.No Concentration of sample in mg/500 ml COD in mg/lit
1. 350 mg/500 ml 950.4
2. 700 mg/500 ml 1900.8
3. 1050 mg/500 ml 2851.2
4. 1400 mg/500 ml 3801.6
5. 1750 mg/500 ml 4752.0
The method used for the treatment of the synthetic prepared sample was probe sonication method. This is a batch method and used to carry out study on small scale. The synthetic waste of different concentration was treated for different times at constant amplitude of 100. The amplitude of 100 was chosen because maximum energy dissipation in the synthetic waste takes place at this amplitude. The timings of sonication were 15, 30, 45, 60, and 75 for concentration of 350 mg/500 ml, 700 mg/500 ml, 1050 mg/500 ml, 1400 mg/500 ml and 1750 mg/500 ml respectively. The probe sonicator processor was operated in a continuous mode. The presonication COD was analyzed for each sample and is reported in table 1 above. The post sonication COD was analyzed for each sample after the sonication time as stated above was over. The % COD reduction was plotted against time.
RESULT AND DISCUSSION
Organized by C.O.E.T, Akola, ISTE, New Delhi & IWWA. Available Online at www.ijpret.com136
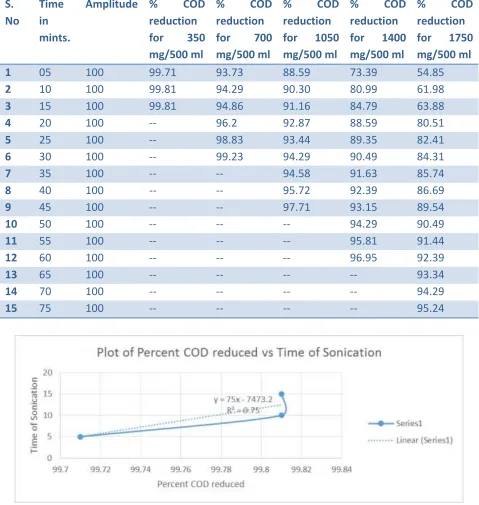
Table 2 for post sonication chemical oxygen demand % reduction with sonication time for all concentrations of sample
S. No
Time in mints.
Amplitude % COD
reduction
for 350
mg/500 ml
% COD
reduction
for 700
mg/500 ml
% COD
reduction
for 1050
mg/500 ml
% COD
reduction
for 1400
mg/500 ml
% COD
reduction
for 1750
mg/500 ml
1 05 100 99.71 93.73 88.59 73.39 54.85
2 10 100 99.81 94.29 90.30 80.99 61.98
3 15 100 99.81 94.86 91.16 84.79 63.88
4 20 100 -- 96.2 92.87 88.59 80.51
5 25 100 -- 98.83 93.44 89.35 82.41
6 30 100 -- 99.23 94.29 90.49 84.31
7 35 100 -- -- 94.58 91.63 85.74
8 40 100 -- -- 95.72 92.39 86.69
9 45 100 -- -- 97.71 93.15 89.54
10 50 100 -- -- -- 94.29 90.49
11 55 100 -- -- -- 95.81 91.44
12 60 100 -- -- -- 96.95 92.39
13 65 100 -- -- -- -- 93.34
14 70 100 -- -- -- -- 94.29
15 75 100 -- -- -- -- 95.24
Organized by C.O.E.T, Akola, ISTE, New Delhi & IWWA. Available Online at www.ijpret.com137
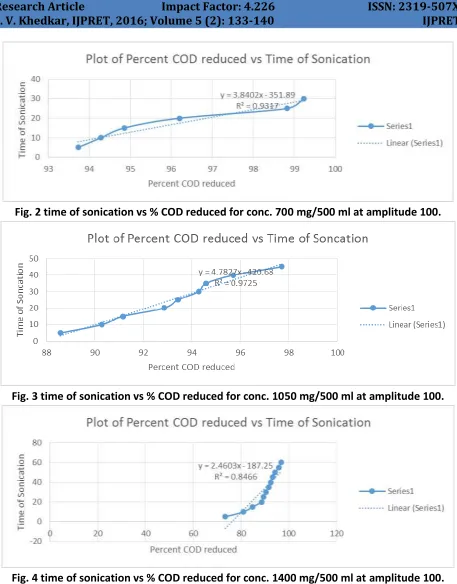
Fig. 2 time of sonication vs % COD reduced for conc. 700 mg/500 ml at amplitude 100.
Fig. 3 time of sonication vs % COD reduced for conc. 1050 mg/500 ml at amplitude 100.
Organized by C.O.E.T, Akola, ISTE, New Delhi & IWWA. Available Online at www.ijpret.com138
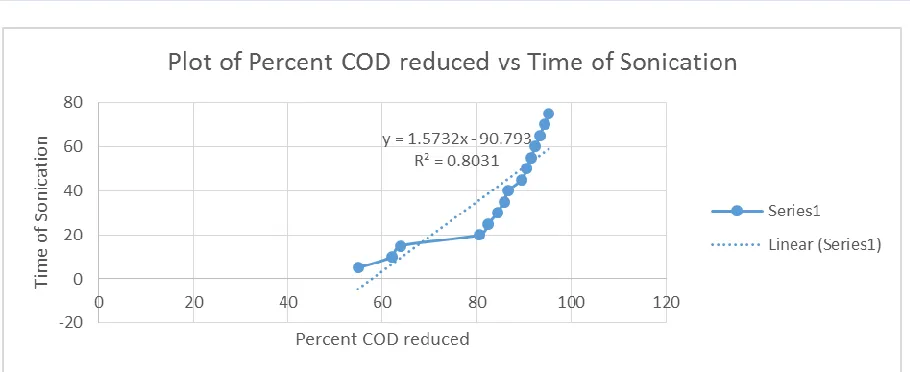
Fig. 5 time of sonication vs % COD reduced for conc. 1750 mg/500 ml at amplitude 100.
RESULT AND DISCUSSION
The table 2 above shows the % reduced COD for concentrations shown in the table. It is seen that the % of COD reduced is almost same irrespective of the concentration. The reduction of COD does not follow the same path but final reduced values are almost same. This may be possible because of experimental conditions. The experimentation shows there is huge reduction in COD within a short span of time hence sonication seems to be a good method for such types of wastes.
CONCLUSION
The industrial wastes especially hazardous industrial wastes which are smaller in volume and higher in strength can be successfully treated. The results may vary from case to case but most of wastes tried and tested have shown positive result for the ultrasonic waste. The method can be implemented for high strength wastes. The figures show there is good inter relationship between the factors studied. The R2 value is above 0.74 for all figs.
ACKNOWLEDGEMENT
Organized by C.O.E.T, Akola, ISTE, New Delhi & IWWA. Available Online at www.ijpret.com139
REFERENCES
1. Aharon Gedanken 2003., Sonochemistry and its application to nanochemistry, Current Science, Vol. 85, No. 12, 25 December 2003pp 1720-1722.
2. A.S. Stasinakis, Use Of Selected Advanced Oxidation Processes (Aops) For Wastewater Treatment – A Mini Review, Global Nest Journal, Vol 10, No 3, pp 376-385, 2008.
3. Aniruddha B. Pandit et al.2001. Ultrasonic degradation of 2:4:6 trichlorophenol in presence of TiO2 catalyst, Ultrasonics sonochemistry 8(2001) 237-241.
4. Edaoin M. Joyce and T.J.Mason 2008, Sonication Used as a biocide, A review: Ultrasound a greener alternative to chemical biocides, Chemistry Today vol 26, n6, pp 22-26.
5. Gandhi K. S. And Kumar R.1994, Sonochemical Reaction Engineering, Sadhana, Vol 19, part 6, December 1994, pp 1055-1076.
6. Gogate Parag R. 2007. Application of Cavitational Reactors For Water Disinfection Current Status And Path Forward, Journal Of Environment Management 85(2007) 801-815.
7. Inez Hua et al 2001. Ultrasonic irradiation of Carbofuran decomposition kinetics and characterization, wat. Res. 35 No 6 pp 1445- 1552.
8. José González - García et.al 2010. , Sonochemical Treatment of Water Polluted by Chlorinated Organo compounds. A Review, Water 2010, 2, 28-74; doi:10.3390/w 2010028 9. Jin Ho Bang And Kenneth S. Suslick, 2010, Applications of Ultrasound to the Synthesis of Nano Structured Materials, Advanced Materials 2010, 22, pp 1039-1059.
10. Khay Chuan Teo et. Al., 2001.,Sonochemical Degradation Of Toxic Halogenated
Compounds, Ultrasonics Sonochemistry 8 (2001) 241-246.pp-
11. Khedkar S.V., Ingole. N.W. and 2012, The Ultrasound Reactor Technology-A Technology For Future, Khedkar et al, International Journal of Advanced Engineering Research and Studies, IJAERS/Vol. II/ Issue I/Oct.-Dec.,2012/72-75, E-ISSN2249–8974,pp
12. Mason T.J. and Lorimer J.P. 2002, Applied Sonochemistry: Uses of power ultrasound in Chemistry and Processing. Wiley – VCH Verlag GmbH & Co. KGaA. ISBNs: 3-527-30205-0 (Hardback); 3-527-60054-x (Electronic).
13. Maria Papadaki, Richard J.Emery, Mohd A. Abu – Hassan , Alex Diaz – Bustos, Ian S. Metcalfe , Dionissios Mantzavinos -2004, Sonocatalytic Oxidation Processes Of Contaminants containing Aromatic Rings From Aqueous Effluents, Seperation and Purifation Technology 34 (2004) 35-42.
14. Parag R. Gogate 2002, Cavitation: an auxiliary technique in wastewater treatment schemes Advances in Environmental Research (6) 2002. 335-358.