Design and performance evaluation of a variable-rate orchard sprayer
based on a laser-scanning sensor
Jichen Cai
1,2,3,4,
Xiu Wang
2,3,4,
Yuanyuan Gao
1,2,3,4,
Shuo Yang
1,2,3,4,
Chunjiang Zhao
1,2,3,4*(1. College of Information and Electrical Engineering, China Agricultural University, Beijing 100083, China; 2. National Research Center of Intelligent Equipment for Agriculture, Beijing 100097, China;
3. Key Laboratory of Agri-informatics, Ministry of Agriculture, Beijing 100097, China; 4. Beijing Key Laboratory of Intelligent Equipment Technology for Agriculture, Beijing 100097, China)
Abstract: To improve the precision spraying strategy and reduce excessive pesticide application in orchards, an air-assisted sprayer integrated with a laser-scanning system was developed to realize the toward-target variable-rate spraying. In the spray control system, a method of calculating canopy gridding volumes was designed to ensure that the canopy was divided into a uniform grid size, a variable-rate spray model was used in the flow rate decision software to control the spray output according to the canopy gridding volumes and travel speed, and a method of saving and accessing spray data was used to control the spray delay. The effects of different grid sizes and travel speeds on the spray performance were evaluated by quantifying spray coverage uniformity inside tree canopies. The results showed that spray coverage uniformity declined with increasing grid width from 0.14 to 0.28 m although the mean spray coverage on each target location showed no significant differences. Additionally, there were no significant variations in mean spray coverage at speeds of 1.0, 1.2 and 1.4 m/s for a tested tree of 1.6 m width and at any experimental speeds for a tested tree of 1.3 m width, which indicated that the variable-rate sprayer could provide good spray coverage uniformity under various travel speeds with a canopy size limitation. Compared with the same sprayer without the variable-rate spray function, the intelligent sprayer prototype realized effective toward-target spraying and avoided overspraying while providing sufficient spray coverage.
Keywords: laser-scanning sensor, variable-rate spray, orchard, precision sprayer, pesticide application efficiency
DOI: 10.25165/j.ijabe.20191206.4174
Citation: Cai J C, Wang X, Gao Y Y, Yang S, Zhao C J. Design and performance evaluation of a variable-rate orchard sprayer based on a laser-scanning sensor. Int J Agric & Biol Eng, 2019; 12(6): 51–57.
1 Introduction
Excessive pesticide usage in orchards caused by overspraying[1-3] increases production costs and environmental pollution. With the development of variable-rate application technology[4], which is widely used in precision agriculture[5], the goal of precision spraying for tree protection to decrease the chemical dosage while providing effective pest control can be achieved[6,7]. Using a variable-rate spray system[8], compared with conventional constant-rate sprayers, is an effective method to reduce pesticide application in orchards.
In recent years, several variable-rate sprayer prototypes[9-11] integrated with laser-scanning sensors have been developed and evaluated in orchard experiments. Chen et al. first placed a laser scanning sensor into an air-assisted variable-rate sprayer in 2011[3,12,13], and realized canopy structure detection and variable-rate spray application on one side. However, the spray
Received date: 2018-02-09 Accepted date: 2019-09-04
Biographies: Jichen Cai, PhD candidate, research interests: intelligent equipment for agriculture, Email: [email protected]; Xiu Wang, PhD, Professor, research interests: intelligent equipment for fertilizer and pesticide on agriculture, Email: [email protected]; Yuanyuan Gao, PhD candidate, research interests: intelligent equipment for agriculture, Email: [email protected]; Shuo Yang, PhD candidate, research interests: intelligent equipment for agriculture. Email: [email protected].
*Corresponding Author: Chunjiang Zhao, PhD, Professor, CAE Academician,
majored in agricultural information technology. Beijing Research Center of Intelligent Equipment for Agriculture, Beijing 100097, China. Email: [email protected].
volume could not adapt to match changes in travel speed. Liu et al.[14,15] integrated a 270° wide-range laser sensor and a travel speed sensor into an intelligent sprayer to detect trees on both sides. Test results indicated the sprayer was able to reduce pesticide use by more than 50% compared with the constant-rate application. With the improvement of the sprayer, a large number of orchard experiments comparing against conventional spray application were conducted by Zhu et al.[16] The results showed that the laser-guided sprayer used less pesticide than conventional constant-rate sprayers and still achieved comparable levels of pest control, which demonstrated the practicability of variable-rate spraying based on laser sensor detection. However, because the scanning period of the laser-scanning sensor was used to calculate the spray width and the spray delay time compensation, the calculation accuracy would be affected by the sprayer travel speed[17-19], as would the calculation accuracy of the nozzle flow rates and the control accuracy for spray delay. Li et al.[20] developed a laser-scanning variable-rate orchard sprayer to achieve automatic profiling for spray application. The prototype integrated solenoid valves and brushless fans to control the flow rates and air volumes simultaneously based on the canopy volume. The experiment was conducted under a 0.8 m/s travel speed and the results showed that the control of air volume improved the spray coverage uniformity on the backs of trees, and the minimum number of droplets was 46.2 per cm2. However, the influence of variable travel speed on the spray deposition[13] or droplet density was not mentioned.
control still need to be developed to improve the precision spraying strategy. Additionally, the spraying accuracy still needs to be evaluated when a laser-guided and variable-rate spray control system is integrated into a traditional sprayer. The objective of this research was to develop an algorithm for canopy gridding volumes and nozzle flow rates and a method of spray delay control to realize toward-target[11] variable-rate spraying and to validate the sprayer performance by analyzing spray coverage uniformity inside tree canopies under various canopy grid sizes and travel speeds.
2 Materials and methods
2.1 Canopy grid model
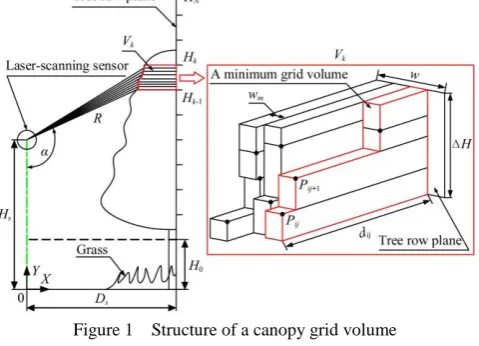
A tree canopy can be uniformly divided into several height ranges in the vertical direction. As shown in Figure 1, a group of data points (Pij, Pij+1, et al.) is formed when laser beams are projected onto a tree canopy in one scan. The distance (dij) to the tree row plane and the height (hij) of every data point can be calculated according to the angle of every measurement in the Cartesian coordinate system. The procedure for measurement data preprocessing[22] includes eliminating unneeded data beyond the tree row plane and rearranging measurement data in order of height. Then, every data point is distributed into a certain height range (from Hk−1 to Hk) according to its height value. After that, a volume of point-based geometry in a height range (ΔH), defined as the minimum grid volume, can be calculated when the laser-scanning sensor moves forward and scans at a certain distance (wm) every time. Thus, a grid volume comprising a certain number of minimum grid volumes can be acquired with a certain height (ΔH) and width (wm). In addition, to avoid a large result, boundary values of the height range need to be eliminated in the minimum grid volume calculation if the canopy grid is in the edge area. The advantage of this method for calculating gridding volumes is that the size of the grid width (W) is not affected by the travel speed of the laser-scanning sensor. Therefore, the effect of travel speed on the grid volume calculation precision can be eliminated.
Figure 1 Structure of a canopy grid volume
The formulas for calculating the canopy grid volume (Vk) are:
1 1
1 1
1 1 1
)
(
[( ) (
) ] ( [1, ])
m n
k ij ij m ij k in m in
i j
i k m i
V h h w d a H h w d
b h H w d k N
(1)1
cos ( [ , ])
ij s ij ij ij k k
h H R α h H H (2) sin ( [0, ))
ij s ij ij ij s
d D R α d D (3)
0,( 0, 1 0) 1
k k
N N
a
(4)
0,( 1 0, 0) 1
k k
N N
b
(5)
where, k is the index of the canopy grid in the vertical direction; N is the number of canopy grids in the vertical direction; i is the index of the minimum grid in a canopy grid; m is the number of minimum grids included in a canopy grid; j is the index of the data point; n is the number of data points in a minimum grid; hij is the height of an individual data point Pij, mm; wm is the width of the minimum canopy grid, mm; dij is the depth of data point Pij, mm; Hk is the height of the upper edge of the canopy grid k, mm; Hs is the height of the laser-scanning sensor, mm; Ds is the distance between the laser-scanning sensor and the tree row plane, mm; Rij is the measurement data for data point Pij, mm; αij is the vertical angle of the laser beam ij, (°); ΔH is the height of a canopy grid, mm. Nk is the number of data points from one scan in canopy grid k; and a and b are the discriminant factors of the upper and lower edges of the canopy grid, respectively.
The minimum grid width can be determined according to the sprayer’s working speed range (0.8-2.0 m/s) and the control frequency (10 Hz in this study) of the pulse width modulation (PWM), which was set to 0.07 m in this study. Therefore, the variable-rate control system can achieve a regular canopy grid width by setting the canopy grid width as an integer multiple of the minimum grid width.
2.2 Variable-rate spray model
To realize variable-rate spraying, the spray output from a nozzle needs to match the canopy grid volume as the nozzle passes the canopy grid. According to the calculation formula for the nozzle flow rate, the required flow rate (q, L/min) for the corresponding nozzle is:
60 60 Δ
k
Q u V
q
t m t
(6) where, Q is the required spray volume, L; t is the time needed to pass a canopy grid; ∆t is the time needed to pass a minimum canopy grid, s; and u is the amount of liquid required to treat a unit of tree canopy volume, L/m3. In this study, the spray rate was set at 0.1 L/m3 as recommended for orchards[3,20].
The nozzle flow rate was adjusted based on the PWM control. The relationship between the nozzle flow rate and the duty cycle for controlling the solenoid valve[23] was obtained from a calibration measured flow rates under different duty cycles. The PWM duty cycle for adjusting the flow rate was limited to between 10% and 60% to obtain a linear relationship because of the tested nozzle flow characteristics. The flow rates from all nozzles were averaged to obtain linear regression constants at 600 kPa spray pressure and 10 Hz frequency:
q = 1.6X + 0.44 (7) where, q is the flow rate of the sprayer nozzles, L/min; and X is the duty cycle of the PWM signal, %.
The required duty cycle to ensure the nozzles discharge the amount of spray needed to match the canopy gridding volumes and the time spent passing each canopy grid can be determined by combining Equations (6) and (7):
60 0.44 1.6
k
u V t
X
t
(8)
2.3 Sprayer control system design
1. Onboard computer 2. Laser-scanning sensor 3. Microcontroller and flow rate control units 4. Nozzles 5. Solenoid valves 6. Speed measuring device
Figure 2 Sprayer control system integrated into the variable-rate sprayer prototype
The laser-scanning sensor was mounted above the ground and in the centerline between the sprayer and the tractor, and tuned to send data from 541 measurements in a 270° radial range at 0.5° angular resolution. It was used to collect tree canopy profile data on both sides once whenever the onboard computer accessed it through an Ethernet interface.
The speed-measuring device[24] consisted of an inductance near-switch, which was mounted on the suspension of the sprayer, and a coding plate, which was mounted on a sprayer wheel. It generated and sent pulse signals to the microcontroller when the sprayer moved forward. Whenever it collected a certain number of pulse signals, the microcontroller would send a scanning trigger signal to the onboard computer. Therefore, the minimum canopy grid width could be determined by the distance that the sprayer moved forward between two scanning trigger signals.
The onboard computer (Figure 3), which worked as the main processor for the variable-rate control system, was used to acquire scanning trigger signals and measurement data, calculate and store the canopy gridding volumes and corresponding flow rates, generate the spray data, and release the spray data to the microcontroller continuously.
Figure 3 Structural diagram of the spray control system
The spray data comprised the required duty cycles for each nozzle according to the variable-rate spray model. When it received a set of spray data, the microcontroller would separate the spray data into pieces and then send each piece to the flow rate control units through a CAN bus. The flow rate control unit was a compact design with an integrated microprocessor (STM32F103ZET6) and a multichannel solid state relay module for varying the flow rates of five nozzles simultaneously through 10 Hz PWM-controlled solenoid valves. All solenoid valves were powered independently by a 12 VDC tractor battery to avoid other
electronic devices suffering from a sudden power failure or surge[25,26].
2.4 Method of spray delay control
Each set of calculated spray data needed to be saved before it was sent out to control the flow rates of the nozzles at the target spray position because the laser-scanning sensor was mounted in front of the nozzles at a certain distance. To realize the spray delay control function, two message queues were used to save the scan positions of the laser-scanning sensor and the spray data, respectively. The discriminant for judging when the nozzles had arrived at their corresponding spray positions is:
lc–lq> L (9) where, L is the distance between the laser-scanning sensor and the nozzles, mm; lc is the variable of the current scan position of the laser-scanning sensor, mm; and lq is the first data set in the position message queue.
The procedure for the spray delay control method was: when the onboard computer received a scanning trigger signal from the microcontroller, a set of minimum canopy grid volumes was calculated. Upon finishing a set of canopy grid volume calculations, lc would add a grid width and be saved as the last data into the position message queue. A set of spray data was calculated and saved as the last data set into the spray message queue simultaneously. Then, the discriminant (9) would be executed. If the difference between lc and lqwas greater than L, lq was removed from the position message queue. Meanwhile, the first data set in the spray message queue was taken out and sent to the microcontroller. The advantage of this method for toward-target spraying is that the delay time for sending each set of spray data is not affected by the travel speed of the sprayer. Consequently, the stability of the control system is improved.
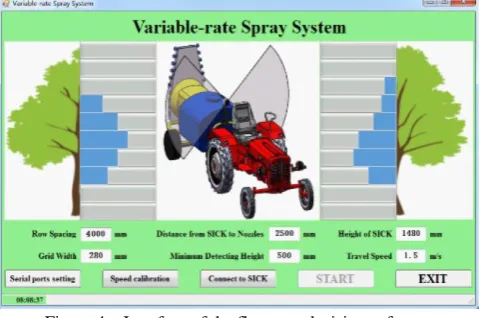
2.5 Software based on the visual C# program
The flow rate decision software[27] (Figure 4) was developed and installed on the onboard computer to calculate individual flow rates for all nozzles depending on the variable-rate spray model in real-time.
Figure 4 Interface of the flow rate decision software
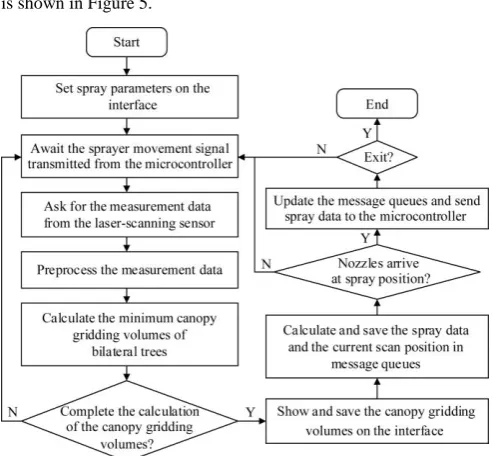
interface in real real-time. The program flowchart of the software is shown in Figure 5.
Figure 5 Program flowchart of the flow rate decision software
To determine the relationship between the pulse signal and the scanning trigger signal, the speed-measuring device needs to be calibrated according to the following procedures before spray application. Firstly, a distance for calibration (e.g. 100 m) needs to be set on the software interface. Then, the microcontroller collects pulse signals when the sprayer moves forward. Finally, the number of pulse signals is shown on a child window of the interface after the calibration ends. After that, the number of pulse signals collected to send one scanning trigger signal can be modified from the software to the microcontroller. The relationship between the minimum grid width and the number of pulse signals (np) collected for one scanning trigger signal is:
p p m
N w
n D
(10)
where, D is the travel distance for calibration, m; and Np is the number of total pulse signals accumulated during the calibration.
In addition, the sprayer travel speed (v, m/s) is acquired by counting the time interval between two scanning trigger signals in the software, as shown below:
v wm t
(11)
2.6 Sprayer system construction
The variable-rate sprayer was retrofitted based on the “3WG-1200A” trailed air blast sprayer (Nantong Huanghai Chemical Machinery CO., TLD, China) whose overall dimensions were 3×1.3×1.5 m. The major components at the base of the spray system were a 1200 L spray tank, a diaphragm pump (rated speed was 600 r/min) and an axial flow fan, which was mounted in a 2.2 m high spray tower. The sprayer was fitted with 10 hollow-cone nozzles placed 20 cm apart along a slot outlet on each side. Each nozzle was connected to a solenoid valve through a liquid pipe.
As shown in Figure 6, to realize toward-target spraying, each nozzle needs to correspond to one canopy grid in the vertical direction and is installed at a certain angle[28]. When the tree row spacing and the height of the canopy grids changed, the install angle of each nozzle needed to be adjusted before the pesticide application.
Figure 6 Nozzle positions and install angles
The install angle of each nozzle is:
0
2 1
2 1 2
n
S n
n
H H H
β arctan
D L
(12)
where, β is the angle of nozzle orientation in relation to the horizontal level, °; n is the index of the nozzles; H0 is the height of the first canopy grid lower edge, and the minimum detection height, m; Hn is the height of nozzle n above the ground, m; Ln is the distance between two nozzles installed at the same height, m; ΔH is the height of the canopy grid, m.
The diameter of the axial fan was 0.67 m, the rated speed was 1800 r/min, and the airflow[29] velocity of the slot outlet was faster than 23 m/s when the rotation speed of the axial flow fan was 540 r/min to ensure spray droplets entered the tree canopies. During spray application, the sprayer was pulled by a tractor with a standard three-point hitch, and the tractor PTO-driven system was used to power the diaphragm pump and the axial flow fan simultaneously. The axial flow fan propelled air toward a bulkhead[30] and then turned the airflow 90° through the slot outlet[31,32]. The pesticide was directed from the diaphragm pump into the splitter and then directed into the nozzles through solenoid valves and liquid pipes. The 10 nozzles on each side could be activated by individual solenoid valves to discharge spray clouds to cover a tree canopy height up to 3 m.
2.7 Field experiments
Spray tests were conducted in an experimental orchard in early autumn (September 6, 2017) at the National Experiment Station for Precision Agriculture located in Changping, Beijing, China, at 40°
10′31″ N and 116°26′10″ E. Weather conditions during the field tests were an average wind velocity of 3.8 m/s from the Southwest, an ambient temperature of 8.5°C, and relative humidity of 56%.
The grid width was set at 0.14, 0.21 and 0.28 m. Travel speeds ranged from 1.0 to 1.8 m/s, and each test was repeated three times.
1. Tree 1 2. Tree 2 3.Tree 3 4. Poles between trees 5. Water-sensitive paper Figure 7 Trees and WSP positions for testing the sprayer
performance
The performance of the variable-rate application was also compared with the same sprayer model without the variable-rate spray function. Only one side of each sprayer was used to discharge water-only spray onto the target tree row. The rotation speed of the axial flow fans was 540 r/min and the diaphragm pumps were operated at 600 kPa. The flow rate of the nozzles without PWM control was 1.4 L/min. Water-sensitive paper (30 × 75 mm, WSP) was fixed on the leaves to determine the droplet coverage at different locations inside each tree canopy. The locations of the WSP are shown in Figure 7 including the top, bottom, left, right, front, middle and back of each tree. In addition, WSP was also set at different heights between trees to test off-target losses[13] in the spaces between the trees.
A portable scanner (TSN450, Sky Light Electronic Limited, Shenzhen) was used to acquire images of the spray deposits on each WSP with 1200 dpi imaging resolution. The spray coverage (% area of the WSP covered by spray deposits) was estimated from the scanned images using the iDAS droplet coverage image processing system[34], which analyzed the deposition density, droplet diameter distribution, coverage uniformity and application rate of spray quality.
3 Results and discussion
The mean spray coverage of each target location inside tree 1 under different grid widths compared with the constant-rate application is shown in Figure 8. It was tested at a travel speed of 1.0 m/s.
Figure 8 Comparison of mean spray coverage at different grids between the variable-rate sprayer and the constant-rate sprayer for
tree 1
The mean spray coverage on the front, middle and back target locations of the tree were reduced because the front target location was closest to the nozzles and the branches and leaves of the tree blocked some of the spray droplets from reaching the middle and back locations[20]. The coverage in these locations could be improved by increasing the rotation speed of the sprayer axial flow fan. The mean spray coverage on the top, bottom, left and right locations were less than that on the front, indicating that the amount of spray output corresponding to these locations matched the canopy gridding volumes.
The mean spray coverage on all target locations was less than with constant-rate application, especially in the spaces between trees, demonstrating that the use of the laser sensor was an effective way to avoid overspraying while providing sufficient spray coverage and to realize on-target spraying[11] with high accuracy. The spray coverage in the spaces between trees was mainly because of droplet drift[13] and spray delay error[17,24].
The results also showed that the mean spray coverage of each target location was not significantly different when the grid width increased. However, the standard deviation of the mean spray coverage increased, which illustrated that the spray coverage uniformity decreased with a larger grid width. This was mainly because each target location was distributed in a different grid during each test and the nozzle flow rate changed with a longer distance. Additionally, the spray control system did not work properly at high travel speed (≥1.2 m/s) if the grid width was set too small (≤0.14 m) because the control system and solenoid valves had insufficient response time to process the spray data and actuate the nozzles, respectively, although it had better spray coverage uniformity. Consequently, the grid width needed to be set depending on the sprayer’s working speed.
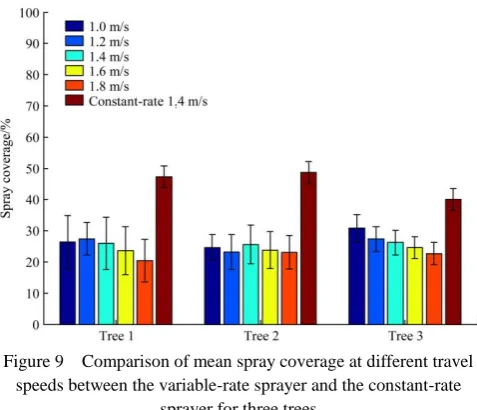
Figure 9 Comparison of mean spray coverage at different travel speeds between the variable-rate sprayer and the constant-rate
sprayer for three trees
duty cycle was limited to 60% in the sprayer operation as mentioned above. For tree 3, the mean spray coverage on the middle and back target locations obviously decreased with increasing travel speed because of its relatively dense foliage and large size. This problem could be solved by increasing the spray pressure or using a larger capacity nozzle[3] to improve the effectiveness of the variable-rate application.
These results indicated that the travel speed did not significantly affect the spray coverage uniformity inside the trees for the variable-rate application when the tree canopy was in a certain size range. Compared with overspraying by constant-rate application, the variable-rate sprayer could effectively reduce the amount of spraying needed.
4 Conclusions
An intelligent sprayer prototype integrated with a laser-scanning system was developed to realize the variable-rate pesticide application depending on canopy gridding volumes and travel speed. Additionally, a method of storing and accessing spray data in a message queue was designed to realize toward-target spraying. The spray coverage uniformity inside tree canopies was evaluated at different canopy grid sizes and travel speeds.
When the travel speed was 1.0 m/s, the mean spray coverage on each target location showed no significant difference with increasing grid width from 0.14 to 0.28 m, but the spray coverage uniformity was reduced. Consequently, the canopy grid size needed to be selected according to the sprayer’s work speed. The mean spray coverage of the small-sized tree canopy (tree 2) exhibited little variation at different speeds. However, the required spray output to match the canopy gridding volumes for tree 1 from 1.4 to 1.8 m/s, and for tree 3 at all experimental speeds was outside of the adjustable flow rate range for the tested nozzles when the spray pressure was 0.6 MPa. Additionally, the mean spray coverage on the front, middle and back target locations inside the tree canopies were reduced. These problems could be improved by increasing the spray pressure and rotation speed of the axial flow fan or using a larger capacity nozzle. Furthermore, the working speed should be limited to a reasonable range to ensure the effectiveness of the variable-rate application.
Generally, in comparison with the constant-rate application, the variable-rate sprayer was able to provide good spray coverage uniformity under various travel speeds with a canopy size limitation, reduce off-target losses and avoid overspraying while providing sufficient spray coverage. Further evaluation of the performance of the sprayer for trees at different growth stages and comparisons with other sensor-based variable-rate application systems will be conducted in future studies.
Acknowledgements
This study was financially supported by the National Key Research and Development Program (2016YFD0200700).
[References]
[1] Llorens J, Gil E, Llop, J, Escolà A. Variable rate dosing in precision viticulture: use of electronic devices to improve application efficiency. Crop Protection, 2010; 29(3): 239–248.
[2] Sun H, Li M Z, Zhang Q, Detection system of smart sprayers: Status, challenges, and perspectives. Int J Agric & Biol Eng, 2012; 5(3): 10–23. [3] Chen Y, Zhu H, Ozkan H E. Development of variable-rate sprayer with
laser scanning sensor to synchronize spray outputs to tree structures.
Transactions of the ASABE, 2012; 55(3): 773–781.
[4] Hassen N S, Sidik N A C, Sheriff J M. Advanced techniques for reducing spray losses in agrochemical application system. Life Sci J, 2014; 11(3): 56–66.
[5] Li M, Chen S, Liu F, Zhao L, Xue Q, Wang H. A risk management system for meteorological disasters of solar greenhouse vegetables. Precision Agriculture, 2017; (3): 1–14.
[6] Gil E, Arnó J, Llorens J, Sanz R, Llop J, Rosell J R, Gallart M, Escola A. Advanced technologies for the improvement of spray application techniques in Spanish Viticulture: An overview. Sensors, 2014; 14(1): 691–708.
[7] Berk P, Hocevar M, Stajnko D, Belsak A. Development of alternative plant protection product application techniques in orchards, based on measurement sensing systems: A review. Computers & Electronics in Agriculture, 2016; 124: 273–288.
[8] Song Y, Sun H, Li M Z, Zhang Q. Technology application of smart spray in agriculture: a review. Intelligent Automation & Soft Computing, 2015; 21(3): 319–333.
[9] Jeon H Y, Zhu H. Development of a variable-rate sprayer for nursery liner applications. Transactions of the ASABE, 2012; 55(1): 303–312. [10] Wang Y X, Xu S S, Li W B, Kang F, Zheng Y J. Identification and
location of grapevine sucker based on information fusion of 2D laser scanner and machine vision. Int J Agric & Biol Eng, 2017; 10(2): 84–93. [11] M Hočevar, B Širok, V Jejčič, T Godeša, M Lešnika, Stajnko D. Design
and testing of an automated system for targeted spraying in orchards. Journal of Plant Diseases & Protection, 2010; 117(2): 71–79.
[12] Chen Y, Ozkan H E, Derksen R C, Krause C R. Spray deposition inside tree canopies from a newly developed variable-rate air-assisted sprayer. Transactions of the ASABE, 2013; 56(6): 1263–1272.
[13] Chen Y, Zhu H, Ozkan H E, Derksen R C, Krause C R. Spray drift and off-target loss reductions with a precision air-assisted sprayer. Transactions of the ASABE, 2013; 56(6): 1273–1281.
[14] Liu H, Zhu H, Shen Y, Chen Y, Ozkan H E. Development of digital flow control system for multi-channel variable-rate sprayers. Transactions of the ASABE, 2014; 57(1): 273–281.
[15] Liu H, Zhu H. Evaluation of a laser scanning sensor in detection of complex-shaped targets for variable-rate sprayer development. Transactions of the ASABE, 2016; 59(5): 1181–1192.
[16] Zhu H, Rosetta R, Reding M E, Zondag R H, Ranger C M, Canas L, et al. Validation of a laser-guided variable-rate sprayer for managing insects in ornamental nurseries. Transactions of the ASABE, 2017; 60(2): 337–345. [17] Maleki M R, Ramon H, Baerdemaeker J D, Mouazen A M. A study on the time response of a soil sensor-based variable rate granular fertilizer applicator. Biosystems Engineering, 2008; 100(2): 160–166.
[18] Wei X, Dan Z, Sun H, Zhang J. Development of vehicular embedded information processing system for map-based precision farming. Transactions of the CSAE, 2013; 29(6): 142–149. (in Chinese)
[19] Chen M, Shi Y, Wang X, Sun G, Li Y. Design and experiment of variable rate fertilizer applicator based on crop canopy spectral reflectance. Transactions of the CSAM, 2015; 46(5): 26–32. (in Chinese)
[20] Li L L, He X K, Song J L, Wang X N, Jia X M, Liu C H. Design and experiment of automatic profiling orchard sprayer based on variable air volume and flow rate. Transactions of the CSAE, 2017; 33(1): 70–76. (in Chinese)
[21] Sanz R, Rosell J R, Llorens J, Gil E, Planas S. Relationship between tree row LIDAR-volume and leaf area density for fruit orchards and vineyards obtained with a LIDAR 3D Dynamic Measurement System. Agricultural & Forest Meteorology, 2013; 171-172(3): 153–162.
[22] Cai J C, Wang X, Song J, Wang S L, Yang S, Zhao C J. Development of real-time laser-scanning system to detect tree canopy characteristics for variable-rate pesticide application. Int J Agric & Biol Eng, 2017; 10(6): 1–9.
[23] Zaman Q U, Esau T J, Schumann A W, Perciva D C, Chang Y K, Scott M R. Development of prototype automated variable rate sprayer for real-time spot-application of agrochemicals in wild blueberry fields. Computers and Electronics in Agriculture, 2011; 76(2): 175–182. [24] Cai J C, Wang X, Wang S L, Yang S, Zhao C J. Research on spray delay
control of a variable-rate orchard sprayer based on a laser-scanning system. ASABE Annual International Meeting, 2017; Paper No. 1700604. [25] Shi Y, Wu T C, Cai M L, Wang Y X, Xu W Q. Energy conversion
[26] Shi, Yan, et al. Power characteristics of a new kind of air‐powered vehicle. International Journal of Energy Research, 2016; 40(8): 1112–1121.
[27] Schumann A W, Zaman Q U. Software for real-time ultrasonic mapping of tree canopy size. Computers and Electronics in Agriculture, 2005; 47: 25–40.
[28] Crop protection equipment-Field measurement of spray distribution in tree and bush crops: ISO/FDIS 225522: 2007.
[29] Shuai R, Yan S, Cai M, Xu W Q. Influence of airway secretion on airflow dynamics of mechanical ventilated respiratory system. IEEE/ACM Transactions on Computational Biology and Bioinformatics (TCBB), 2018; 15(5): 1660-1668.
[30] Shi Y, Cai M. Working characteristics of two kinds of air-driven boosters. Energy Conversion & Management, 2011; 52(12): 3399–3407.
[31] Shi Y, Zhang B, Cai M L, Zhang X D. Numerical simulation of volume-controlled mechanical ventilated respiratory system with two different lungs. Int J Numer Method in Biomed Eng, 2016; e02852. [32] Ren S, Cai M L, Shi Y, Xu W Q, Zhang X D. Influence of bronchial
diameter change on the airflow dynamics based on a pressure-controlled ventilation system. International Journal for Numerical Methods in Biomedical Engineering, 2017. doi: 10.1002/cnm.2929.
[33] Khot L R, Ehsani R, Albrigo G, Larbi P A, Landers A, Campoy J. Air-assisted sprayer adapted for precision horticulture: spray patterns and deposition assessments in small-sized citrus canopies. Biosystems Engineering, 2012; 113(1): 76–85.