Ann. Geophys., 31, 1045–1059, 2013 www.ann-geophys.net/31/1045/2013/ doi:10.5194/angeo-31-1045-2013
© Author(s) 2013. CC Attribution 3.0 License.
EGU Journal Logos (RGB)
Advances in
Geosciences
Open Access
Natural Hazards
and Earth System
Sciences
Open AccessAnnales
Geophysicae
Open AccessNonlinear Processes
in Geophysics
Open AccessAtmospheric
Chemistry
and Physics
Open AccessAtmospheric
Chemistry
and Physics
Open Access DiscussionsAtmospheric
Measurement
Techniques
Open AccessAtmospheric
Measurement
Techniques
Open Access DiscussionsBiogeosciences
Open Access Open Access
Biogeosciences
Discussions
Climate
of the Past
Open Access Open Access
Climate
of the Past
Discussions
Earth System
Dynamics
Open Access Open Access
Earth System
Dynamics
DiscussionsGeoscientific
Instrumentation
Methods and
Data Systems
Open Access
Geoscientific
Instrumentation
Methods and
Data Systems
Open Access DiscussionsGeoscientific
Model Development
Open Access Open Access
Geoscientific
Model Development
DiscussionsHydrology and
Earth System
Sciences
Open AccessHydrology and
Earth System
Sciences
Open Access DiscussionsOcean Science
Open Access Open Access
Ocean Science
DiscussionsSolid Earth
Open Access Open Access
Solid Earth
DiscussionsThe Cryosphere
Open Access Open Access
The Cryosphere
DiscussionsNatural Hazards
and Earth System
Sciences
Open Access
Discussions
Dynamical processes in space: Cluster results
C. P. Escoubet1, M. G. G. T. Taylor1, A. Masson1, H. Laakso1, J. Volpp2, M. Hapgood3, and M. L. Goldstein4
1ESA/ESTEC, Noordwijk, the Netherlands 2ESA/ESOC, Darmstadt, Germany 3RAL Space/STFC, Harwell Oxford, UK 4NASA/GSFC, Greenbelt, MD, USA
Correspondence to: C. P. Escoubet ([email protected])
Received: 30 March 2013 – Accepted: 9 May 2013 – Published: 13 June 2013
Abstract. After 12 years of operations, the Cluster mission
continues to successfully fulfil its scientific objectives. The main goal of the Cluster mission, comprised of four identical spacecraft, is to study in three dimensions small-scale plasma structures in key plasma regions of the Earth’s environment: solar wind and bow shock, magnetopause, polar cusps, mag-netotail, plasmasphere and auroral zone. During the course of the mission, the relative distance between the four space-craft has been varied from 20 km to 36 000 km to study the scientific regions of interest at different scales. Since sum-mer 2005, new multi-scale constellations have been imple-mented, wherein three spacecraft (C1, C2, C3) are separated by 10 000 km, while the fourth one (C4) is at a variable dis-tance ranging between 20 km and 10 000 km from C3. Recent observations were conducted in the auroral acceleration re-gion with the spacecraft separated by 1000s km. We present highlights of the results obtained during the last 12 years on collisionless shocks, magnetopause waves, magnetotail dy-namics, plasmaspheric structures, and the auroral accelera-tion region. In addiaccelera-tion, we highlight Cluster results on un-derstanding the impact of Coronal Mass Ejections (CME) on the Earth environment. We will also present Cluster data ac-cessibility through the Cluster Science Data System (CSDS), and the Cluster Active Archive (CAA), which was imple-mented to provide a permanent and public archive of high resolution Cluster data from all instruments.
Keywords. Magnetospheric physics (Magnetospheric
con-figuration and dynamics)
1 Introduction
In the 1980s Cluster was unanimously recognised, by the sci-ence community, as the next step in magnetospheric physics after previous highly successful single and dual spacecraft missions. Among those missions, the NASA-ESA Interna-tional Sun-Earth Explorer (ISEE) 1 and ISEE 2 (Ogilvie et al., 1977, 1978) were the first to have the capability of varying the inter-spacecraft distance (from 50 to 5000 km) to analyse in detail the plasma boundaries in the equato-rial plane of the magnetosphere. In 1984, the three Active Magnetospheric Particle Tracer Explorers (AMPTE) satel-lites (Bryant et al., 1985) were launched from a single rocket; the German Ion Release Module satellite (IRM) and the United-Kingdom Satellite (UKS) were injected into the same orbit with 18RE apogee and 28◦ inclination while
the NASA Charge Composition Explorer was put closer to the Earth in an orbit with 8RE apogee and 5◦
inclina-tion. The main goal of AMPTE was to study the transport of plasma through the magnetosphere by releasing artificial plasmas (Lithium and Barium) and measuring their effect on the ambient plasma. In the 1990s, the emphasis was put on the magnetosphere at large scales and on auroral imag-ing. The missions launched were the Japanese Geotail craft (Nishida, 1994), the NASA Polar and Wind craft (Acu˜na et al., 1995) and the Russian Interball space-craft (Galeev et al., 1996) that constituted the International Solar-Terrestrial Physics (ISTP) science initiative. More re-cently, global magnetospheric imaging was performed with the NASA IMAGE mission (Burch, 2000) that included a complete suite of magnetospheric imagers (EUV, FUV, ener-getic neutral atoms and radio plasma imaging). In 2012, with the launch of the two identical Van Allen Probes (Kessel et
1046 C. P. Escoubet et al.: Dynamical processes in space: Cluster results
al., 2012) our understanding of the response of the radiation belts to solar storms will be significantly improved. All these missions were made of maximum two spacecraft at close dis-tance and, therefore, could only derive gradients of plasma parameters along the line separating the two spacecraft. They therefore could not cover the three-dimensional aspect that is an inherent property of plasma physics. This is why Cluster, unique in covering the three dimensions with four identical spacecraft, has been eagerly awaited.
The Cluster mission was first proposed by the scientific community in 1982 (Haerendel et al., 1982), following a Eu-ropean Space Agency (ESA) call for proposals for scientific missions. An assessment phase and a phase A study were conducted and Cluster was selected, together with the SO-lar and Heliospheric Observatory (SOHO), by the Science Programme Committee (SPC) in 1986; this was the first cor-nerstone (large) mission in the ESA science programme. The Cluster mission was not a straightforward development with many ups and downs along the road. To start with, since both the solar and plasma communities wanted both Clus-ter and SOHO, while budget-wise only one should have been selected, a clever way of merging both missions had to be pursued (Cavallo, 1996). A special advisory group, the So-lar Terrestrial Physics Advisory Group (STPAG) was set up, under the chairmanship of David Southwood, to propose a mission scenario that would fit into the cornerstone cost cap (at that time 400 Million Accounting Units (MAU) in 1984 economic conditions – an accounting unit was an average of ESA Member States currencies, approximately equivalent to the Euro). All elements of the two missions were reviewed, from the payload to the spacecraft and the ground segment. Many options were looked at with various configurations involving collaborations with NASA (National Aeronautics and Space Administration, USA) and IKI (Space Research Institute of the Union of Soviet Socialist Republics). After four STPAG meetings from April to October 1986, the ad-visory group recommended the so-called “option B”, includ-ing SOHO and four mini Cluster to be built by ESA. NASA participation would be substantial, with the launch and oper-ations of SOHO and the launch of one of the Cluster space-craft that would then join the other three after a first equato-rial phase. Both SOHO and Cluster payloads were descoped: SOHO lost the plasma wave instrument and got a weight re-duction on the other instruments, while the Cluster payload mass decreased from 71 to 45 kg on each spacecraft. Three of the Cluster spacecraft would be launched with the second demonstration launch of Ariane 5. The early equatorial phase with one spacecraft was later cancelled in view of the strong degradation of the instruments expected in such an orbit for one year.
After confirmation of SOHO and Cluster by SPC at the end of 1986, an Announcement of opportunity (AO) was opened by ESA in March 1987. The instrument proposals were re-viewed during the second half of 1987 and the SPC selected the Cluster and SOHO payloads in March 1988. Although
proposed by the scientists, the SOHO magnetometer and plasma analyser were not selected due to simplifications re-quired on the SOHO spacecraft (no solid boom, no stringent electromagnetic cleanliness programme and no payload to be mounted on the service module) to maximise cost reduction, as recommended by the Space Science Advisory Committee (SSAC). The first cornerstone of Horizon 2000 programme was finally approved by SPC for a cost of 484 MAU soon after.
The Cluster spacecraft development phase started in 1991 and five spacecraft (four flight models and one structural model) and 5 models of each of the 11 instruments (Ta-ble 3) were built by industry and by PI teams at various in-stitutes (Credland et al., 1997; Escoubet et al., 1997). Four years later, in mid 1995, the four spacecraft were delivered to ESA by Dornier. Cluster was moved from the second to the first demonstration launch of Ariane 5 since Cluster was ready before Artemis, a telecommunication mission planned on the first launch, and ESA needed more time to find a co-passenger to Artemis (Cavallo, 1996). The launch, orig-inally planned at the end of 1995, was delayed since the rocket was not ready and took place on 4 June 1996. Unfortu-nately due to a software specification error, the first Ariane 5 was not successful and the four spacecraft were destroyed. It was a huge shock for the scientific community and this fail-ure destroyed many years of work from hundreds of people. The Cluster community, however, never gave up and after many Science Working Team and extraordinary SPC meet-ings, a rebuild of Cluster, Cluster II, was finally approved in April 1997 (Credland and Schmidt, 1997). Industry, as well as the PI teams, took up the challenge to re-build the four Cluster spacecraft and instruments in less than 3 years. This challenge was met and the four Cluster spacecraft were successfully put into their polar orbit of 4×19.6RE, by two
Soyuz-Fregat launches from Baikonur, on 16 July and 9 Au-gust 2000 (Escoubet et al., 2001). It was, however, only when all instruments were switched-on that the Cluster community was finally relieved of its 18-year wait.
2 Cluster mission
2.1 Cluster constellations and orbit
Table 1. Cluster selected discoveries (more details at http://sci.esa. int/cluster).
Discoveries Date
First measurements of plasma density gradient in the plasmasphere
2001
Development and growth of black aurora 2001 Surface waves in the tail of the magnetosphere 2002 First measurement electric current in three dimensions 2003 Bifurcation of the tail current sheet 2003 Earth bow shock thickness linked to plasma parameter 2003 Small-scale electric field structures in the Earth bow shock
2004
Plasma vortices at the edge of the magnetosphere 2004 Spatial scale of high-speed flows in the magnetotail 2004 First direct observation of magnetic reconnection in 3-D 2004 First direct measurement of the ring current 2005 Largest reconnection line in the solar wind 2006 Fundamental 3-D properties of magnetic turbulence 2006 Magnetic null observed at the heart of reconnection 2006
Density holes in the solar wind 2006
First measurement of divergence of electron pressure tensor
2006
Magnetic reconnection in the turbulent magnetosheath 2007 Magnetic null pair in reconnection 2007 High speed flows in the magnetosphere after the impact of a CME
2007
Solitons at the border of the magnetosphere 2007 Electron trapping around a magnetic null 2008 Evolution of magnetosheath turbulence 2008 First detection of invisible ions escaping from the atmo-sphere
2009
High speed jets behind the Earth bow shock 2009 Asymmetry of the ion diffusion region 2010 Temporal evolution of auroral acceleration 2011 Super-Alfv´enic propagation of reconnection signatures 2012 Origin of the energetic particles in the polar cusp 2012 First observation of Kelvin-Helmholtz waves at high lat-itude
2012
constellation manoeuvres (Fig. 1), adjusting the spacecraft separation distances between 20 and 36 000 km, more than 3 orders of magnitude. Up to June 2005, the constellation was such that a perfect tetrahedron was formed twice along the orbit. This enabled, at the expense of a bit more fuel, to have perfect three-dimensional measurements in two separated places, the Northern cusp and the Southern magnetopause, in addition to keeping a very good three-dimensional configura-tion during most part of the orbit, through the magnetosheath and solar wind. Six months later, once the apogee was in the tail, the two tetrahedra were formed in the lobes allowing perfect three-dimensional measurements throughout the en-tire plasmasheet.
Starting in 2005, after forming a 10 000 km tetrahedron and having used 3/4 of the fuel available since the begin-ning of the mission, a more frugal approach to separate the
26 2
Figure 1.Cluster constellation from the beginning of mission up to now. The distance 3
between the spacecraft is given as a function of time: C1,C2,C3 separation distance in 4
magenta and C3,C4 in green. The distance is given at one point along the orbit defined by the 5
symbol and colour in the legend. 6
7
Fig. 1. Cluster constellation from the beginning of the mission up to now. The distance between the spacecraft is given as a function of time: C1, C2, C3 separation distance in magenta and C3, C4 in green. The distance is given at one point along the orbit defined by the symbol and colour in the legend.
spacecraft was implemented by moving them along their or-bit. This has the great advantage of using only a few hundreds grams of fuel to move the spacecraft thousands of kilometres apart as long as enough time (a few weeks) is available for the constellation to be achieved. Since spacecraft 3 (C3) was put on a very similar orbit to spacecraft 4 (C4), these two space-craft could be approached within 20 km from each other in the auroral zone in October 2011. Details of the constellation changes from the beginning of the mission in 2000 up to the end of 2013 can be found in Table 2.
The nominal orbit of Cluster was 4×19.6REwith 90◦
in-clination (Fig. 2) in winter 2001. The argument of perigee was chosen such that the exterior cusp (one of the prime tar-get of Cluster) would be crossed in the Northern Hemisphere. However due to luni-solar gravitational perturbations, the or-bit started to evolve with apogee moving toward the South-ern Hemisphere, inclination increasing and perigee altitude decreasing. In 2011, the perigee went down to 200 km alti-tude on C2 and a few 1000 km on the other spacecraft while the inclination reached a maximum of 140 degrees (Fig. 2). From mid 2011, the perigee of the spacecraft started to in-crease again and will be above 10 000 km in 2013, while the inclination is slowly decreasing again by 3 degree/year. The orbit will however never come back to its original polar in-clination. This change of orbit has allowed Cluster to visit new regions never observed before by a constellation of four spacecraft, such as the auroral acceleration region, the near-Earth plasmasheet (8–10RE) and the inner magnetosphere.
2.2 Cluster payload
The original proposed payload was significantly different from the final one, mainly because the original proposal was based on a main spacecraft with a complete payload
[image:3.595.46.287.90.495.2]1048 C. P. Escoubet et al.: Dynamical processes in space: Cluster results
Table 2. Cluster constellation changes from the beginning of the mission in 2000 to end 2013.
Date S/C separation distance (km) Date S/C separation distance (km)
C1C2C3 C3C4 C1C2C3 C3C4
Aug 2000 600 600 Apr 2009 1000 1000
Jun 2001 2000 2000 Jul 2009 10 000 500
Jan 2002 100 100 Dec 2009 1000 1000
Jun 2002 3810 3810 Jun 2010 1000 1000
Jan 2003 5000 5000 Sep 2010 5000 5000
Jun 2003 200 200 Mar 2011 5000 5000
Jan 2004 280 280 Jun 2011 5000 5000
Jun 2004 1000 1000 Oct 2011 5000 20
Nov 2004 1300 1300 Feb 2012 6000 40
Jun 2005 10 000 1000 May 2012 5000 60
Dec 2005 10 000 10 000 Aug 2012 5000 300
Jul 2006 10 000 10 000 Nov 2012 36 000 7000
Jan 2007 10 000 450 Jan 2013 3000 200
Jul 2007 10 000 40 May 2013 3300 20
Dec 2007 10 000 40 Aug 2013 3400 100
Jul 2008 10 000 3000 Nov 2013 3200 2000
Dec 2008 10 000 10 000
Table 3. The 11 instruments on each of the four Cluster spacecraft.
Instrument/Principal Investigator (current) Mass Power (kg) (W)
ASPOC (Spacecraft potential control) 1.9 2.7 K. Torkar (IRF, A)
CIS (Ion composition 0< E <40 keV) 10.8 10.6 I. Dandouras (IRAP/CNRS, F)
EDI (Plasma drift velocity) 10.5 9.1 R. Torbert (UNH, USA)
FGM (Magnetometer) 2.6 2.2
C. Carr (IC, UK)
PEACE (Electrons, 0< E <30 keV) 6.0 4.2 A. Fazakerley (MSSL, UK)
RAPID (High energy electrons and ions) 5.7 4.5 P. Daly (MPAe, D)
DWPa(Wave processor) 2.9b 4b
M. Balikhin (Sheffield, UK)
EFWa(Electric field and waves) 16.2 3.7 M. Andr´e (IRFU, S)
STAFFa(Magnetic and electric fluctuations) 5.0 2.8 P. Canu (LPP, F)
WBDa(Electric field and wave forms) 1.8 1.7 J. Pickett (IOWA, USA)
WHISPERa(Electron density and waves) 1.8 1.8 J.-L. Rauch (LPC2E, F)
Total 65.2 47.3
aMembers of the wave experiment consortium (WEC);bincluding power supply.
and three companions with a reduced payload. The electron drift instrument (EDI), the ion mass spectrometer, the plasma
sounder, and the wide band instrument were only proposed to be included in the main spacecraft payload. However, it turned out to be simpler and cheaper to build and launch four identical spacecraft. The final payload flown on each craft (Table 3) is therefore close to the original main space-craft one.
After commissioning, three out of the 44 instruments did not work (ASPOC on C1, CIS on C2 and EDI on C4) and have remained off. During the 12 years of the mission a few more instruments have experienced problems and have been switched-off and a few have reduced capability (Table 4). ASPOC, which was controlling the spacecraft potential by emitting indium ions, ran out of indium in 2005 and was switched off in 2008. Overall, 84 % of the instruments con-tinue to function after 12 years in orbit while the nominal mission was only planned for 2 years. This is quite remark-able given the fact that the spacecraft experienced more ra-diation as perigee reduction resulted in the orbit crossing the radiation belts in 2009–2012.
3 Cluster science highlights
[image:4.595.47.284.355.647.2]27 1
2
3
Figure 2. Cluster orbits during 2001 and 2011 in XZGSE (top panel) and YZGSE (bottom panel). 4
The blue field lines are from Tsyganenko 1996 (produced with Orbit Visualisation Tool). The 5
inclination, line of apsides and perigee altitude changed significantly from 2001 to 2011. 6
7
Fig. 2. Cluster orbits during 2001 and 2011 inXZGSE(top panel) andY ZGSE(bottom panel). The blue lines represent field lines from Tsyganenko 1996 model (Tsyganenko, 1995) (produced with Orbit Visualisation Tool). The inclination, line of apsides and perigee al-titude changed significantly from 2001 to 2011.
continuously increasing even after 12 years in orbit. The new science targets and mission goals, obtained by the evolving orbit in combination with different separation strategies, have been a key driver of this vibrant scientific activity. Certainly the public access to all high-resolution data, about 1 year af-ter acquisition, has also been a positive factor for the success. As of the end of 2012, 1565 scientists from all over the world have been using the Cluster Active Archive.
We will concentrate in the following sections on Cluster results on magnetospheric dynamics, especially at the bow shock, the magnetopause, the magnetotail, the inner mag-netosphere and the auroral acceleration region, and we will demonstrate that the full picture can only be obtained from the four spacecraft measurements. In addition, we highlight
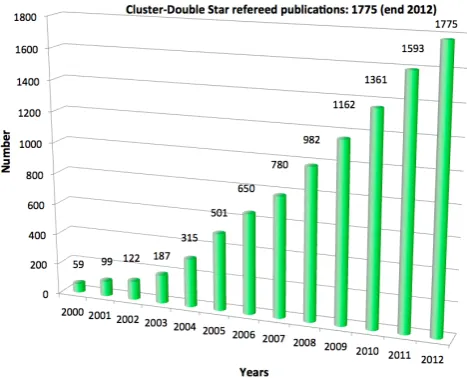
[image:5.595.310.544.62.251.2]28 1
Figure 3. Cluster and Double star referred publications up to end 2012.. 2
3
Fig. 3. Cluster and Double star referred publications up to end 2012.
29 1
2
Figure 4. Bow shock distance from Earth as measured by Cluster (diamonds) and possible 3
model using position and speed (blue line). The red line is the bow shock position using the 4
solar wind input and a gas dynamic model (from Maksimovic et al., 2003). 5
6
Fig. 4. Bow shock distance from Earth as measured by Cluster (di-amonds) and possible model using position and speed (blue line). The red line is the bow shock position using the solar wind input and a gas dynamic model (from Maksimovic et al., 2003).
Cluster results on the impact of CMEs on the Earth environ-ment.
3.1 The bow shock
The Earth’s bow shock is the first barrier for the solar wind plasma that enters the Earth environment. It is, however, a rather porous barrier that mainly slows down and heats the plasma. The bow shock is also a very dynamic boundary whose location and properties depend on the solar wind dy-namic pressure and on the direction of the magnetic field. Dunlop et al. (2002), using the discontinuity analysis tech-nique, showed that the bow shock can move slowly at a speed of 17 km s−1 but also very fast, up to 280 km s−1 (see their Table 1). Furthermore, in one event they showed that the bow shock accelerated up to 10 km s−2, making the bow shock as dynamic as the magnetopause.
[image:5.595.50.283.65.447.2] [image:5.595.310.548.287.443.2]1050 C. P. Escoubet et al.: Dynamical processes in space: Cluster results
Table 4. Status of Cluster payload as of 2013.
Payload C1 C2 C3 C4
ASPOC Off from 2000 End of operations End of operations End of operations CIS HIA 1 h per orbit Off from 2000* Off from 2009* OK
EDI Ambient mode Ambient mode OK Off from 2000*
FGM OK OK OK OK
PEACE OK OK OK OK
RAPID e− OK OK OK OK
Ions Off from 2007 Only head 3 Off from 2010 Only heads 1 & 3
WEC OK OK OK OK
DWP OK OK OK OK
EFW Probes 2 & 3 on Probes 2 & 4 on Probes 2 & 4 on OK
STAFF OK OK OK OK
WBD OK OK max. 10 min/h OK
Whisper OK OK OK OK
* Telemetry areas from CIS and EDI are used by PEACE.
Maksimovic et al. (2003) used 11 bow shock crossings over an interval of two and a half hours to deduce the po-sition and speed of the shock from the four spacecraft. They assumed that the shock was planar and moving at a constant speed between the spacecraft. With the spacecraft separated by∼600 km, this assumption was reasonable and they were able to obtain a curve to represent the global oscillations of the shock (Fig. 4). These results were in good agreement with the position of the shock given by a gas dynamic model using solar wind input data.
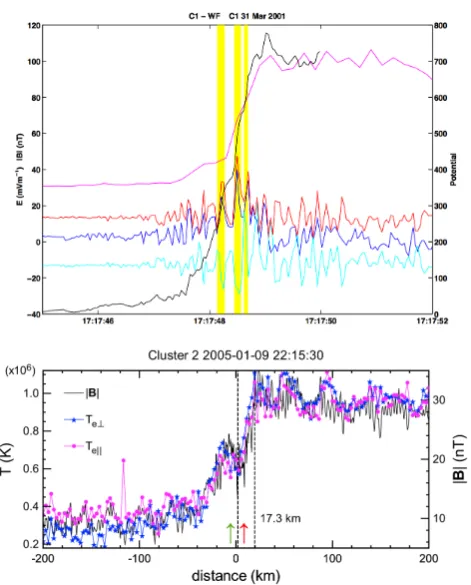
Detailed analysis of the shock made by Walker et al. (2004) showed that short scale electric structures are observed within the shock itself, with large amplitude up to 70 mV m−1, making a significant contribution to the
shock cross-potential (Fig. 5, top). These electric structures have a size of a few c/ωpe (electron inertial length) and
where shown to become narrower as θBn (angle between
the interplanetary magnetic field and the shock normal) ap-proached 90◦, in agreement with theory. Recently, Schwartz et al. (2011), using a special event where the magnetic field was aligned with the spacecraft spin axis and where the shock was moving slowly, was able to obtain electron pitch-angle distribution functions at resolutions of 125–250 ms intervals. Assuming that the distribution was gyrotropic, they could then show that the electron temperature increased signifi-cantly over small scales around 6c/ωpe(Fig. 5, bottom).
3.2 The magnetopause
The magnetopause is the boundary where the coupling be-tween the solar wind and the Earth magnetic field takes place and it is therefore very important to know its location, its motion and if it contains special plasma structures that can change its shape. Dunlop et al. (2001) were one of the first to publish four-point measurements at the magnetopause dur-ing the first exit of Cluster outside the magnetosphere in
30 1
2
3
Figure 5. Small scale structures within the bow shock in the electric field (top) and electron 4
temperature (bottom). (top) Spacecraft spin plane electric field (red), its two components Ex 5
(blue) and Ey (cyan), the integrated potential (black) and the total magnetic field (magenta) 6
from Walker et al, (2004). (bottom) Total magnetic field and electron perpendicular (blue) 7
and parallel temperature (magenta) from Schwartz et al., 2011. 8
Fig. 5. Small scale structures within the bow shock in the elec-tric field (top) and electron temperature (bottom). Top: Spacecraft spin plane electric field (red), its two componentsEx(blue) andEy (cyan), the integrated potential (black) and the total magnetic field (magenta) from Walker et al. (2004). Bottom: Total magnetic field and electron perpendicular (blue) and parallel temperature (ma-genta) from Schwartz et al. (2011).
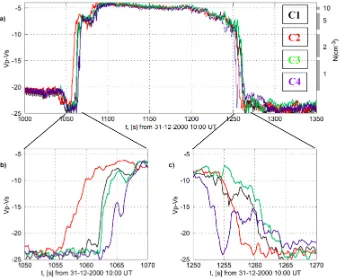
[image:6.595.311.547.280.573.2]31 2
Figure 6. (top panel) Cluster spacecraft potential measurements as function of time during a 3
magnetopause crossing on 31 December 2000 (from Pedersen et al., 2001). The spacecraft 4
potential can be used as proxy for the plasma density as indicated on the right axis. (bottom 5
panels) zoom around the magnetopause crossings. 6
[image:7.595.128.468.62.341.2]7
Fig. 6. Top panel: Cluster spacecraft potential measurements as function of time during a magnetopause crossing on 31 December 2000 (from Pedersen et al., 2001). The spacecraft potential can be used as proxy for the plasma density as indicated on the right axis. Bottom panels: zoom around the magnetopause crossings.
32 1
Figure 7. Sketch of Kelvin–Helmholtz waves developing on the flank of the magnetosphere 2
near the equatorial plane under Northward interplanetary magnetic field. 3
4
Fig. 7. Sketch of Kelvin–Helmholtz waves developing on the flank of the magnetosphere near the equatorial plane under northward in-terplanetary magnetic field.
Dst index almost reaching−100 nT. With the magnetopause moving back and forth across the spacecraft over a period of 3 h, Dunlop et al. (2001) could show that the magnetopause speed along the normal was varying continuously from a minimum of 17 km s−1up to 124 km s−1. Its thickness was also measured to be about 1000 km.
Pedersen et al. (2001) analysed two magnetopause cross-ings using the spacecraft potential as proxy for plasma den-sity. They found that the first crossing was very different from the second crossing (as can be seen from the different order between the spacecraft): the magnetopause normal was first mainly in theXGSE direction while mainly in theYGSE
di-rection later (Fig. 6). Although they did not explain why the magnetopause was so different in a few minutes interval, it was already a sign that it could be quite deformed and not always quasi-planar on scales smaller than 1000 km. A few years later Owen et al. (2004) observed regular oscillations of the magnetopause and showed that a train of surface waves, with a wavelength around 3RE, moving at 65 km s−1, could
explain the observations. Since the leading edge was steeper than the trailing edge, these waves were consistent with the Kelvin–Helmholtz (K–H) driving mechanism.
Hasegawa et al. (2004) observed for the first time that these K–H waves could roll-up into vortices and allow plasma transfer from the solar wind to the magnetosphere (Fig. 7). This was demonstrated when the spacecraft located
[image:7.595.50.285.406.640.2]1052 C. P. Escoubet et al.: Dynamical processes in space: Cluster results
33 1
[image:8.595.83.250.59.218.2]2
Figure 8. Dipolarisation fronts observed by four Cluster spacecraft on 22 July 2001 in XYGSM 3
system with reference to C3 position (from Nakamura et al., 2002). Dipolarisation fronts are 4
shown in dotted lines, The long arrow show the plasma flow during the interval of maximum 5
flow and the short arrow the flow during the dipolarisation projected perpendicular to the 6
dipolarisation front. 7
8
Fig. 8. Dipolarisation fronts observed by four Cluster spacecraft on 22 July 2001 inXYGSMsystem with reference to C3 position (from Nakamura et al., 2002). Dipolarisation fronts are shown by dotted lines, The long arrow shows the plasma flow during the interval of maximum flow and the short arrow the flow during the dipolarisa-tion projected perpendicular to the dipolarisadipolarisa-tion front.
further inward observed higher density than the three oth-ers located outward. These observations were supported by a MagnetoHydroDynamic (MHD) simulation. Since there was no sign of plasma acceleration due to magnetic stress, they speculated that magnetic reconnection was not taking place locally in that event. A few years later, however, Nykyri et al. (2006) found that reconnection was occurring inside a rolled-up vortex and Hasegawa et al. (2009) found it on the trailing edge of the vortex. More recently, K–H vortices have been found even during southward IMF (Hwang et al., 2011) and at high latitudes (Hwang et al., 2012).
3.3 The plasmasheet
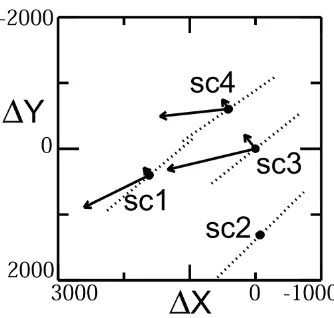
The four Cluster spacecraft have also significantly advanced our knowledge of the magnetotail and especially the plas-masheet, the big reservoir of plasma that regularly releases large quantity of energy toward the Earth during magneto-spheric substorms. Once again, being able to distinguish be-tween spatial and temporal variations using measurements at four points separated in space is a key aspect to understand the physics of this region. During the tail seasons early in the mission, two tetrahedra were formed on each side of the plasmasheet to enable a very good 3-D constellation through the whole plasmasheet (Fig. 1).
A key aspect of substorms is the dipolarisation fronts that move toward the Earth and are also associated with brighten-ing of the aurora. Nakamura et al. (2002) analysed the char-acteristics of a dipolarisation front moving toward the Earth in front of a plasma flow burst. They found that the dipolari-sation front was planar, over the spacecraft constellation size of a few 1000s km, with a thickness around 2000 km and a speed toward the Earth around 77 km s−1(Fig. 8). They also showed that the Earthward flow changed direction as it
ap-34 1
2
Figure 9. Sketch of magnetotail surface waves extended along the tail and propagating from 3
the centre to the flanks. 4
5
Fig. 9. Sketch of magnetotail surface waves extended along the tail and propagating from the centre to the flanks.
proached Earth most likely due to the ambient field deflect-ing it.
As shown for the magnetopause, Cluster is the perfect tool to reveal and study surface waves at the interface be-tween two opposite plasma flows. Large plasma flows have been regularly observed within the plasmasheet, however, before Cluster, surface waves were never observed due to the ambiguity to distinguish them from the flapping motion of the plasmasheet. Zhang et al. (2002), using five consec-utive crossings of the neutral sheet, showed that its normal changed direction during each crossing and concluded that a wave was launched from the centre of the tail and prop-agated toward the flanks. Sergeev et al. (2004) made a sta-tistical study of 58 neutral sheet crossings obtained between July and November 2001. They showed that the waves are of kink-type, initiated in the centre of the tail and propagating toward the dawn and dusk flanks with a propagation speed of 57 km s−1 during quiet time and 145 km s−1 during high activity. Finally, using both Cluster and Double Star (TC1), separated by 5REinXGSE, Zhang et al. (2005), showed that
these waves were extended between 11 and 16REalong the
tail (Fig. 9).
3.4 The plasmasphere
[image:8.595.311.547.63.237.2]35 1
2
Figure 10. Auroral acceleration structures superimposed on bright arcs and black aurora. The 3
altitude of Cluster during recent years as well as of previous auroral missions and rockets is 4
indicated (adapted from Marklund et al., 2009). 5
6
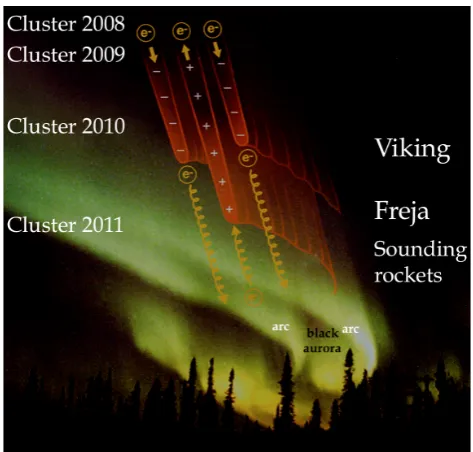
Fig. 10. Auroral acceleration structures superimposed on bright arcs and black aurora. The altitude of Cluster during recent years as well as of previous auroral missions and rockets is indicated (adapted from Marklund, 2009).
gradient were almost never field-aligned at magnetic lati-tudes sampled by Cluster (equatorial latilati-tudes, between−30◦ and+30◦), which suggests that the refilling of flux tubes with plasma from the ionosphere is a gradual process. The gradients of density were then used to deduce drift veloc-ity of plasmaspheric structures. One the main structure that is very often observed in the plasmasphere is the plume. It starts from the duskside and extends all the way to the day-side, sometimes reaching the magnetopause. This plume is particularly dynamic and changes greatly as the activity in-creases (Darrouzet et al., 2009b). A book, reviewing the lat-est results on the plasmasphere from both Cluster and NASA IMAGE spacecraft, was recently published by Darrouzet et al. (2009a).
3.5 Auroral acceleration region
Since 2006, the Cluster satellites have slowly drifted away from their initial polar orbits (Fig. 2). Meanwhile, the perigee altitudes of their orbits have decreased from 19 000 km to just a few hundred kilometres, giving Cluster access to new re-gions of near-Earth space. For the first time, in spring 2009, we made use of this natural orbital drift to obtain simulta-neous four-point measurements of the Auroral Acceleration Region (AAR). The evolution of Cluster’s sampling of the auroral acceleration region is shown in Fig. 10. In 2011, the minimum altitudes reached by the Cluster spacecraft were below those of previous auroral physics missions, such as Viking and Freja.
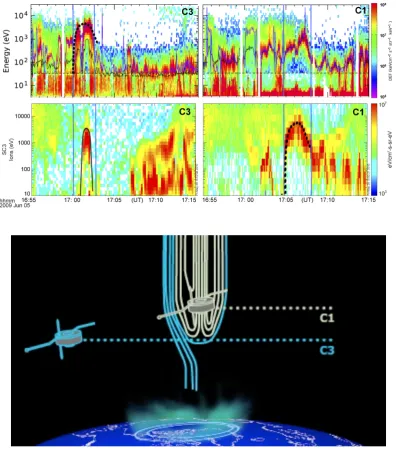
Using two of the four spacecraft in 2009, Marklund et al. (2011) showed that the downgoing electrons and upgoing ions were significantly different on the two spacecraft sepa-rated by about 5 min in time (Fig. 11, top). The upward ion beam was lower in energy and spatially narrower on the first spacecraft compared to the second. Since the two spacecraft were separated by about 2600 km in altitude they were sam-pling different area of the auroral acceleration structure; the results are best explained by combining an S-shape (equipo-tential lines approximately forming an “S”) with a U-shape electric potential (equipotential lines forming a “U”) distri-bution (Fig. 11, bottom). Using another auroral crossing in 2009, Forsyth et al. (2012) showed that the electric potential below C4 and C3, following each other with 2.5 min delay, changed by 1.7 kV, while the potential above the spacecraft stayed approximately constant during the interval. The com-parison of electron spectra also allowed them to estimate the potential around C1 and C3, which were magnetically con-jugate. They found that around 15 % of the total potential drop was located between C1 at 6235 km altitude and C3 at 4885 km altitude and that the majority of the potential drop was below C3. These four-point observations of the auroral regions are certainly looking promising and a special cam-paign to combine particles with simultaneous high resolu-tion measurements of electromagnetic waves are the focus of a special campaign in spring 2013.
3.6 Impact of Coronal Mass Ejections on the Earth en-vironment
Coronal Mass Ejections (CMEs) are huge clouds of plasma emitted by the Sun during solar storms. Their characteris-tics vary greatly but CMEs can sometimes be as fast as 3000 km s−1 and contain strong magnetic field and dense plasma. The effect on the Earth’s environment could be dra-matic, since it induces fast and large changes of the Earth’s magnetosphere, which in turn energises particles to very high energy. “Space Weather” was created to study the effect of the Sun on the Earth and on Human systems. The growing interest by governments, especially on the very rare extreme events, have made “space weather” a permanent agenda item of the United Nation Committee on the Peaceful Uses of Outer Space. Cluster is not a space weather mission as such but its measurements, specially on the study of dynamic structures, are providing a key input for the models that are being developed for space weather predictions. Cluster ca-pabilities were enhanced when, in 2002, the SPC agreed to add a second ground station to record the Cluster observa-tions twenty-four hours a day, seven days a week (originally the mission was designed to cover about 50 % of the orbit focused on magnetospheric boundaries, bow shock, magne-topause, cusp and plasmasheet).
Using Cluster data taken in 2001, Zong et al. (2002) ob-served an enhancement of energetic particles in the polar cusp when the leading edge of a CME hit the magnetosphere.
[image:9.595.48.285.61.287.2]1054 C. P. Escoubet et al.: Dynamical processes in space: Cluster results
1
2
3
Figure 11. (top) Electron and ion spectrograms during an AAR crossing with C3 and C1. C1
4
and C3 follow each other with C3 leading by 5 minutes (adapted from Marklund 2011).
5
(bottom) Sketch of the AAR potential drop seen by C3 (blue) ‘S-shape’ and C1 (blue and
6
white) ‘U-shape’.
7
8
Fig. 11. Top: Electron and ion spectrograms during an AAR crossing with C3 and C1. C1 and C3 follow each other with C3 leading by 5 min (adapted from Marklund et al., 2011). (bottom) Sketch of the AAR potential drop seen by C3 (blue) “S-shape” and C1 (blue and white) “U-shape”.
Fazakerley et al. (2005) used SOHO, ACE and Cluster data to study the propagation of a CME from the Sun to the Earth and showed that the magnetic field and plasma signatures of the CME changed little while travelling from the Sun to the Earth. CMEs, as they impact Earth, usually compress the magnetosphere. Sometimes when the density and flow within the CME are many times the usual solar wind values, the magnetosphere can be extremely compressed and the mag-netopause be pushed well inside geostationary orbit. The po-lar regions of the magnetosphere and in particupo-lar the popo-lar cusps are also greatly affected. Balan et al. (2007) showed, during the Halloween storm in October 2003, when the
so-lar wind dynamic pressure reached 25 nPa (10 times usual values), that the exterior cusp altitude went below 7RE;
in-creases of ion flows and temperature were also observed by EISCAT in the ionosphere. During the arrival of a CME in November 2004, Bogdanova et al. (2007) showed that the cusp was much wider, 6–7◦Invariant Latitude (ILAT), and at lower latitude−7◦ILAT than in normal conditions. Using an MHD model, Siscoe et al. (2007) showed that the cusp was highly distorted during this event. Often CMEs are asso-ciated with low Alfv´en Mach number (|v|/(|B|(ρµo)−1/2))
and under these conditions, Lavraud et al. (2007) showed that the plasma in the magnetosheath can be accelerated to
[image:10.595.101.498.61.511.2]Table 5. List of Cluster Guest Investigators selected in 2011.
Guest Investigator GI proposal title Laboratory Implementation period
B. Walsh High Latitude Magne-topause Electrons
Boston University (USA) Spring 2011
E. Yordanova Small scale turbulence Institutet for Rymdfysik, Uppsala (Sweden)
February until April 2012
A. Retin`o Multi-scale observations of magnetic reconnection in the magnetosphere
LPP/UPMC/Ecole Poly-technique/CNRS (France)
May and August 2012
C. Foullon Magnetopause boundary layer: evolution of plasma and turbulent characteris-tics along the flanks
Warwick University (UK) November 2012
Z. Pu Generation and 3-D fea-tures of flux transfer events at the dayside magne-topause
Peking University (China) January and February 2013
F. Pitout Particle acceleration and field aligned currents in the cusp
IRAP/Paul Sabatier Univer-sity/CNRS (France)
Autumn 2013
Table 6. Cluster Active Archive users (based on email).
Country Number of users Country Number of users
Argentina 1 International (.int) 39
Austria 27 Italy 21
Australia 6 Japan 48
Belgium 19 South-Korea 10
Bulgaria 2 Kazakhstan 1
Brazil 11 Mexico 4
Canada 24 Netherlands 3
Switzerland 4 Norway 14
Chile 3 New Zealand 1
China 106 Non-profit (.org) 8
Commercial (.com) 421 Poland 10
Czech Republic 19 Romania 2
Germany 47 Russia 45
Denmark 2 Sweden 47
Spain 5 Slovac Republic 1
Finland 24 Turkey 1
France 90 Taiwan 14
Greece 8 Ukraine 2
Hungary 12 United Kingdom 155
Israel 2 South Africa 4
India 17 USA 297
a very high speed (above 1000 km s−1) as compared to the
solar wind speed (650 km s−1).
4 Cluster Guest Investigator programme
As customary for space physics missions, the decision on how to operate the spacecraft and instruments have been the role of the Science Working team made of the Principal
In-vestigators and the Project Scientist. In 2010, however, as part of activities for that extension period, science opera-tions were opened to scientists from the community, turn-ing Cluster into an “observatory”, similarly to what is com-monly done with Astronomy missions. An Announcement of Opportunity was opened in July 2010, soliciting Guest In-vestigator (GI) proposals for special operations of the instru-ments or the spacecraft, including changing the separation
[image:11.595.146.449.338.593.2]1056 C. P. Escoubet et al.: Dynamical processes in space: Cluster results
37 1
2
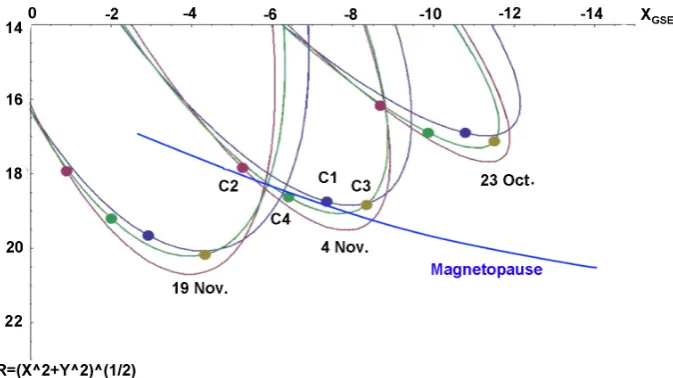
Figure 12. Three orbits of Cluster during October and November 2012. The numbers indicate 3
the spacecraft number. The model magnetopause is shown as blue line during the orbit on 4 4
November 2012 (Adapted from D. Sieg). 5
[image:12.595.130.467.60.249.2]6
Fig. 12. Three orbits of Cluster during October and November 2012. The numbers indicate the spacecraft number. The model magnetopause is shown as blue line during the orbit on 4 November 2012 (courtesy of D. Sieg, ESOC, Germany).
38 1
2
Figure 13. Cluster Active Archive statistics from the opening in Feb 2006 to now. The 3
number of users are shown at the top, the number of logins per month in the middle and the 4
monthly download rate (in Gbytes) at the bottom. 5
6
Fig. 13. Cluster Active Archive statistics from the opening in Febru-ary 2006 to now. The number of users are shown at the top, the number of logins per month in the middle and the monthly down-load rate (in Gbytes) at the bottom.
between the spacecraft. Six GI proposals were selected and are summarised in Table 5. The scientific aims of the pro-posals were quite diverse, and it is important to stress that the proposed science investigations would not have been car-ried out without the GI programme. The science goals cov-ered the high latitude magnetopause, turbulence in the mag-netosheath, multi-scale observation of reconnection, K–H waves on the flanks, generation of flux transfer events and field-aligned currents in the cusp. The spacecraft constella-tion was also changed significantly as a result of these spe-cific operations (Fig. 1 yellow dots). Figure 12 shows the constellation formed for C. Foullon’s proposal where the
four spacecraft were equally spaced covering about 4RE
along the magnetopause to examine K–H wave formation and boundary layer structure. If a further extension for the years 2015–2016 is granted to Cluster by SPC in June 2013, we intend to make a new call in the following months.
5 Cluster data open access
Since the beginning of the Cluster mission, data have been accessible through the Cluster Science Data System (CSDS) (Schmidt et al., 1997). Since CSDS development started in the early 1990s, and the network bandwidth was much lower than now, the system was developed around maximising the science and keeping the data exchange through network min-imum. The datasets were of three types, the summary and prime parameters and the quicklook plots (quicklook plots were stopped a few years later when it was realised that they were not so used and that the software to produce them was difficult to maintain). Summary parameters, physical param-eters coming from all instruments from C3 at 1-min res-olution, were accessible to everybody. On the other hand, prime parameters, including physical parameters from the four spacecraft at 4 s spin resolution, were only accessible to PIs and CoIs. In 2008, however, the restriction on prime parameter was lifted and all CSDS data were available to the science community.
[image:12.595.51.282.304.495.2]– Maximise the scientific return from the mission by
mak-ing all Cluster data available to the worldwide scientific community.
– Ensure that the unique dataset returned by the Cluster
mission is preserved in a stable, long-term archive for scientific analysis beyond the end of the mission.
– Provide this archive as a major contribution by ESA and
the Cluster science community to the International Liv-ing With a Star programme.
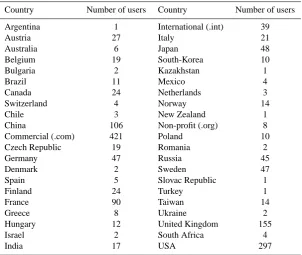
After a few years of development to define the meta data and the Cluster Exchange Format (ASCII based), process the first few years of data and develop the user interface, the Clus-ter Active Archive was open to the public in February 2006 (caa.estec.esa.int) (Laakso et al., 2010). Figure 13 show the number of users, number of logins and monthly download rates of CAA data. The science community using CAA data has been growing continuously since 2006 at a rate around 20 new users every month and we have now more than 1600 users. The download rate has also been continuously growing and at the beginning of 2013 it was above 2 TB/month. Users of CAA originates from all over the world (Table 6). Further-more, a large portion of Cluster published papers (Fig. 3) are using data from CAA and their number has clearly increased since 2006, the year of CAA opening.
6 Summary and conclusion
The Cluster mission is one of the most successful missions dedicated to the study of the Sun-Earth connection. This is primarily due to the determination of the Cluster scientists who never compromised on the number of spacecraft neces-sary to achieve the objectives: during the development of the original Cluster mission and its successor Cluster II, the total number of spacecraft was always challenged in order to de-crease cost. The answer from scientists was however always the same: four spacecraft is the minimum. They are now con-tinually rewarded by the results achieved by Cluster. Another key aspect that allowed to maximise science throughput was the fast and easy access to data that was first achieved by CSDS and then with the CAA.
Cluster’s collaboration with other missions has also sub-stantially increased our knowledge of the magnetosphere, first with IMAGE and Polar, then with Double Star and THEMIS, now with the newly launched Van Allen probes. In a few years time, Cluster together with the MMS mission, will allow for the first time to sample the Earth environment with four point measurements at two separate places of the magnetosphere, returning inter alia key 3-D information on magnetic reconnection at small and large scales simultane-ously. Strong collaboration will also continue with ground-based observatories such as SuperDARN and the future EIS-CAT 3-D since they give the context where spacecraft data
need to be put into perspective. The Cluster mission has now been extended up to end 2014 and we are looking forward to extending it another two years in a few months time.
Acknowledgements. The authors thank the PI teams for keeping the instrument in very good shape after more than 12 years in space: K. Torkar (IWF, Austria), I. Dandouras (IRAP/CNRS, France), R. Tor-bert (UNH, USA), C. Carr (IC, UK), A. Fazakerley (MSSL, UK), P. Daly (MPAe, Germany), M. Balikhin (Sheffield, UK), M. Andr´e (IRFU, Sweden), P. Canu (LPP, France), J. Pickett (U. Iowa, USA), J.-L. Rauch (LPC2E, France). We thank also the ESOC and JSOC teams for spacecraft and science operations as well as industry (As-trium, Germany) for their continuous spacecraft operation support. We would like to thank the archiving teams at ESTEC and ESAC and the CSDS teams at National data centres. Finally we acknowl-edge K. Stasiewicz, M. Khotyaintsev and Y. Khotyaintsev, for the development of the Orbit Visualisation Tool.
Topical Editor I. A. Daglis thanks two anonymous referees for their help in evaluating this paper.
References
Acu˜na, M. H., Ogilvie, K. W., Baker, D. N., Curtis, S. A., Fairfield, D. H., and Mish, W. H.: The Global Geospace Science Program and It’s Investigations, The Global Geospace Mission, edited by: Russell, C. T., Kluwer Academic Publishers, Space Sci. Rev., 71, 5–21, 1995.
Balan, N., Alleyne, H., Walker, S., R`eme, H., Lucek, E., Cornilleau-Wehrlin, N., Fazakerley, A. N., Zhang, S., and van Eyken, A. P.: Response of the magnetosheath-cusp region to a coronal mass ejection, J. Geophys. Res., 112, A12211, doi:10.1029/2006JA012122, 2007.
Bogdanova, Y. V., Owen, C. J., Siscoe, G., Fazakerley, A. N., Dan-douras, I., Marghitu, O., Kaymaz, Z., R`eme, H., and Lucek, E. A.: Cluster Observations of the Magnetospheric Low-Latitude Boundary Layer and Cusp during Extreme Solar Wind and In-terplanetary Magnetic Field Conditions: II. 7 November 2004 ICME and Statistical Survey, Solar Physics, 244, 233–261, doi:10.1007/s11207-007-0418-0, 2007.
Bryant, D., Krimigis, S. M., and Haerendel, G.: Outline of the ac-tive magnetospheric particle tracer explorers (AMPTE) mission, IEEE Trans. Geosci. Remote Sensing, GE-23, 177–181, 1985. Burch, J. L.: IMAGE Mission Overview, Space Sci. Rev., 91, 1–14,
2000.
Cavallo, G.: The Selection of the Ariane-5 Test Flight for Cluster’s Launch, ESA Bulletin Nr. 87, 1996.
Credland, J. and Schmidt, R.: The Resurrection of the Cluster Sci-entific Mission, ESA Bulletin Nr. 91, 1997.
Credland, J., Mecke, G., and Ellwood, J.: The Cluster Mission: ESA’s Spacefleet to the Magnetosphere, Space Sci. Rev., 79, 33– 64, 1997.
Darrouzet, F., De Keyser, J., D´ecr´eau, P. M. E., Lemaire, J. F., and Dunlop, M. W.: Spatial gradients in the plas-masphere from Cluster, Geophys. Res. Lett., 33, L08105, doi:10.1029/2006GL025727, 2006.
Darrouzet, F., De Keyser, J., and Pierrard, V.: Foreword to “The Earth’s Plasmasphere, A Cluster and IMAGE Perspective”, Space Sci. Rev., 145, 3–5, 2009a.
1058 C. P. Escoubet et al.: Dynamical processes in space: Cluster results
Darrouzet, F., Gallagher, D. L., Andr´e, N., Carpenter, D. L., Dan-douras, I., D´ecr´eau, P. M. E., De Keyser, J., Denton, R. E., Foster, J. C., Goldstein, J., Moldwin, M. B., Reinisch, B. W., Sandel, B. R., and Tu, J.: Plasmaspheric Density Structures and Dynamics: Properties Observed by the CLUSTER and IMAGE Missions, Space Sci. Rev., 145, 55–106, 2009b.
D´ecr´eau, P. M. E., Fergeau, P., Krasnoselskikh, V., Le Guirriec, E., L´evˆeque, M., Martin, Ph., Randriamboarison, O., Rauch, J. L., Sen´e, F. X., S´eran, H. C., Trotignon, J. G., Canu, P., Cornilleau, N., de F´eraudy, H., Alleyne, H., Yearby, K., M¨ogensen, P. B., Gustafsson, G., Andr´e, M., Gurnett, D. C., Darrouzet, F., Lemaire, J., Harvey, C. C., Travnicek, P., and Whisper experimenters: Early results from the Whisper instru-ment on Cluster: an overview, Ann. Geophys., 19, 1241–1258, doi:10.5194/angeo-19-1241-2001, 2001.
Dunlop, M. W., Balogh, A., Cargill, P., Elphic, R. C., Fornac¸on, K.-H., Georgescu, E., Sedgemore-Schulthess, F., and the FGM team: Cluster observes the Earth’s magnetopause: coordinated four-point magnetic field measurements, Ann. Geophys., 19, 1449– 1460, doi:10.5194/angeo-19-1449-2001, 2001.
Dunlop, M. W., Balogh, A., and Glassmeier, K.-H.: Four-point Cluster application of magnetic field analysis tools: The discontinuity analyzer, J. Geophys. Res., 107, 1385, doi:10.1029/2001JA005089, 2002.
Escoubet, C. P., Schmidt, R., and Goldstein, M. L.: Cluster – Sci-ence and mission overview, Space Sci. Rev., 79, 11–32, 1997. Escoubet, C. P., Fehringer, M., and Goldstein, M.:
Introduc-tion: The Cluster mission, Ann. Geophys., 19, 1197–1200, doi:10.5194/angeo-19-1197-2001, 2001.
Fazakerley, A. N., Harra, L. K., Culhane, J. L., van Driel-Gesztelyi, L., Lucek, E., Matthews, S. A., Owen, C. J., Mazelle, C., Balogh, A., and R`eme, H.: Relating in situ observations of an inter-planetary coronal mass ejection to the conditions at its site of origin in the solar corona, Geophys. Res. Lett., 32, L13105, doi:10.1029/2005GL022842, 2005.
Forsyth, C., Fazakerley, A. N., Walsh, A. P., Watt, C. E. J., Garza, K. J., Owen, C. J., Constantinescu, D., Dandouras, I., Fornac¸on, K.-H., Lucek, E., Marklund, G. T., Sadeghi, S. S., Khotyaint-sev, Y., Masson, A., and Doss, N.: Temporal evolution and elec-tric potential structure of the auroral acceleration region from multispacecraft measurements, J. Geophys. Res., 117, A12203, doi:10.1029/2012JA017655, 2012.
Galeev, A. A., Galperin, Yu. I., and Zelenyi, L. M.: The INTER-BALL Project to study solar-terrestrial physics, Cosmic Res., 34, 339–363, 1996.
Haerendel, G., Roux, A., Blanc, M., Paschmann, G., Bryant, D., Korth, A., and Hultqvist, B.: Cluster, study in three dimensions of plasma turbulence and small-scale structure, mission proposal submitted to ESA, 1982.
Hasegawa, H., Fujimoto, M., Phan, T. D., R`eme, H., Balogh, A., Dunlop, M. W., Hashimoto, C., and TanDokoro, R.: Transport of solar wind into Earth’s magnetosphere through rolled-up Kelvin-Helmholtz vortices, Nature, 430, 755–758, 2004.
Hasegawa, H., Retin`o, A., Vaivads, A., Khotyaintsev, Y., Andr´e, M., Nakamura, T. K. M., Teh, W.-L., Sonnerup, B. U. ¨O., Schwartz, S. J., Seki, Y., Fujimoto, M., Saito, Y., R`eme, H., and Canu, P.: Kelvin-Helmholtz waves at the Earth’s magnetopause: Mul-tiscale development and associated reconnection, J. Geophys. Res., 114, A12207, doi:10.1029/2009JA014042, 2009.
Hwang, K.-J., Goldstein, M. L., Lee, E., and Pickett, J. S.: Cluster observations of multiple dipolarization fronts, J. Geophys. Res., 116, A00I32, doi:10.1029/2010JA015742, 2011.
Hwang, K.-J., Goldstein, M. L., Kuznetsova, M. M., Wang, Y., Vi˜nas, A. F., and Sibeck, D. G.: The first in-situ observation of Kelvin-Helmholtz waves at high-latitude magnetopause during strongly dawnward interplanetary magnetic field conditions, J. Geophys. Res., 117, A08233, doi:10.1029/2011JA017256, 2012. Kessel, R. L., Fox, N. J., and Weiss, M.: The Radiation Belt Storm Probes (RBSP) and Space Weather, Space Sci. Rev., published online, doi:10.1007/s11214-012-9953-6, 2012.
Laakso, H., Perry, C., McCaffrey, S., Herment, D., Allen, A. J., Har-vey, C. C., Escoubet, C. P., Gruenberger, C., Taylor, M. G. G. T., and Turner, R.: Cluster Active Archive: Overview, The Cluster Active Archive, edited by: Laakso, H., Taylor, M. G. T. T., and Escoubet, C. P., Astrophysics and Space Science Proceedings, Springer, 3–37, doi:10.1007/978-90-481-3499-1 1, 2010. Lavraud, B., Borovsky, J. E., Ridley, A. J., Pogue, E. W.,
Thom-sen, M. F., R`eme, H., Fazakerley, A. N., and Lucek, E. A.: Strong bulk plasma acceleration in Earth’s magnetosheath: A magnetic slingshot effect?, Geophys. Res. Lett., 34, L14102, doi:10.1029/2007GL030024, 2007.
Maksimovic, M., Bale, S. D., Horbury, T. S., and Andre, M.: Bow shock motions observed with CLUSTER, Geophys. Res. Lett., 30, 1393, doi:10.1029/2002GL016761, 2003.
Marklund, G. T.: Electric Fields and Plasma Processes in the Auroral Downward Current Region, Below, Within, and Above the Acceleration Region, Space Sci. Rev., 142, 1–21, doi:10.1007/s11214-008-9373-9, 2009.
Marklund, G. T., Sadeghi, S., Karlsson, T., Lindqvist, P.-A., Nils-son, H., Forsyth, C., Fazakerley, A., Lucek, E. A., and Pickett, J.: Altitude Distribution of the Auroral Acceleration Potential De-termined from Cluster Satellite Data at Different Heights, Phys. Rev. Lett., 106, 055002, doi:10.1103/PhysRevLett.106.055002, 2011.
Nakamura, R., Baumjohann, W., Klecker, B., Bogdanova, Y., Balogh, A., R`eeme, H., Bosqued, J. M., Dandouras, I., Sauvaud, J. A., Glassmeier, K.-H., Kistler, L., Mouikis, C., Zhang, T. L., Eichelberger, H., and Runov, A.: Motion of the dipolarization front during a flow burst event observed by Cluster, Geophys. Res. Lett., 29, 1942, doi:10.1029/2002GL015763, 2002. Nishida, A.: The GEOTAIL mission, Geophys. Res. Lett., 21, 2871–
2873, doi:10.1029/94GL01223, 1994.
Nykyri, K., Otto, A., Lavraud, B., Mouikis, C., Kistler, L. M., Balogh, A., and R`eme, H.: Cluster observations of recon-nection due to the Kelvin–Helmholtz instability at the dawn-side magnetospheric flank, Ann. Geophys., 24, 2619–2643, doi:10.5194/angeo-24-2619-2006, 2006.
Ogilvie, K. W., von Rosenvinge, T., and Durney, A. C.: International Sun Earth Explorer – A three spacecraft program, Science, 198, 131–138, 1977.
Ogilvie, K. W., Durney, A. C., and von Rosenvinge, T.: Descrip-tions of experimental investigaDescrip-tions and instruments for the ISEE spacecraft, IEEE Trans. Geosci. Electron., GE-16, 151–153, 1978.
Pedersen, A., D´ecr´eau, P., Escoubet, C.-P., Gustafsson, G., Laakso, H., Lindqvist, P.-A., Lybekk, B., Masson, A., Mozer, F., and Vaivads, A.: Four-point high time resolution information on elec-tron densities by the electric field experiments (EFW) on Clus-ter, Ann. Geophys., 19, 1483–1489, doi:10.5194/angeo-19-1483-2001, 2001.
Schmidt, R., Escoubet, C. P., and Schwartz, S.: The Cluster Science Data System (CSDS) – A new approach to the distribution of scientific data, Space Sci. Rev., 79, 557–582, 1997.
Schwartz, S. J., Henley, E., Mitchell, J., and Krasnosel-skikh, V.: Electron Temperature Gradient Scale at Collisionless Shocks, Phys. Rev. Lett., 107, 215002, doi:10.1103/PhysRevLett.107.215002, 2011.
Sergeev, V., Runov, A., Baumjohann, W., Nakamura, R., Zhang, T. L., Balogh, A., Louarnd, P., Sauvaud, J.-A., and R`eme, H.: Ori-entation and propagation of current sheet oscillations, Geophys. Res. Lett., 31, L05807, doi:10.1029/2003GL019346, 2004. Siscoe, G., Kaymaz, Z., and Bogdanova, Y. V.: Magnetospheric
Cusps under Extreme Conditions: Cluster Observations and MHD Simulations Compared, Solar Phys., 244, 189–199, doi:10.1007/s11207-007-0359-7, 2007.
Tsyganenko, N. A.: Modeling the Earth’s magnetospheric magnetic field confined within a realistic magnetopause, J. Geophys. Res., 100, 5599–5612, 1995.
Walker, S. N., Alleyne, H. St. C. K., Balikhin, M. A., Andr´e, M., and Horbury, T. S.: Electric field scales at quasi-perpendicular shocks, Ann. Geophys., 22, 2291–2300, doi:10.5194/angeo-22-2291-2004, 2004.
Zhang, T. L., Baumjohann, W., Nakamura, R., Balogh, A., and Glassmeier, K.-H.: A wavy twisted neutral sheet ob-served by CLUSTER, Geophys. Res. Lett., 29, 1899, doi:10.1029/2002GL015544, 2002.
Zhang, T. L., Nakamura, R., Volwerk, M., Runov, A., Baumjohann, W., Eichelberger, H. U., Carr, C., Balogh, A., Sergeev, V., Shi, J. K., and Fornacon, K.-H.: Double Star/Cluster observation of neutral sheet oscillations on 5 August 2004, Ann. Geophys., 23, 2909–2914, doi:10.5194/angeo-23-2909-2005, 2005.
Zong, Q.-G., Fritz, T. A., Wilken, B., and Daly, P.: Energetic Ions in the High Latitude Magnetosphere During the Leading Phase of a CME, in: Solar-Terrestrial Magnetic Activity and Space En-vironment, edited by: Wang, H. and Xu, R., COSPAR Colloquia, Series, 14, 359–364, 2002.