The Thirty-Third AAAI Conference on Artificial Intelligence (AAAI-19)
G2C: A Generator-to-Classifier Framework
Integrating Multi-Stained Visual Cues for Pathological Glomerulus Classification
Bingzhe Wu,
1∗Xiaolu Zhang,
2Shiwan Zhao,
3Lingxi Xie,
4Caihong Zeng,
5Zhihong Liu,
5Guangyu Sun
11Peking University,2Ant Financial Services Group,3IBM Research,4Johns Hopkins University
5National Clinical Research Center of Kidney Disease, Jinling Hospital
[email protected], [email protected], [email protected], [email protected] zengch [email protected], [email protected], [email protected]
Abstract
Pathological glomerulus classification plays a key role in the diagnosis of nephropathy. As the difference between differ-ent subcategories is subtle, doctors often refer to slides from different staining methods to make decisions. However, cre-ating correspondence across various stains is labor-intensive, bringing major difficulties in collecting data and training a vision-based algorithm to assist nephropathy diagnosis. This paper provides an alternative solution for integrating multi-stained visual cues for glomerulus classification. Our approach, named generator-to-classifier(G2C), is a two-stage framework. Given an input image from a specified stain, severalgeneratorsare first applied to estimate its appearances in other staining methods, and aclassifierfollows to combine visual cues from different stains for prediction (whether it is pathological, or which type of pathology it has). We optimize these two stages in a joint manner. To provide a reasonable initialization, we pre-train the generators in an unlabeled ref-erence set under an unpaired image-to-image translation task, and then fine-tune them together with the classifier.
We conduct experiments on aglomerulus type classification
dataset collected by ourselves (there are no publicly avail-able datasets for this purpose). Although joint optimization slightly harms the authenticity of the generated patches, it boosts classification performance, suggesting more effective visual cues are extracted in an automatic way. We also trans-fer our model to a public dataset forbreast cancer classifica-tion, and outperform the state-of-the-arts significantly.
Introduction
More than10%people all over the world suffer nephropa-thy (Levin et al. 2017). An important way of diagnosis lies in a quantitative analysis of glomeruli,e.g., discriminating be-tween normal and abnormal samples, and further diagnosing the abnormality if necessary. In clinics, pathologists ally refer to multiple slides of the same glomerulus, gener-ated by different staining methods, in order to collect cues from particular glomerular structures, elements, or even mi-croorganisms to detect subtle differences among these sub-categories. In this work, we consider four staining methods,
∗
This work was done when Bingzhe Wu was a research intern at IBM Research - China.
Copyright c⃝2019, Association for the Advancement of Artificial Intelligence (www.aaai.org). All rights reserved.
Sl
ides
Patc
h
es
PAS H&E MASSON PASM
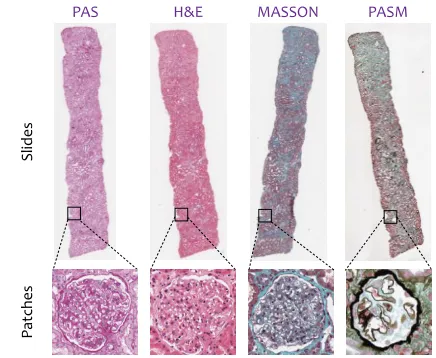
Figure 1: Top: slides from four different staining methods (PAS,H&E,MASSONandPASM, respectively). Bottom: four real patches, containing thesameglomerulus and sampled from thesameposition of these slides.
namelyPAS,H&E,MASSONandPASM. As shown in Fig-ure 1, these staining methods produce quitedifferent appear-ances even for thesameglomerulus.
We aim at integrating multi-stained visual cues for glomerulus classification. The main difficulty lies in the lack of annotation,i.e., in both training and testing, labeling every glomerulus across different stains is both labor-intensive and error-prone. In our case, we are provided a partially labeled dataset on one stain (PAS), and unlabeled data on other three stains. For most glomeruli, it is difficult to find their perfect occurrences in all four stains, thus we cannot expect a sim-ple algorithm to learn from correspondence across different stains. This partly limits previous work (Gallego et al. 2018) from training classification models on multiple stains.
To this end, we propose an approach named
generator-to-classifier (G2C), with the core idea being to generate
stain (e.g.,H&E,MASSONor PASM). To this end, we use a popular encoder-decoder structure (Zhu et al. 2017) which first down-samples the input patch to extract visual features and then up-samples to estimate its appearance in the target domain. The second stage builds aclassifierupon all stains, one real and a few generated, and outputs prediction. To al-leviate over-fitting, we share network weights among differ-ent branches (each branch deals with one stain), and add a cross-stain attention block after each residual block to adjust neural responses across different stains.
G2C is optimized in a joint manner so as to facilitate the collaboration between generation and classification. How-ever, directly training everything from scratch may lead to difficulty in convergence. Therefore, we initialize each generator using CycleGAN (Zhu et al. 2017), an unpaired image-to-image translation algorithm, given weakly labeled training data, and fine-tune them with the classifier (initial-ized as random noise). Although this strategy may result in weaker authenticity of generated patches, it indeed enjoys higher classification accuracy, arguably because more effi-cient features are fed into the classifier.
We conduct experiments in two datasets for glomerulus classification and breast cancer classification, respectively. The first dataset provides a labeled image corpus in thePAS stain, and unlabeled ones in other three stains (e.g.,H&E, MASSON or PASM). We initialize the generators using a small portion of unlabeled data (known as the reference set), and then train G2C in labeled PASdata. G2C brings sig-nificant accuracy gain on glomerulus type classification, in-cluding distinguishing between normal and abnormal data, and discriminating two subtypes of abnormality. The sec-ond dataset only contains one (PAS) stain, so we directly start with the fine-tuning stage, using the pre-trained gener-ators from glomerulus data. Our approach significantly out-performs the state-of-the-arts, showing its satisfying trans-ferability across different diseases.
We further diagnose G2C with a few comparative
stud-ies.First, we individually analyze two stages, verifying that
each generator produces high-quality patches (even profes-sional doctors feel difficult in discriminating real and fake patches) and the classifier is an efficient solution in fusing visual information from multiple stains.Second, joint opti-mization over the generators and the classifier brings a con-sistent accuracy gain, verifying the value of coupling infor-mation.Third, the generation stage can be explained as an advanced way of data augmentation, which provides more constraints in other domains to alleviate over-fitting in the target domain.
In summary, the major contribution of this paper is to providean interpretable way of adding supervision from
other domains. Compared to the recent work (Shrivastava et
al. 2017) which aimed at improving the quality of generated images, our work provides an alternative idea,i.e., optimiz-ing the generator with the target vision. This paper shows an example in classification, yet it has a potential of being applied to other tasks such as object detection and semantic segmentation.
The remainder of this paper is organized as follows. We first briefly review related work, and then illustrate the
pro-posed generator-to-classifier (G2C) framework as well as the optimization method. After experimental results are shown (for glomerulus classification and breast cancer classifica-tion), we conclude this work in the final section.
Related Work
Computer-aided diagnosis (CAD) plays a central role in as-sisting human doctors for clinical purposes. One of the most important prerequisites of CAD is medical imaging analysis, which is aimed at processing and understanding CT, MRI and ultrasound images in order to diagnose human pathol-ogy. In comparison, the digital pathology (DP) provides more accurate imaging in a small region of body tissues. Re-cent years have witnessed an explosion in this field, which is widely considered as one of the most promising tech-niques in the diagnosis, prognosis and prediction of cancer and other important diseases. This paper studies glomerulus classification from DP images. This is a key technique in diagnosing nephropathy, one of the most common types of diseases in the world.
In the conventional literatures, people made use of hand-crafted features to capture discriminative patterns in digi-tal pathology images. For example, (Kakimoto et al. 2014) applied an SVM on top of the Rectangular Histogram-of-Gradients (R-HOG) features for glomerulus detection, and (Cruz-Roa et al. 2014) designed Fuzzy Color His-togram (FCH) features (Han and Ma 2002) to identify subcategories of breast cancer. Recently, the rapid devel-opment of deep learning brought more powerful and ef-ficient solutions. Especially, as one of the most impor-tant models in deep learning, the convolutional neural net-works (Krizhevsky, Sutskever, and Hinton 2012)(Simonyan and Zisserman 2015)(Szegedy et al. 2017) have been ap-plied to a wide range of tasks in medical imaging analysis, including classification (Gulshan et al. 2016) (Esteva et al. 2017) (Gallego et al. 2018), detection (Dou et al. 2016), seg-mentation (Ronneberger, Fischer, and Brox 2015),etc. In the field of DP image processing, (Liu et al. 2017) designed an automatic method to detect cancer metastases, which out-performed human doctors. (Chen et al. 2016) proposed a coarse-to-fine approach for mitosis detection. In (Janowczyk and Madabhushi 2016), a unified framework was presented for a series of tasks, including nuclei segmentation and mi-tosis detection. Our work is closely related to (Pedraza et al. 2017), which trained deep networks to outperform hand-crafted features in glomerulus classification.
𝑰𝟎 𝑰𝑴 𝑰𝟏 C o nc at 𝒈𝟏 𝒈𝑴 R e sBl o ck R e sBl o ck D e C o nv D e C o nv R e sBl o ck R e sBl o ck D e C o nv D e C o nv S te m S te m S te m FC A ve Po o l
classifier(shared weights) generators (individual weights)
original patch generated patches R e sBl o ck R e sBl o ck R e sBl o ck C ro ss -S ta in A tt e nt io n Bl o ck R e sBl o ck R e sBl o ck R e sBl o ck C ro ss -S ta in A tt e nt io n Bl o ck
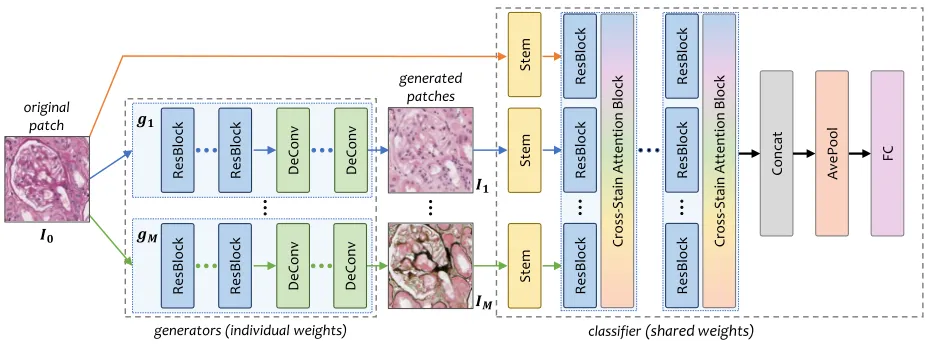
Figure 2: The overallgenerator-to-classifier(G2C) framework. The left part illustrates theM generators, and the right part theclassifier, in which allM+ 1branches share the same weights. When an input patch comes,mother stains are generated, and then combined with the original one for classification. The entire framework is end-to-end, and all the modules can be optimized in a joint manner.
Our Approach
Backgrounds
Staining is a popular way to highlight the important features of a soft tissue. Each staining method has both advantages and disadvantages (Fogo et al. 2014). For example, thePAS stains glomerular basement membranes, mesangial matrix and tubular basement membranes red (positive), while the PASMcolors the same component black, providing a clear contrast between positively and negatively staining struc-tures. Integrating multi-stained information is very impor-tant for pathology image analysis,e.g., for clinical purposes. However, in collecting a large dataset for glomerulus clas-sification, it is difficult to label each glomerulus under all staining methods, because (i) finding correspondence be-tween stains is labor-intensive, and (ii) only a small por-tion of glomeruli can be clearly seen in multiple stains1. Therefore, we set our goal to beglomerulus classification from single-stained inputs. To be specific, each input patch contains a glomerulus from the PAS stain. Meanwhile, a small corpus of100unlabeled patches is also provided for each stain (including thePASstain and other three stains). These four corpora form thereference setused for initializ-ing cross-stain generators.
Formulation
Let the input be a patchIsampled from a slide withPAS staining. The goal is to design a model M : t = f(I;θ), wheretis the class label, andθare the model parameters, e.g., the learnable weights in a convolutional neural network. Recall that our goal is to start with one stain, generate fake images for other stains, and finally make prediction based on
1
Each slide in digital pathology can be stained only once. Even if a set of neighboring slides containing the same glomerulus are used in various stains, its appearance may not be identical due to the difference in slicing positions.
all stains. We formulate the above flowchart into a joint op-timization task, in which a fewgeneratorsare first used to generate other stains (H&E,MASSONandPASM) from the inputPASstain, and aclassifierfollows to extract features from all these images and outputs the final prediction. Fol-lowing this, we decompose the functionf(·)into two stages taking charge of generation and classification, respectively. The overall flowchart is illustrated in Figure 2.
• The Generation Network
The first set of modules, namedgenerators, play the role of generating patches of different staining methods from the input patch I. We denote the generated patch set byI =
{I0,I1, . . . ,IM}, in whichI0
.
=Iis the source patch, and all otherMones are generated using a parameterized model
Im=gm (
I0;θGm )
,m= 1,2, . . . , M.
Each generator consists of several down-sampling units and the same number of up-sampling units. As the number of residual blocks increases, the classification accuracy goes up and gradually saturates. In practice, As a tradeoff between accuracy and efficiency, we use6resolution-preserved resid-ual blocks,2convolutional layers (kernel size is3, stride is
2) for down-sampling, and 2 deconvolution layers (kernel size is4, stride is2) for up-sampling. Following (Zhu et al. 2017), each convolutional layer is followed by an instance normalization layer.
• The Classification Network
The second module is named a classifier, which inte-grates information from all patches (one real and M gen-erated) for classification. We denote this stage as t =
c(I0,I1, . . . ,IM;θC )
.
Conceptually, the parameters θC need to capture visual properties from all stains. One choice is to train M + 1
parame-ters to the entire model. Another choice would be using the same set of parametersθCin each branch (this is reasonable as different stains share similar visual features), but allow-ing severalcross-stain attention blocksto swap information among different branches. As we shall detail below, these blocks are often equipped with a small amount of parame-ters, and, consequently, the number of parameters is reduced toO(M L′+L), in whichO(L′)is the number of param-eters of a cross-stain attention block andL′ ≪L. This re-duces the risk of over-fitting especially for small datasets.
Following this idea, the designed classifier is a multi-path model consisting of M + 1 branches, each of which is a variant of the deep residual network (He et al. 2016). A stem block (Szegedy et al. 2017) is used to replace the original
7×7convolutional layer2, followed by a few down-sampling units (3 residual blocks and a stride-2 pooling layer). A cross-stain attention block follows each residual block, in which we follow (Hu, Shen, and Sun 2018) to first down-sample neural responses from all stains (squeeze), then pass it throught two fully-connected layers, and multiply it to each channel of the original responses (excitation). Lastly, M+ 1feature vectors are concatenated, average-pooled and fully-connected to the final prediction layer.
In summary, the overall framework is a composed func-tion of the generator and the classifier,i.e.,
t=f(I;θ)=. c◦g
(
I;{θGm} M
m=1
,θC )
. (1)
Note that whenM = 0, our model degenerates to that using one single stain for classification. Sharing parameters over M+ 1branches enables us to fairly compare our model and the baselineat the classification stage. This idea also origi-nates from the doctors in our team, who suggests that differ-ent staining images provide complemdiffer-entary information in diagnosis, but the basic principles to recognize them should remain unchanged.
Optimization
We hope to jointly optimize Eqn (1) so as to enable the pa-rameters of the generators and the classifier to collaborate with each other. But, according to our motivation, the gen-erator should be able to produce some reasonable images corresponding to other staining methods. Therefore, we sug-gest a two-stage training process, in which we first train the generative networks using some unlabeled data covering dif-ferent stains, and then fine-tune the generator together with the classifier towards higher recognition accuracy.
• Initializing the Generators
Due to the lack of data correspondence, the generators are initialized by a task known as unpaired image-to-image translation.100 patches from the source stain and another
100 from the target stain are provided. Note that all these patches are unlabeled, and may even not contain glomeruli. We use a recent approach named CycleGAN (Zhu et al. 2017), which trains a reverse generator, denoted byˆgm, to
translate the patches generated by gm back to the source
2
Experiments show that using the stem block consistently im-proves classification accuracy by more than1%.
stain.gˆmshares the same structure withgm. We follow the
original implementation in setting hyper-parameters. Note that, if additional annotations on the target domains are available, we can use more accurate image-to-image translation algorithms such as (Isola et al. 2017) to initial-ize our model. In a high-level perspective, this initializa-tion process also eases the training stage by providing mid-level supervision, forcing the generator to produce reason-able patches, and reducing the risk of over-fitting a very deep network to a limited amount of training data.
• Fine-tuning Generators with the Classifier
In this stage, we train the classifier together with the gener-ators in a fully-supervised manner (each glomerulus is as-signed a class label). Our goal is no longer high-quality gen-eration, but accurate classification. Therefore, the reference set containing multi-stained, unlabeled data is not used, and all the generatorsgˆm,m= 1, . . . , M, are simply discarded.
In network training, we use Stochastic Gradient Descent with a momentum of0.5. We perform a total of30epochs. The learning rate is set to be0.01at the beginning, and di-vided by10after every5 epochs. In the first5 epochs, we freeze all parameters in the generators in order to initialize the classifier with fixed generated samples, so as to improve the stability in training. Note that freezing the generators in all30epochs leads to training the generators and the clas-sifier individually. We shall show in experiments that joint optimization leads to significant accuracy gain over all our generator-to-classifier models.
As we shall see in Table 1, the numbers of training data in different classes may be imbalanced. To prevent a cate-gory with fewer training samples from being swallowed by another category, we introduce the focal loss function (Lin et al. 2017) which brings slight but consistent accuracy gain in each individual classification task.
Why Our Approach Works?
It remains to discuss why our algorithm works well (see the next section for quantitative results). The key contribu-tion naturally comes from the ability of simulating differ-ent staining methods, and enabling jointly optimization so that the classifier takes advantage of complementary infor-mation. To confirm that these information comes from the authenticityof the generators, we perform a user study on the professional doctors in our team, and verify that it is even difficult for them to distinguish the generated patches from real ones.
ss gs noa Total Training 648 2,002 7,000 9,650
Testing 237 618 2,828 3,683
Total 885 2,620 9,828 13,333
Table 1: Number of annotated glomeruli of each subcate-gory in thePASstain. Thessandgscategories compose the high-level abnormal category, denoted bys.
data very well. Our algorithm, by introducing the knowledge from human doctors that other staining methods are help-ful to classification, forces the model to rely a great deal on multi-stained data. We believe this algorithm to endure fewer risks especially in the scenario of limited data. This is verified by investigating the over-fitting issue, shown in the diagnostic part, and transferring our models to another dataset for breast cancer classification, shown in the last part of our experiments.
Last but not least, although our approach can be explained as an advanced way of data augmentation, it introduces a complementary prior (with the help of an unlabeled refer-ence set) to conventional data augmentation (assuming that semantics of a patch remains unchanged when it is flipped, cropped,etc.). In experiments, we find that (1) our approach achieves much more accuracy gain than data augmentation, and (2) these two methods can be used together towards the best performance.
Experimental Results
Dataset and Settings
We collect a dataset for glomerulus classification. As far as we know, there is no public dataset for this purpose (existing ones (Pedraza et al. 2017) worked on glomerulus-vs-non-glomerulus classification). Our dataset is collected from209
patients, each of which has several slides from four staining methods, namelyPAS,H&E,MASSONandPASM. In allPAS slides, we ask the doctors to manually label a bounding box for each glomerulus, and annotate its subcategory. The doc-tors annotate with confidence,i.e., only thosePASpatches containing enough information to make decisions are pre-served. The subcategories includeglobal sclerosis(gs), seg-mental sclerosis(ss), and being normal (none of the above or noa). Global sclerosis and segmental sclerosis are two levels ofglomerulosclerosis(denoted bys). Advised by the doctors, we consider two classification tasks, dealing with s-vs-noaandgs-vs-ss, respectively. The first task is aimed at discriminating abnormal glomeruli from normal ones, and the second task goes one step further to determine abnor-mality of the abnormal glomeruli. To deal with imbalanced label distribution (see Table 1), we report category-averaged accuracies (Brodersen et al. 2010) in the following experi-ments.
All209patients in the dataset are split into a training set (149patients) and a testing set (60patients). There are in to-tal9,650annotated patches (each contains one glomerulus) in the training set and3,683in the testing set. The statistics of all subcategories are provided in Table 1. To initialize the
s noa Average
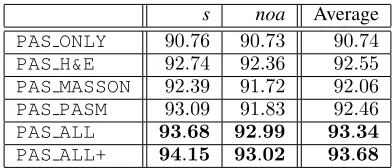
PAS ONLY 90.76 90.73 90.74 PAS H&E 92.74 92.36 92.55 PAS MASSON 92.39 91.72 92.06 PAS PASM 93.09 91.83 92.46 PAS ALL 93.68 92.99 93.34 PAS ALL+ 94.15 93.02 93.68
Table 2: Category-wise and averaged classification accu-racies (%) in the s-vs-noa task.PAS ALL+ indicates that cross-stain attention is added for feature re-weighting.
generators, we construct a reference set for each of the other stains by randomly cropping100patches from the unlabeled data. These patches may not contain a glomerulus, or con-tain a part of it, but as we shall see later, such weakly-labeled data are enough to train the generative networks.
Setting M = 0 leads to our baseline model in which only the PAS stain is used for classification. We denote it by PAS ONLY. We also provide several competitors, which differ from each other in the type(s) of stains gen-erated to assist classification. These variants are denoted byPAS H&E,PAS MASSON,PAS PASMandPAS ALL, re-spectively. Among which,PAS ALLintegrates information from all the other three stains,i.e.,M = 3.
In our dataset, there are much fewer abnormal glomeru-lus patches than normal ones. To prevent over-fitting, we perform data augmentation by (i) randomly flipping in-put patches vertically and/or horizontally, and (ii) perform-ing random color jitterperform-ing, includperform-ing changperform-ing the bright-ness and saturation of input patches. All input patches are rescaled into224×224, and pixel intensity values are nor-malized into[0,1].
Quantitative Results
Level-1 Classification:s-vs-noa We first evaluate
classi-fication accuracy in discriminating abnormal glomeruli (de-noted bys) from normal ones (denoted bynoa). Results are summarized in Table 2. One can observe that introducing additional stain(s) consistently improves classification accu-racy. An interesting but expected phenomenon emerges by looking into category-wise accuracies. For example, based on the PAS stain, addingH&E produces a higher classifi-cation rate in the normal (noa) category, while MASSON works better in finding abnormal (s) glomeruli. This sug-gests that different stains provide complementary informa-tion to assist diagnosis, and verifies the motivainforma-tion of this work. Therefore, it is not surprising that combining all other stains obtains consistent accuracy gain over other competi-tors. In particular, the PAS ALL model outperforms the PAS ONLYmodel by2.60%in the averaged accuracy, or a
28.08%relative drop in classification error. Our best model isPAS ALL+, which adds cross-stain attention and further improves classification accuracy. We will analyze the benefit of this module in the diagnostic part.
Level-2 Classification:ss-vs-gs Next, we further
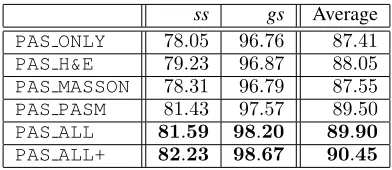
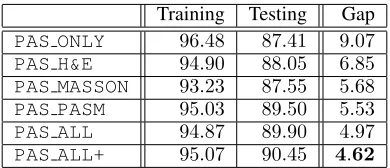
ss gs Average PAS ONLY 78.05 96.76 87.41 PAS H&E 79.23 96.87 88.05 PAS MASSON 78.31 96.79 87.55 PAS PASM 81.43 97.57 89.50 PAS ALL 81.59 98.20 89.90 PAS ALL+ 82.23 98.67 90.45
Table 3: Category-wise and averaged classification accura-cies (%) in thess-vs-gstask.PAS ALL+indicates that cross-stain attention is added for feature re-weighting.
investigating thess-vs-gsclassification task. Advised by the doctors in our team, we only consider those correctly cat-egorized abnormal patches in Level-1. Results are summa-rized in Table 3. Qualitative analysis gives similar conclu-sions,i.e., different stains provide complementary informa-tion, therefore it is instructive to combine all stains for ac-curate classification. It is worth noting that in these two ab-normal subcategories, segmental sclerosis (ss) suffers lower accuracy compared to global sclerosis (gs), which is partly caused by the limited amount and imbalance of training data. This is alleviated by incorporating generated patches from other stains as augmented data. Compared to PAS ONLY, thePAS ALLmodel significantly improves thess classifica-tion accuracy by3.54%, and the overall accuracy by2.49%
(a 19.78% relative drop in classification error). Similarly, PAS ALL+benefits from cross-stain attention and goes one step beyond equally weighting all stains (i.e.,PAS ALL).
We perform statistical tests on the two tasks, reporting thatPAS ALLoutperformsPAS ONLYsignificantly with p-value of0.011and0.0014in thes-vs-noatask andss-vs-gs task, respectively.
Discussions
This part provides several discussions on our approach. First we observe the performance of two stages (generation and classification) individually, and then we discuss the benefit of joint optimization and how our approach helps to allevi-ate over-fitting especially in small datasets. We also show a comparison with conventional data augmentation strategies.
• Qualitative Studies on the Generators
To confirm the authenticity of the generated patches, we per-form a study by asking the doctors in our team to discrim-inate the generated patches from the real ones. We sample
50patches from all the generated ones, combine them with
50real patches, show them one-by-one to the pathologists and record their judgments. The average accuracy over three pathologists is70.0%(random guess reports50%), suggest-ing an acceptable quality to professional doctors.
Figure 3 shows several examples in which glomeruli are misclassified using thePASstain alone, and rescued by the generated stains. We note that each failure case inPAScan be helped by one or a few other stains. In clinics, these gen-erated patches may also assist doctors in case that a PAS patch does not contain sufficient information.
• The Design of Classifier
PAS +H&E +MASSON +PASM
original patches generated patches
s vs noa
s vs noa
ss vs gs
ss vs gs task
s
noa
ss
gs label
Figure 3: Different stains provide complementary infor-mation to assist glomerulus classification. In each row, the original patch is mis-classified using the PAS stain alone (marked by a cross), but turned into correctness after inte-grating some of other generated stains (marked by a tick).
All these glomeruli are correctly classified using all four
stains (i.e.,PAS ALLandPAS ALL+).
To reduce the number of parameters, we share parameters among different branches of the classifier, which is based on the assumption that visual features extracted from differ-ent stains are mostly similar. The rationality of this assump-tion is verified by the results in Tables 2 and 3. Moreover, adding cross-stain attention blocks consistently boosts per-formance of a multi-branch classifier,e.g., the overall error drop is 0.34% (5.10% relatively) and0.55% (5.44% rela-tively) for two tasks, respectively. Note that this is achieved by adding merely5.27%more parameters to the classifier.
We also evaluate the use of cross-stain attention blocks in the scenario of fewer branches, and observe smaller im-provement,e.g., on top ofPAS ONLY, the overall accuracy gain is 0.30% and 0.09%, respectively. This suggests the existence of cross-domain feature difference, yet a light-weighted module is sufficient in dealing with it.
• The Benefit of Joint Optimization
In addition, joint optimization brings significant gain in clas-sification accuracy. In comparison to the model in which the generators and the classifier are optimized individually (i.e., the weights of the generators are frozen throughout the fine-tuning stage), the jointly optimized models (PAS ALL) achieve 1.10% and 1.54% boosts on s-vs-noa and ss-vs-gsclassification, respectively. In particular, the error of the most challengingssclass is reduced from20.68%to18.41%
(2.27%absolute or10.98%relative drop).
• The Over-fitting Issue
sam-Training Testing Gap PAS ONLY 96.48 87.41 9.07 PAS H&E 94.90 88.05 6.85 PAS MASSON 93.23 87.55 5.68 PAS PASM 95.03 89.50 5.53 PAS ALL 94.87 89.90 4.97 PAS ALL+ 95.07 90.45 4.62
Table 4: For different models onss-vs-gsclassification, we report training and testing accuracy as well as the gap be-tween them.PAS ALL+indicates that cross-stain attention is added for feature re-weighting.
F1-score Accuracy (%)
(Han and Ma 2002) 0.675 78.7
(Cruz-Roa et al. 2014) 0.718 84.23
(Janowczyk et al. 2016) 0.765 84.68
Ours (PAS ALL+) 0.841 88.28
Table 5: Comparison of F1-scores and balanced accuracies on the breast cancer classification task. [Janowczyket al., 2016] is the baseline (i.e.,PAS ONLY).
ples for the ss subcategory. Considerable over-fitting may arise because the testing set contains some cases which are not covered by the training set.
Generating patches in other stains alleviates over-fitting to some extents. It provides complementary information to geometry-based data augmentation such as flip and rotation, as the generators bring in somepriorslearned from the ref-erence sets (100×3 unlabeled patches from other stains), forcing the training data to be explained in a more reasonable manner. To verify this, we record both training and testing accuracies for each of the five models forss-vs-gs classifica-tion in Table 4. Using multiple stains leads to a higher testing accuracy but a lower training accuracy, which is the conse-quence of a stronger constraint (multiple stains need to be explained collaboratively) in training deep neural networks.
• Comparison with data augmentation
To compare with conventional data augmentation meth-ods, we conduct a comparative experiment on thess-vs-gs task. In Table 3, we apply data augmentation toPAS ONLY, while all the other models are trained without data aug-mentation. We also train thePAS ONLYwithout data aug-mentation and get an accuracy at86.21%. As shown in Ta-ble 3, the accuracies ofPAS ONLYwith data augmentation andPAS ALL+are87.41%and90.45%, respectively. Our methodPAS ALL+improves the accuracy by4.24%while the data augmentation improves the accuracy by 1.20%, which indicates that our method outperforms conventional data augmentation.
Transferring to Breast Cancer Classification
To further demonstrate the effectiveness of our approach, we apply it to a publicly available dataset for invasive duc-tal carcinoma (IDC) classification3, which contains277,524
3
http://www.andrewjanowczyk.com/
PAS +H&E +MASSON +PASM
original patches generated patches
IDC
Non-IDC
Non-IDC
IDC label
Figure 4: Different stains provide complementary informa-tion to assist breast cancer classificainforma-tion. In each row, the original patch is mis-classified using the PAS stain alone (marked by a cross), but turned into correctness after inte-grating some of other generated stains (marked by a tick).
All these patches are correctly classified using all four
stains (i.e.,PAS ALLandPAS ALL+).
patches of 50 × 50 pixels (198,738 IDC-negative and
78,786IDC-positive). To make a fair comparison, we repro-duce (Janowczyk and Madabhushi 2016) with the same net-work architecture (AlexNet) on thePASstain alone (base-line model). As all patches in this dataset arePAS-stained, we do not train new generators from scratch, but simply transfer the pre-trained ones from our dataset, and fine-tune them with the new classifier. We apply our best configuration learned from the previous task, namely, using all four stains and adding cross-stain attentions. This model is denoted by PAS ALL+.
Results are shown in Table 5. In terms of both F1-score and classification accuracy, our approach significantly out-performs (Janowczyk and Madabhushi 2016), as well as two previous methods with handcrafted features (Han and Ma 2002) and relatively shallow CNNs (Cruz-Roa et al. 2014). Similarly, we visualize some examples in Figure 4.
Hence, we conclude on the effectiveness of our train-ing strategy. The first stage,i.e., initializing the generators, can be performed in a fixed reference set (e.g., containing glomeruli); when another dataset is available, we can di-rectly move on to the second stage,i.e., fine-tuning a new classifier with these generators.
Conclusions
gen-erators and a classifier to collaborate in both training
and testing. A large dataset is collected by the doctors in
our team, which is much larger than any publicly available ones. Our approach achieves considerably higher accuracies over the baseline, and transfers reasonably well to another digital pathology dataset for breast cancer classification.
This research paves a new way of data enhancement in medical imaging analysis, which is more advanced com-plementary to conventional data augmentation. Transferring this idea to other types of data generation,e.g., integrating CT scans from thearterial phaseand thevenous phasefor organ segmentation, is promising and implies a wide range of clinical applications.
Acknowledgments
Bingzhe Wu and Guangyu Sun are supported by National Natural Science Foundation of China (No.61572045).
References
Brodersen, K.; Ong, C.; Stephan, K.; and Buhmann, J. 2010. The balanced accuracy and its posterior distribution. In ICPR.
Chen, H.; Dou, Q.; Wang, X.; Qin, J.; Heng, P.; et al. 2016. Mitosis detection in breast cancer histology images via deep cascaded networks. InAAAI.
Cruz-Roa, A.; Basavanhally, A.; Gonz´alez, F.; Gilmore, H.; Feldman, M.; et al. 2014. Automatic detection of invasive ductal carcinoma in whole slide images with convolutional neural networks. InSPIE.
Dou, Q.; Chen, H.; Yu, L.; Zhao, L.; Qin, J.; et al. 2016. Automatic detection of cerebral microbleeds from mr im-ages via 3d convolutional neural networks.TMI35(5):1182– 1195.
Esteva, A.; Kuprel, B.; Novoa, R.; Ko, J.; Swetter, S.; et al. 2017. Dermatologist-level classification of skin cancer with deep neural networks. Nature542(7639):115–118.
Fogo, A.; Cohen, A.; Colvin, R.; Jennette, J. C.; and Alpers, C. 2014.Fundamentals of Renal Pathology. Springer. Gallego, J.; Pedraza, A.; Lopez, S.; Steiner, G.; Gonzalez, L.; Laurinavicius, A.; and Bueno, G. 2018. Glomerulus classification and detection based on convolutional neural networks. Journal of Imaging4(1).
Goodfellow, I.; Pouget-Abadie, J.; Mirza, M.; Xu, B.; Warde-Farley, D.; Ozair, S.; Courville, A.; and Bengio, Y. 2014. Generative adversarial nets. InNIPS.
Gulshan, V.; Peng, L.; Coram, M.; Stumpe, M.; Wu, D.; et al. 2016. Development and validation of a deep learning algo-rithm for detection of diabetic retinopathy in retinal fundus photographs.JAMA304(6):649–656.
Han, J., and Ma, K. 2002. Fuzzy color histogram and its use in color image retrieval.TIP11(8):944–952.
He, K.; Zhang, X.; Ren, S.; and Sun, J. 2016. Deep residual learning for image recognition. InCVPR.
Hu, J.; Shen, L.; and Sun, G. 2018. Squeeze-and-excitation networks. InCVPR.
Isola, P.; Zhu, J.; Zhou, T.; and Efros, A. 2017. Image-to-image translation with conditional adversarial networks. In CVPR.
Janowczyk, A., and Madabhushi, A. 2016. Deep learning for digital pathology image analysis: A comprehensive tutorial with selected use cases. JPI7(1):29.
Kakimoto, T.; Okada, K.; Hirohashi, Y.; Relator, R.; Kawai, M.; et al. 2014. Automated image analysis of a glomeru-lar injury marker desmin in spontaneously diabetic torii rats treated with losartan. Journal of Endocrinology222(1):43– 51.
Kim, T.; Cha, M.; Kim, H.; Lee, J.; and Kim, J. 2017. Learn-ing to discover cross-domain relations with generative ad-versarial networks. InICML.
Krizhevsky, A.; Sutskever, I.; and Hinton, G. 2012. Im-agenet classification with deep convolutional neural net-works. InNIPS.
Levin, A.; Tonelli, M.; Bonventre, J.; Coresh, J.; Donner, J.; Fogo, A.; et al. 2017. Global kidney health 2017 and beyond: A roadmap for closing gaps in care, research, and policy. The Lancet390(10105):1888–1917.
Lin, T.; Goyal, P.; Girshick, R.; He, K.; and Doll´ar, P. 2017. Focal loss for dense object detection. InICCV.
Liu, Y.; Gadepalli, K.; Norouzi, M.; Dahl, G.; Kohlberger, T.; Boyko, A.; Venugopalan, S.; Timofeev, A.; Nelson, P.; Corrado, G.; et al. 2017. Detecting cancer metastases on gigapixel pathology images. InCoRR.
Liu, M.; Breuel, T.; and Kautz, J. 2017. Unsupervised image-to-image translation networks. InNIPS.
Pedraza, A.; Gallego, J.; Lopez, S.; Gonzalez, L.; Laurinavi-cius, A.; and Bueno, G. 2017. Glomerulus classification with convolutional neural networks. InMIUA.
Ronneberger, O.; Fischer, P.; and Brox, T. 2015. U-net: Convolutional networks for biomedical image segmentation. InMICCAI.
Shrivastava, A.; Pfister, T.; Tuzel, O.; Susskind, J.; Wang, W.; and Webb, R. 2017. Learning from simulated and unsu-pervised images through adversarial training. InCVPR. Simonyan, K., and Zisserman, A. 2015. Very deep convolu-tional networks for large-scale image recognition. InICLR. Szegedy, C.; Ioffe, S.; Vanhoucke, V.; and Alemi, A. 2017. Inception-v4, inception-resnet and the impact of residual connections on learning. InAAAI.