R E S E A R C H
Open Access
Does white-tailed deer density affect tree
stocking in forests of the Eastern United
States?
Brice B. Hanberry
1*and Marc D. Abrams
2Abstract
Background:White-tailed deer (Odocoileus virginianus) have increased during the past century in the USA. Greater deer densities may reduce tree regeneration, leading to forests that are understocked, where growing space is not filled completely by trees. Despite deer pressure, a major transition in eastern forests has resulted in increased tree densities.
Methods:To reconcile conflicting trends, we applied generalized linear mixed models to compare deer densities during 1982 and then 1996 to tree stocking after about 30 years and 15 years of potential reductions of small trees by deer, for the entire eastern US and 11 ecological provinces. We also compiled deer browse preferences and compared preferred browse with trends in tree species composition from historical (1620–1900) and current tree surveys.
Results:The forested area of the eastern US, including a prairie ecological province, was equally well-stocked (52%) and understocked (48%) during 2011–2017 tree surveys. For 1982 deer densities, 38% of area had deer densities > 5.8 deer/km2 and for 1996, 66% of area had deer densities > 5.8 deer/km2. Deer densities and tree stocking were not related significantly for the entire eastern US. Deer may reduce tree stocking in the Laurentian Mixed Forest; however, this province had both lower deer densities and greater tree stocking than other provinces. Furthermore, major tree species trends did not match tree browse preferences.
Conclusions:Rather than too few trees, too many trees is an ecological problem where historical open oak and pine forests had herbaceous understories, and currently, trees have captured growing space. We attribute other drivers than deer to explain this transition.
Keywords:Driver, Fire, Herbivory, Open forests, Transition, Tree density
Introduction
White-tailed deer (Odocoileus virginianus) densities have increased during the past century in the USA from near extirpation to within historical values, with estimates ran-ging widely from 10 million to 80 million animals (McCabe and McCabe 1984; Miller et al. 2003; VerCauteren 2003; Adams and Hamilton 2011). After Euro-American settle-ment, market hunting drove the population to perhaps < 500,000 animals by the late 1800s (McCabe and McCabe 1984; Miller et al. 2003; VerCauteren 2003). Commercial
hunting ended due to limited deer numbers, changed pub-lic attitudes, enforced state harvest restrictions, and the federal Lacey Act of 1900, which banned interstate ship-ment of illegally caught animals. Leopold et al. (1947) pre-sented a US map where deer primarily were absent or rare, albeit with local “problem” areas, after which the deer population started to recover and expand. Currently, the population may have returned to about 30 million animals (McCabe and McCabe1984; Miller et al.2003; VerCaute-ren2003). Predator control, minimal doe harvest, and ac-cess to crops and food plots have offset negative impacts resulting from urbanization and industrialization. However, since 2006, habitat loss and degradation, hunting pressure,
© The Author(s). 2019Open AccessThis article is distributed under the terms of the Creative Commons Attribution 4.0 International License (http://creativecommons.org/licenses/by/4.0/), which permits unrestricted use, distribution, and reproduction in any medium, provided you give appropriate credit to the original author(s) and the source, provide a link to the Creative Commons license, and indicate if changes were made.
* Correspondence:[email protected]
1USDA Forest Service, Rocky Mountain Research Station, Rapid City, SD 57702, USA
severe weather events, and disease may be decreasing deer populations (Webb2014).
Overall, research indicates that deer reduce regener-ation of tree seedlings (Bakker et al. 2016). Great deer densities create the potential for deer to influence plant
species composition and abundance by reducing
survival, growth, reproduction, and continued species recruitment of preferred browse. Because of browsing pressure, conifers such as northern white cedar (Thuja occidentalis) and eastern hemlock (Tsuga canadensis) in northern mixed forests of the Great Lake states and oaks and maples in eastern broadleaf forests may not be re-generating (Rooney 2001; Russell et al. 2001; Côté et al. 2004). Browsed species may be affected at deer densities of 3–9 deer/km2 (Alverson et al. 1988; Russell et al. 2001; McShea 2012; Russell et al. 2017a; Ramirez et al. 2018). Intensive deer browsing may shift the understory toward ferns, sedges, and browse-tolerant or non-palatable herbs and shrubs, particularly invasive species (Royo and Carson2006; Abrams and Johnson2012).
Limited research about deer impacts on tree densities at landscape scales tends to focus on deer effects on seed-lings and sapseed-lings, which may not transfer ultimately to ef-fects on larger diameter tree species, because most smaller size classes will not survive competition for grow-ing space. Didier and Porter (2003) determined that high deer densities were not related to poor maple reproductive success in northern New York. Bradshaw and Waller (2016) showed that deer reduced saplings of all tree spe-cies except spruce and fir across northern Wisconsin. Rus-sell et al. (2017a) found that tree seedling abundance generally decreased as deer density increased above 5.8 deer/km2, excluding oak forests, in the northern US. Rus-sell et al. (2017b) modeled recruitment dynamics of sap-lings and overstory trees and showed that stands with very high browse impact would contain 50% fewer saplings and 17% fewer overstory trees in the northern US. McWilliams et al. (2018) summarized that 59% of 74 million forestland hectares had moderate or high browse impacts in the Midwest and Northeast, with 79% moderate or high browse impacts in the Mid-Atlantic region; 65–70% of oak/hickory and maple/beech/birch forest-type groups had signs of moderate or high browse impacts.
However, herbivory by native species has influenced plant composition for millions of years. Most studies have been published where browsing pressure is evident, but studies also show minimal impact of deer on vegetation or at least slow response of plants to deer exclusion (Alverson et al.1988; Didier and Porter2003; Kraft et al.2004; Holla-day et al.2006; Collard et al.2010; Hanberry et al.,2014b). Given bias against publication of negative results, add-itional unpublished studies likely show minimal influence by deer. Compared to high deer densities, which may be relatively similar to historical densities, fire exclusion,
logging, forest fragmentation, land conversion to agricul-ture, wetland drainage and altered hydrology, and other land use changes have occurred during the past 150 years that are unprecedented.
The onset of major changes in forests of the eastern US coincided with reductions in deer densities during the late 1800s and early 1900s. Open oak and pine forests, with a sparsely treed overstory and herbaceous understory, which historically covered the central and southern regions of the eastern US, have transitioned to dense forests with trees throughout the vertical profile, composed of many eastern broadleaf tree species (Nowacki and Abrams2008, Hanberry et al., 2014a, b, Hanberry and Nowacki 2016, Hanberry and Abrams 2018). Frequent, low to moderate severity fire, acting like a browser, removed tree seedlings, although fire variation allowed some fire-tolerant oak and pine species to survive (Hanberry et al.2018a). Fire exclu-sion began during the first half of the 1900s, releasing other eastern tree species to establish throughout histor-ical oak and pine forests and increasing tree densities, resulting in capture by trees of growing space historically occupied by herbaceous plants.
Therefore, a question to consider may be whether deer densities great enough to prevent tree regeneration are an ecological problem or a helpful tool for management and restoration (Fløjgaard et al. 2018). Loss of open forests probably has resulted in declines in associated species, such as herbaceous plants, pollinators, and birds (e.g., Hanberry and Thompson2019). Prevention of tree regeneration to maintain or restore open forests is a dif-ficult task that requires a great investment in manage-ment resources, and deer may provide assistance in controlling tree regeneration through tree consumption (e.g., Hanberry and Thompson2019).
have full site occupancy at approximate 60% stocking (see Arner et al. (2001) for development of equations and species-specific coefficients; Hanberry et al.,2014a). Lower, understocked values indicate that tree recruitment has not reached full potential, whereas absolute measures such as density or basal area do not provide information about what percent of the growth potential is achieved. Specific-ally, we calculated percent of forestland area in each county that was understocked (< 60% stocked). Larger trees contribute most to stocking and thus, deer reduc-tions of seedlings and saplings will not manifest in for-est stocking measures until future years. To account for time lag of effects, we used deer densities during ap-proximately both 1982 and 1996 and most recent tree stocking measurements after about 30 years and 15 years of deer browsing. We also compiled reports of deer browse preferences and examined trends in tree species composition relative to browsing preference since the 1800s to detect relationships. If deer control tree regeneration, preferred tree species generally should exhibit declines relative to non-preferred tree species. Lastly, we explored the contradiction between high deer densities and increased tree densities during the twentieth century.
Methods
17.4 deer/km2), except we used a value of 1.85 deer/km2 for the low-density class and then divided by total area.
We used FIA Evalidator (USDA Forest Service, Forest Inventory and Analysis Program (2018)) to quantify per-cent forestland area by county for each stocking group, where stocking is the percent occupancy of growing space by trees. Stocking groups were overstocked (≥ 100%), fully stocked (60–99%), medium stocked (35– 59%), poorly stocked (10–34%), and nonstocked (0–9%). We calculated percent of forestland area in each county that was understocked (< 60% stocked), or a combin-ation of the medium, poorly, and nonstocked groups, which represents where growing space is unfilled by trees. We note that due to a normal distribution, this
and thus, older trees experienced less deer pressure than younger trees.
We applied generalized linear mixed models (SAS Proc Glimmix; SAS software, version 9.4, Cary, North Carolina, USA) to compare deer density classes to per-cent of understocked forestland area by county for the eastern US and for each ecological province. Because understocked area of a county was a proportion, we used the beta distribution, with the logit function. A random variable of US state, with the variance components co-variance structure, improved model fit.
We then developed a table (Table3) to identify a pat-tern between preferred tree browse and long-term tree compositional trends for major tree genera/species. We used deer browse preferences in the southern, central, and northeastern US, based on reports by Warren and Hurst (1981), Latham et al. (2005), and Rawinski (2014). We also determined increasing and decreasing tree gen-era or species trends, based on percent of all trees that each species represented in historical (1620–1900) and current tree surveys (2011–2017; e.g., Abrams 2001; Hanberry and Nowacki 2016; USDA Forest Inventory and Analysis, FIA DataMart,www.fia.fs.fed.us/tools-data, Bechtold and Patterson2005).
Results
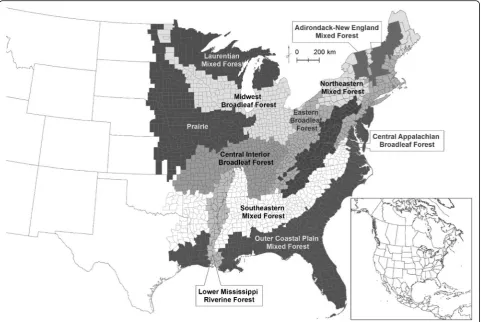
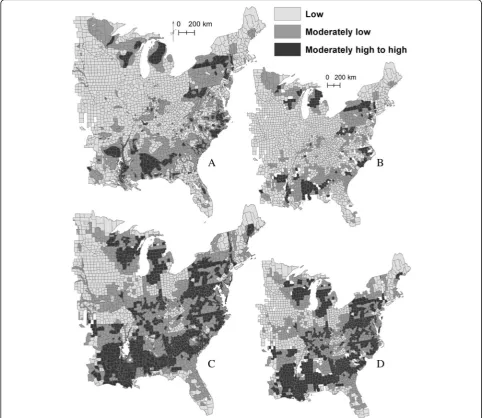
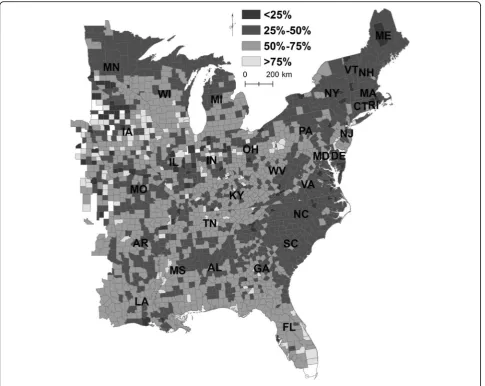
For 1982 deer densities, approximate mean density was 4.0 deer/km2for the eastern US. Of 2043 counties with major-ity deer densmajor-ity classes, 66% of counties had low densities of < 5.8 deer/km2and 25% of counties had moderately low densities of 5.8–11.6 deer/km2(Fig.2). For 1996 deer dens-ities, approximate mean density was 6.9 deer/km2. Of 2254 counties with majority deer density classes, 34% of counties had low densities of < 5.8 deer/km2and 35% of counties had moderately low densities of 5.8–11.6 deer/km2(Fig.2). These values were the same before assigning a majority to each class for 1996 deer densities, but for 1982 deer dens-ities, 62% of counties had low densities before assignment. There were 2109 counties with percent stocking informa-tion for the eastern US (Fig.1), and 48% of forested area (weighted by county area) was understocked (Fig. 3). Understocked counties and low deer densities were more frequent in interior states (Figs.2and3).
For the entire eastern US, deer density and percent of forestland area that was understocked were not signifi-cantly related during 1982 (P= 0.9105 for 1972 counties) and 1996 (P= 0.8853 for 2186 counties). The mean per-cent of understocked forest was 52%, 48%, and 49% for each increasing 1982 deer density class, respectively (i.e., low, moderately low, and moderately high and high), and 50% for all 1996 density classes.
For 1982 deer densities, of the ten provinces with three deer density classes (i.e., the Prairie province only had low deer density), the Laurentian Mixed Forest (P=
0.0007) and Central Appalachian Broadleaf Forest (P = 0.0027) had significant relationships between deer dens-ity and percent understocking (Table1). For the Lauren-tian Mixed Forest, counties with low deer densities had the least percent understocked forest (39%), compared to about 45% understocking at greater deer densities, i.e., an indication that deer may be reducing tree growth in forests. For the Central Appalachian Broadleaf Forest, counties with low deer densities had greatest percent understocking.
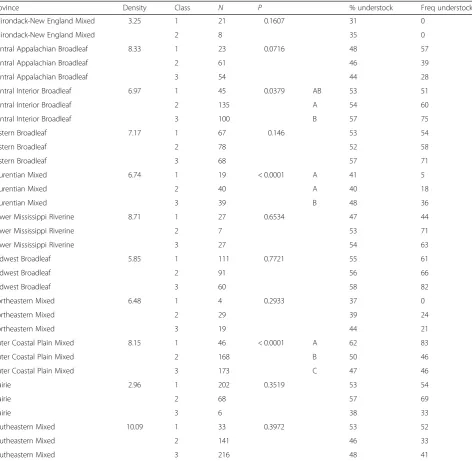
For 1996 deer densities, out of eleven provinces, the Laurentian Mixed Forest (P < 0.0001), Central Interior Broadleaf Forest (P = 0.0379), and Outer Coastal Plain Mixed Forest (P< 0.0001) had significant relationships be-tween deer density and percent understocking (Table 2). For the Laurentian Mixed Forest, counties with low and moderately low deer densities had the least percent under-stocked forest (40%) compared to 48% understocking at the greatest deer density. For the Central Interior Broad-leaf Forest, counties with moderately low deer densities had 54% percent understocking compared to counties with moderately high to high deer densities at 57% per-cent understocking. For the Outer Coastal Plain Mixed Forest, counties with lower deer densities had greater per-cent understocking.
Tree genera or species that are decreasing in the east-ern US equally were preferred and not preferred by deer in northeastern forests, with low to high use in central forests, and low to moderate use in southern forests (Table 3). There were more increasing genera/species, which generally were preferred by deer in northeastern forests. Use of increasing genera/species by deer varied from low to high in central forests and typically was low to moderate in southern forests.
Discussion
The two to three of 11 provinces with significant differ-ences in percent forested area of understocking among deer density classes showed inconsistent deer density ef-fects, with both increased and decreased area of under-stocked forest at lower deer densities. Indeed, where mean deer densities were greatest (10 deer/km2) in the South-eastern Mixed Forest province, percent area of under-stocked forest decreased with increasing deer density, albeit not significantly. Southern forests had greatest deer densities and about 50% of forested area that was under-stocked. Provinces with the lowest deer densities (< 7.5 deer/km2) for 1996 had the greatest range in percent area of understocking (32–56%); northern forests (Laurentian Mixed Forest, Northeastern Mixed Forest, Adirondack-New England Mixed Forest) had the lowest percent area of understocking, and most of the central broadleaf forests (Central Interior Broadleaf Forest, Eastern Broadleaf For-est, and Midwest Broadleaf Forest) and Prairie had the greatest area of understocking. In general, most provinces
had a trend of slightly increased area of percent area of understocking as deer densities increased, but area of understocked forest did not vary by more than five per-centage points among the three deer density classes. This difference is not likely to be ecologically significant or no-ticeable at landscape scales.
high (Hanberry and He 2015). Land use for forest prod-ucts rather than deer use may be affecting stocking (Han-berry and He 2015). Other authors have found stronger effects by forest harvest and gap size than herbivory (Kraft et al.2004; Holladay et al.2006).
Deer effects may be significant enough at some sites during some years to be a local driver of reduced tree stocking. However, research areas have been selected in forests of the eastern US where deer effects are present and thus do not provide an explanation for regional deer
density and stocking levels or for overstocked or fully stocked canopy classes in counties with high deer dens-ities, which occur in all provinces (Tables1and2). Most studies that have demonstrated evidence of localized deer effects have not occurred in southern forests, where deer densities are the greatest at regional scales and where Hanberry et al. (b) did not detect differences beyond random chance for tree species and hundreds of plant species in Mississippi after 5 years of deer exclosure.
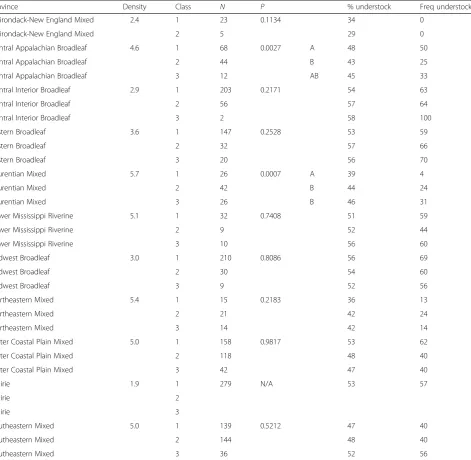
Table 1For 1982 deer densities, mean estimated deer density (deer/km2), deer density classes (1 < 5.8 deer/km2, 2 = 5.8 to 11.6 deer/km2, 3 > 11.6 deer/km2), sample size,Pvalue, and mean comparisons for significant results of generalized linear mixed models of deer density class to percent of understocked forestland area by county, mean percent of understocked forestland area, and frequency of counties with≥50% of area understocked
Province Density Class N P % understock Freq understock
Adirondack-New England Mixed 2.4 1 23 0.1134 34 0
Adirondack-New England Mixed 2 5 29 0
Central Appalachian Broadleaf 4.6 1 68 0.0027 A 48 50
Central Appalachian Broadleaf 2 44 B 43 25
Central Appalachian Broadleaf 3 12 AB 45 33
Central Interior Broadleaf 2.9 1 203 0.2171 54 63
Central Interior Broadleaf 2 56 57 64
Central Interior Broadleaf 3 2 58 100
Eastern Broadleaf 3.6 1 147 0.2528 53 59
Eastern Broadleaf 2 32 57 66
Eastern Broadleaf 3 20 56 70
Laurentian Mixed 5.7 1 26 0.0007 A 39 4
Laurentian Mixed 2 42 B 44 24
Laurentian Mixed 3 26 B 46 31
Lower Mississippi Riverine 5.1 1 32 0.7408 51 59
Lower Mississippi Riverine 2 9 52 44
Lower Mississippi Riverine 3 10 56 60
Midwest Broadleaf 3.0 1 210 0.8086 56 69
Midwest Broadleaf 2 30 54 60
Midwest Broadleaf 3 9 52 56
Northeastern Mixed 5.4 1 15 0.2183 36 13
Northeastern Mixed 2 21 42 24
Northeastern Mixed 3 14 42 14
Outer Coastal Plain Mixed 5.0 1 158 0.9817 53 62
Outer Coastal Plain Mixed 2 118 48 40
Outer Coastal Plain Mixed 3 42 47 40
Prairie 1.9 1 279 N/A 53 57
Prairie 2
Prairie 3
Southeastern Mixed 5.0 1 139 0.5212 47 40
Southeastern Mixed 2 144 48 40
There appear to be numerous reasons why it is unlikely that deer cause region-wide, systematic forest changes, which are more likely to arise from a constant and cumula-tive mechanism, rather than contradictory local variation. Deer densities, browsing pressure, and plant response do not have consistent relationships across locations, because they vary with plant composition and abundance, browsing tolerance, and available resources, in addition to varied daily, seasonal, and yearly use (Russell et al. 2001). Although deer may interfere with seedling and sapling
recruitment of tree species (Russell et al.2001; Abrams and Johnson2012), most seedlings and saplings will not survive to reach the overstory; thus, tree mortality is compensatory (i.e., density dependent) rather than additive (due to consumption).
Tree species composition and the herbaceous understory As a supporting line of evidence, we additionally pared deer browse preferences and changes in tree com-position since the 1800s. Regions have different plant Table 2For 1996 deer densities, mean estimated deer density (deer/km2), deer density classes (1 < 5.8 deer/km2, 2 = 5.8 to 11.6 deer/km2, 3 > 11.6 deer/km2), sample size,Pvalue, and mean comparisons for significant results of generalized linear mixed models of deer density class to percent of understocked forestland area by county, mean percent of understocked forestland area, and frequency of counties with≥50% of area understocked
Province Density Class N P % understock Freq understock
Adirondack-New England Mixed 3.25 1 21 0.1607 31 0
Adirondack-New England Mixed 2 8 35 0
Central Appalachian Broadleaf 8.33 1 23 0.0716 48 57
Central Appalachian Broadleaf 2 61 46 39
Central Appalachian Broadleaf 3 54 44 28
Central Interior Broadleaf 6.97 1 45 0.0379 AB 53 51
Central Interior Broadleaf 2 135 A 54 60
Central Interior Broadleaf 3 100 B 57 75
Eastern Broadleaf 7.17 1 67 0.146 53 54
Eastern Broadleaf 2 78 52 58
Eastern Broadleaf 3 68 57 71
Laurentian Mixed 6.74 1 19 < 0.0001 A 41 5
Laurentian Mixed 2 40 A 40 18
Laurentian Mixed 3 39 B 48 36
Lower Mississippi Riverine 8.71 1 27 0.6534 47 44
Lower Mississippi Riverine 2 7 53 71
Lower Mississippi Riverine 3 27 54 63
Midwest Broadleaf 5.85 1 111 0.7721 55 61
Midwest Broadleaf 2 91 56 66
Midwest Broadleaf 3 60 58 82
Northeastern Mixed 6.48 1 4 0.2933 37 0
Northeastern Mixed 2 29 39 24
Northeastern Mixed 3 19 44 21
Outer Coastal Plain Mixed 8.15 1 46 < 0.0001 A 62 83
Outer Coastal Plain Mixed 2 168 B 50 46
Outer Coastal Plain Mixed 3 173 C 47 46
Prairie 2.96 1 202 0.3519 53 54
Prairie 2 68 57 69
Prairie 3 6 38 33
Southeastern Mixed 10.09 1 33 0.3972 53 52
Southeastern Mixed 2 141 46 33
communities and deer browse preferences vary with plant communities, availability, seasonality, and other factors (Table 3; Warren and Hurst 1981; Latham et al. 2005; Rawinski 2014). Differences in deer densities and browse availability make reports of palatability conflict-ing or at least seasonally variable even within a region. For example, Latham et al. (2005) and Rawinski (2014) stated that red and sugar maples were used by deer in Pennsylvania and northeastern forests (primarily New York and New England), whereas Kittredge and Ashton (1995) reported that red maple was avoided in New England. Whitney (1984) also ascribed increased number of white pine, birch, oak, black cherry, and red maple to browsing of other species in Pennsylvania. Furthermore, deer may prefer seeds, seedlings and sprouts, tree foli-age, or tree twigs and buds.
If deer control tree regeneration, preferred tree species generally should decline relative to non-preferred tree species. In eastern forests with high deer densities, both decreasing and increasing tree species are favored browse for deer (Table 3; Russell et al. 2001; Côté et al. 2004). Thus, deer densities do not explain compositional shifts between historical and current forests. Generally, most tree genera, whether preferred or not by deer, have increased in the eastern US during the past century (Table 3). Notable exceptions include fire-tolerant oaks
and pines, American chestnut (Castanea dentata), and slow-growing American beech and eastern hemlock, which successfully recruited for thousands of years under pressure from herbivores, but have decreased dur-ing the past century (Whitney1990; Abrams2003; Now-acki and Abrams2008; Hanberry and Nowacki 2016). It seems more probable that declines are due to changing land use and to forest health issues such as chestnut blight (Cryphonectria parasitica), beech bark disease, and hemlock woolly adelgid (Adelges tsugae) rather than a brief cessation in browsing pressure. Complex interac-tions, varying deer and tree densities, and studies that show different outcomes should not result in uniform regional trends in compositional change.
Localized studies have identified deer impacts on northern white cedar (e.g., reviewed in Alverson et al. 1988, Russell et al. 2001). However, these declines are not evident at longer time scales and larger landscapes even as deer densities increased. In the Great Lakes re-gion, comparison of historical (1800s) and current tree surveys demonstrated increased northern white cedar (respectively, from 5 to 8.5% of all trees in northern Minnesota, from 4.5 to 7% of all trees in northern Wis-consin, from 10 to 13% of all trees in northern Michigan; Hanberry et al. 2013; Hanberry and Dey 2019; B. Han-berry, unpublished data).
Table 3Major tree genera or species, their deer browse preference in the northeastern US (Rawinski2014) and central (Latham et al.2005) and southern (Warren and Hurst1981) US during the growing and non-growing season, and their change in percent of all trees in forests from historical (1620–1900) to present (2011–2017) in the eastern US. Changes in dominance reflect overall trend across the entire eastern US and may vary within forest regions and provinces
Tree group Scientific name North Central spr/sum Central fall/wint South spr/sum South fall/wint Change
Balsam fir Abies balsamea Non-preferred Unknown Unknown N/A N/A Increase
Red maple Acer rubrum Preferred Low/moderate High Moderate/high Low/moderate Increase
Sugar maple Acer saccharum Preferred Low/moderate Moderate N/A N/A Increase
Birch Betula Non-preferred Low/moderate Moderate/high N/A N/A Neutral
Hickory Carya N/A Low Low Low/moderate Low Neutral
Beech Fagus sylvatica Non-preferred Low High Moderate/high Low/moderate Decrease
Ash Fraxinus Preferred Low/moderate High Moderate/high Low/moderate Increase
Eastern redcedar Juniperus virginiana Preferred Moderate Moderate Low/moderate Moderate/high Increase
Sweetgum Liquidambar styraciflua N/A Low Low Low/moderate Low Increase
Yellow-poplar Liriodendron tulipifera N/A High High Moderate/high Moderate Increase
Blackgum Nyssa sylvatica Preferred High High High Moderate Increase
Spruce Picea Non-preferred None Low N/A N/A Increase
White pine Pinus strobus Non-preferred Low Moderate N/A N/A Decrease
Pine Pinus Non-preferred Unknown Unknown Low Low Decrease
Aspen Populus Preferred Low Low Moderate/high Low/moderate Increase
Black cherry Prunus serotina Preferred Low Low High Moderate/high Increase
Oak Quercus Preferred Moderate High Low Low Decrease
Northern white cedar Thuja occidentalis Preferred N/A N/A N/A N/A Increase
Unlike deer impacts on tree density and composition, the herbaceous ground layer may never recover if graz-ing is too intense for too long (Miller et al.1992; Kraft et al. 2004), particularly if non-native invasive plants establish or recalcitrant fern growth develops (Royo and Carson 2006). Restoration of browse-sensitive plants depends on presence of budbanks and seedbanks and location and dispersal rates of source plants among other factors. Recovery rates of understory vegetation released from browsing vary. Further research is needed to substantiate the extent to which deer browsing decreases herbaceous plant survival and reproduction relative to other drivers, such as competition for growing space and light by tree regeneration.
Open forests, deer, and fire
A related question is whether it is a problem if forests have fewer trees, as may be caused by herbivory (Fløjgaard et al. 2018). There has been an on-going debate about how much of European landscapes were open, rather than the closed forests of present day, due to the abundance of large herbivores. For example, Bakker et al. (2016) sum-marized: “modern studies and paleo-studies indicate that removal of large herbivores is followed by increased abun-dance of woody plants and altered vegetation composition and structure toward less open landscapes, with more shade-tolerant and palatable species.”Similarly, open oak and pine forests used to dominate most of eastern US forests, which are now closed forests in which trees have captured the growing space from herbaceous plants (Bromley 1935; Day 1953; Rostlund 1957; Bragg 2002; Nowacki and Abrams2008, Hanberry and Nowacki2016; Hanberry and Abrams 2018; Hanberry et al. 2018a, b). Deer extended beyond the range of open forests into closed northern forests, indicating consumption by deer was not sufficient to control tree regeneration in that re-gion. The historical range of bison better approximates the extent of open forests and grasslands in the USA, al-though bison and bison remains have not been recorded in parts of the Atlantic Coastal Plain longleaf pine and southern New England oak forests, which were open for-ests (Gates et al.2010). Bison additionally are almost en-tirely gramnivores, and thus, any effect on tree densities would be through trampling rather than consuming.
Although release from herbivory generally was synchron-ous in most areas with transition from open to closed for-ests, return of browsing pressure has not reduced tree densities. American bison (Bison bison) were extirpated from the eastern US by the early 1800s. Open forests never-theless persisted, albeit free-ranging cattle and pigs replaced bison. White-tailed deer are browsers and were at a popula-tion low by the late 1800s, after which many eastern forests started to transition from open to closed forests. Deer dens-ities have been high for about 50 years (Russell et al.2001;
Côté et al. 2004), and may be effectively greater than the past because the land base has diminished due to develop-ment infrastructure. Despite deer densities increasing gen-erally to > 5.8 deer/km2, growing space has remained dominated by trees (Hanberry and Abrams2018; Hanberry et al.2018b).
The eastern US historically was comprised of open for-ests with high deer densities and fire, and now the eastern US is closed forests with high deer densities and no fire. Thus deer herbivory may be less relevant at large spatial scales than local scales. We propose that fire exclusion has counteracted any effects of high deer densities on tree re-generation, resulting in closed forests compared to histor-ical open forests. This concurs with other findings, such as Kramer et al. (2003) who stated: “grazing–fire interac-tions are consistent with findings presented in the litera-ture that ungulates may not be able to prevent open areas like heathlands becoming forested…and that grazing can only keep such areas open in combination with a disturb-ance factor such as fire.”Historical fire regimes provide a mechanism to favor fire-tolerant oak and pine species and remove small diameter trees, maintaining open forests that included open woodlands, which were < 60% stocked or understocked, and closed woodlands (Hanberry et al., 2014a). Indeed, understocking is not an ecological prob-lem in historically open forests. Conversely, fire exclusion allows many tree species to survive, and both composition of fire-sensitive species and tree densities have increased in these regions, despite preferences for certain browse by deer (Hanberry et al., 2014a, b; Hanberry and Abrams 2018; Hanberry et al.2018b).
Too many trees, rather than too few, is an ecological con-cern. Trees replace the herbaceous groundlayer in the understory of open forests, through capture of the growing space by development of multiple vertical layers and over-story canopy coverage in closed forests. In open forests, the herbaceous layer adds a grassland component, which is crit-ical for declining pollinators and birds (e.g., Hanberry and Thompson2019). The grassland layer may have been better adapted to grazing pressure than herbs of closed forests. In addition, tree regeneration presents a difficult barrier for restoration of open forests, because open forest manage-ment techniques to control small diameter trees are expen-sive or risky. It would be preferable for open forest management if deer were able to remove enough seedlings to maintain open forests. Management tools of thinning, herbicides, and prescribed burns for maintaining open for-ests, while effective, require too much investment in most cases to restore open forests even at small scales.
Conclusions
trees at landscape scales. Instead, it appears that forests typically are equally stocked at all deer densities, includ-ing deer densities > 5.8 deer/km2, which has been deter-mined a threshold where deer reduce tree regeneration at stand scales. Unless deer densities locally are over-abundant, compositional changes in the overstory prob-ably are due to changes in historical disturbance regimes and other factors. The transition from open oak and pine forests maintained by low to moderate severity fires to dense forests comprised of many eastern tree species is the major trajectory of eastern forests. The ecological problem is too many trees, rather than too few, in east-ern forests that historically were open.
Additional file
Additional file 1:For increasing deer density classes (low density class of <5.8 deer/km2, moderately low density class of 5.8–11.6 deer/km2,
moderately high density class of 11.6-17.4 deer/km2, and high density class of 17.4 deer/km2) during 2001-2005, panels show percent of
understocked forest, tree densities <2.54 cm, tree densities 2.54 to 12.7 cm, and tree densities 12.7 cm to 25.4 cm in the entire eastern United States followed by the northern, central, southern, and Prairie regions. (DOCX 43 kb)
Acknowledgements
We thank LS Baggett, Rocky Mountain Research Station, for statistical assistance; K Adams, QDMA, for providing deer density maps; P Hanberry, MoRAP, for digitizing the deer density layers; and anonymous reviewers.
Authors’contributions
MA proposed the manuscript, tables, and figures; edited the manuscript; and approved the manuscript. BH analyzed data, prepared figures and tables, and wrote and approved manuscript.
Funding
MA received financial support from Pennsylvania Agriculture Experiment Station project PEN04658.
Availability of data and materials
Deer density maps are available athttps://vet.uga.edu/scwds/range-maps
and from Adams et al.2009. Tree information is available athttps://apps.fs. usda.gov/Evalidator/evalidator.jsp
Ethics approval and consent to participate Not applicable
Consent for publication Not applicable
Competing interests
The authors declare that they have no competing interests.
Author details 1
USDA Forest Service, Rocky Mountain Research Station, Rapid City, SD 57702, USA.2Department of Ecosystem Science and Management, Pennsylvania State University, 307 Forest Resources Bldg, University Park, PA 16802, USA.
Received: 26 February 2019 Accepted: 28 June 2019
References
Abrams MD (2001) Eastern white pine versatility in the presettlement forest. BioScience 51:967–979
Abrams MD (2003) Where has all the white oak gone? BioScience 53:927–939 Abrams MD, Johnson SE (2012) Long-term impacts of deer exclosures on
mixed-oak forest composition at the Valley Forge National Historical Park, Pennsylvania, USA. J Torrey Bot Soc 139:167–180
Adams K, Hamilton J, Ross M (2009) QDMA’s whitetail report. QDMA, Bogart Adams KP, Hamilton RJ (2011) Management history. In: Hewitt DG (ed) Biology
and management of white-tailed deer. CRC Press, Boca Raton, pp 355–377 Alverson W, Waller D, Solheim S (1988) Forests too deer: edge effects in northern
Wisconsin. Conserv Biol 2:348–358
Arner SL, Woudenberg S, Waters S, Vissage J, MacLean C, Thompson M, Hansen M (2001) National algorithms for determining stocking class, stand size class, and forest type for Forest Inventory and Analysis plots. US Department of Agriculture, Forest Service, Northeastern Research Station, Newtown Square Bakker ES, Gill JL, Johnson CN, Vera FWM, Sandom CJ, Asner GP, Svenning J-C (2016)
Combining paleo-data and modern exclosure experiments to assess the impact of megafauna extinctions on woody vegetation. PNAS 113:847–855
Bechtold WA, Patterson PL (2005) The enhanced forest inventory and analysis program - national sampling design and estimation procedures. Gen. Tech. Rep. SRS-80. USDA Forest Service, Southern Research Station, Asheville Bradshaw L, Waller DM (2016) Impacts of white-tailed deer on regional patterns
of forest tree recruitment. For Ecol Manage 375:1–11
Bragg DC (2002) Reference conditions for old-growth pine forests in the Upper West Gulf Coastal Plain. J Torrey Bot Soc 129:261–288
Bromley SW (1935) The original forest types of southern New England. Ecol Monogr 5:61–89
Collard A, Lapointe L, Ouellet J-P, Crête M, Lussier A, Daigle C, Côté SD (2010) Slow responses of understory plants of maple-dominated forests to white-tailed deer experimental exclusion. For Ecol Manage 260:649–662 Côté SD, Rooney TP, Tremblay J-P, Dussault C, Waller DM (2004) Ecological
impacts of deer overabundance. Annu Rev Ecol Evol Syst 35:113–147 Day GM (1953) The Indian as an ecological factor in the northeastern forest.
Ecology 34:329–346
Didier KA, Porter WF (2003) Relating spatial patterns of sugar maple reproductive success and relative deer density in northern New York State. For Ecol Manage 181:253–266
Ecomap (2007) Delineation, peer review, and refinement of subregions of the conterminous United States. Gen. Tech. Report WO-76A. USDA Forest Service, Washington, DC
Fløjgaard C, Bruun HH, Hansen MD, Heilmann-Clausen J, Svenning JC, Ejrnæs R (2018) Are ungulates in forests concerns or key species for conservation and biodiversity? Reply to Boulanger et al. Global Change Biol 24:869–871 Gates CC, Freese CH, Gogan PJP, Kotzman M (2010) American bison: status
survey and conservation guidelines 2010. IUCN, Gland
Hanberry BB, Abrams MD (2018) Recognizing loss of open forest ecosystems by tree densification and land use intensification in the Midwestern USA. Reg Environ Change 18:1731–1740
Hanberry BB, Bragg DC, Hutchinson TF (2018a) A reconceptualization of open oak and pine ecosystems of eastern North America using a forest structure spectrum. Ecosphere 9(10):e02431
Hanberry BB, Coursey K, Kush JS (2018b) Structure and composition of historical longleaf pine ecosystems in Mississippi, USA. Human Ecol 46:241–248 Hanberry BB, Dey DC (2019) Historical range of variability for restoration and
management in Wisconsin. Biodiversity and Conservation.https://doi.org/1 0.1007/s10531-019-01806-8
Hanberry BB, He HS (2015) Effects of historical and current disturbance on forest biomass in Minnesota. Landsc Ecol 30:1473–1482
Hanberry BB, Jones-Farrand DT, Kabrick JM, He HS (2014a) Historical open forest ecosystems in the Missouri Ozarks: Reconstruction and restoration targets. Ecol Restor 32:407–416
Hanberry BB, Nowacki GJ (2016) Oaks were the historical foundation genus of the east-central United States. Quaternary Sci Rev 145:94–103 56 Hanberry BB, Palik BJ, He HS (2013) Winning and losing tree species of
reassembly in Minnesota’s mixed and broadleaf forests. PLoS ONE 8:e61709 Hanberry BB, Thompson FR III (2019) Open forest management for early
successional birds. Wildl Bull 43:141–151
Hanberry P, Hanberry BB, Demarais S, Leopold BD, Fleeman J (2014b) Impact on plant communities by white-tailed deer in Mississippi, USA. Plant Ecol Divers 7:541–548
Kittredge DB, Ashton MS (1995) Impact of deer browsing on regeneration in mixed stands in southern New England. North J Appl For 12:115–120 Kraft LS, Crow TR, Buckley DS, Nauertz EA, Zasada JC (2004) Effects of harvesting
and deer browsing on attributes of understory plants in northern hardwood forests, Upper Michigan, USA. For Ecol Manage 199:219–230
Kramer K, Groen TA, van Wieren SV (2003) The interacting effects of ungulates and fire on forest dynamics: an analysis using the model FORSPACE. For Ecol Manage 181:205–222
Latham RE, Beyea J, Benner M, Dunn CA, Fajvan MA, Freed RR, Grund M, Horsley SB, Rhoads AF, Shissler BP (2005) Managing white-tailed deer in forest habitat from an ecosystem perspective: Pennsylvania case study. Report by the Deer Management Forum for Audubon Pennsylvania and Pennsylvania Habitat Alliance, Harrisburg
Leopold A, Sowls LK, Spencer DL (1947) A survey of over-populated deer ranges in the United States. J Wildl Manage 11:162–177
McCabe RE, McCabe TR (1984) Of slings and arrows: an historical retrospection. In: Halls LK (ed) White-tailed deer: ecology and management. Stackpole, Harrisburg, pp 19–72
McShea WJ (2012) Ecology and management of white-tailed deer in a changing world. Ann N Y Acad Sci 1249:45–56
McWilliams WH, Westfall JA, Brose PH, Dey DC, D’Amato AW, Dickinson YL, Fajvan MA, Kenefic LS, Kern CC, Laustsen KM, Lehman SL, Morin RS, Ristau TE, Royo AA, Stoltman AM, Stout SL (2018) Subcontinental-scale patterns of large-ungulate herbivory and synoptic review of restoration management implications for midwestern and northeastern forests. Gen. Tech. Rep. NRS-182. US Department of Agriculture, Forest Service, Northern Research Station, Newtown Square
Miller KV, Muller L, Demarais S (2003) White-tailed deer. In: Feldhamer GA, Thompson BC, Chapman JA (eds) Wild mammals of North America: Biology, Management and Conservation. Johns Hopkins University Press, Baltimore, pp 906–930
Miller SG, Bratton SP, Hadidian J (1992) Impacts of white-tailed deer on endangered plants. Natural Areas Journal 12:67–74
Nowacki GJ, Abrams MD (2008) The demise of fire and“mesophication”of forests in the eastern United States. BioScience 58:123–138
Ramirez JI, Jansen PA, Poorter L (2018) Effects of wild ungulates on the regeneration, structure and functioning of temperate forests: a semi-quantitative review. For Ecol Manage 424:406–419
Rawinski TJ (2014) White-tailed deer in northeastern forests: understanding and assessing impacts. USDA Forest Service, Northeastern Area State and Private Forestry, Newtown Square
Rooney TP (2001) Deer impacts on forest ecosystems: a North American perspective. Forestry 74:201–208
Rostlund E (1957) The myth of a natural prairie belt in Alabama: an interpretation of historical records. Ann Am Assoc Geogr 47:392–411
Royo AA, Carson WP (2006) On the formation of dense understory layers in forests worldwide: consequences and implications for forest dynamics, biodiversity, and succession. Can J For Res 36:1345–1362
Russell FL, Zippin DB, Fowler NL (2001) Effects of white-tailed deer (Odocoileus virginianus) on plants, plant populations and communities: a review. Amer Midl Nat 146:1–26
Russell MB, Westfall JA, Woodall CW (2017b) Modeling browse impacts on sapling and tree recruitment across forests in the northern United States. Can J For Res 47:1474–1481
Russell MB, Woodall CW, Potter KM, Walters BF, Domke GM, Oswalt CM (2017a) Interactions between white-tailed deer density and the composition of forest understories in the northern United States. For Ecol Manage 384:26–33
USDA Forest Service, Forest Inventory and Analysis Program (2018) Forest Inventory EVALIDator web-application Version 1.7.0.01. U.S. Department of Agriculture, Forest Service, Northern Research Station, St. Paul. [Available only on internet:https://apps.fs.usda.gov/Evalidator/evalidator.jsp]
VerCauteren K (2003) The deer boom: discussions on population growth and range expansion of the white-tailed deer. In: Hisey G, Hisey K (eds) Bowhunting records of North American whitetail deer. Pope and Young Club, Chatfield, pp 15–20
Warren RC, Hurst GA (1981) Ratings of plants in pine plantations as white-tailed deer food. Mississippi Agricultural Forest Experiment Station. Information Bulletin 18, Mississippi State (MS)
Webb GK (2014) Results of environmental scanning applied to the design of a deer management decision support system (DSS) for the United States and California. Issues in Information Systems 2014:77–88
Whitney GG (1984) Fifty years of change in the arboreal vegetation of Heart’s Content, an old-growth hemlock-white pine-northern hardwood stand. Ecology 65:403–408
Whitney GG (1990) The history and status of the hemlock-hardwood forests of the Allegheny Plateau. J Ecol 78:443–458
Publisher’s Note