Spectral kinetic method and its
applications in the evaluation of
gabapentin
Khawal Salman
Abdal Rassol
, H. N. K. AL-Salman, Hussein H. Hussein
Department Pharmaceutical Chemistry, College of Pharmacy, University of Basrah, Iraq
Abstract
Context: A new and highly sensitive method for the determination of gabapentin (GBP), this method is of high importance in the assessment of GBP and other pharmaceutical preparations. GBP is a widely used antibiotic. There is a big challenge of analysis of anti-epilepsy drugs due to their instability and sensitivity to various conditions. The simple, sensitive, precise, and kinetic spectroscopy method was used to measure GBP in some pharmaceuticals developed and validated. Objective: The objective of the study was to develop a simple, sensitive, accurate, and kinetic spectroscopy method for the measurement of GBP in a pharmaceutical product. Materials and Methods: The current method was based on the spectral kinetic examination of epileptics (GBP) with potassium permanganate in alkaline medium at room temperature. Absorption of the stained manganese ions of the product was absorbed at 605 nm. Results: The concentration of GBP was calculated using the calibration equation for the time method and the initial rate method. The above method is used to determine GBP from 2.0 to 20 μg/mL. The BER Act was applied to roads within the range of concentrations used for analysis. The limit of quantification and limit of detection, equal to 0.640 and 1.940, were calculated, respectively. The relative standard deviation values was found to be 0.345% and Recovery values were 99.38 and 0.50%, respectively. Conclusion: The proposed and developed method is sensitive, accurate, and tolerable and can be used for the routine analysis of GBP in various pharmaceuticals. The proposed method was successfully applied to the determination of the drug jabapentin in the pharmaceuticals and the validation of the statistical data. The results were compared to the reference method showed good compatibility.
Key words: Anticonvulsant, anti-epileptic drugs, gabapentin drug, spectral kinetic method
Address for correspondence:
H. N. K. AL-Salman, Department Pharmaceutical Chemistry, College of Pharmacy, University of Basrah, Iraq. E-mail: [email protected]
Received: 26-11-2018 Revised: 08-12-2018 Accepted: 12-12-2018
INTRODUCTION
T
he drug gabapentin (GBP) has a chemical formula of C9H17NO2. The molecular mass of 171.237 g/mol is known chemically as aminomethyl cyclohexane acetic acid; the trade names are Garrex, Neuroplex, Neurontin, Neurona, captain, and Conventin.[1] GBP as an anticonvulsant, it can be used to treat seizures and strokes. It can be used as a barrier to blood in the brain. This can be used to treat seizures and strokes.[2-4] GBP is a complementary tool for other anti-epileptic drugs in adult patients who do not have sufficient control over the effects of narcotic drugs in cases of molecular seizures and stroke.[5] The treatment helps to prevent seizures or seizures in the brain and helps control them, so it is used (as a single treatment or with other treatments) to control certain types of seizures or epileptic seizures. It also regulates the work of a number of neurotransmitters responsible for the deliveryof pain, leading to its use in the treatment of some types of neuropathic pain. Treatment does not cure epilepsy but helps control seizures in terms of reducing recurrence, so it is not allowed to discontinue treatment without consulting the doctor once the patient has improved. The seizures may recur after discontinuation of treatment.[6] GBP has a structural analogy of the amino acid (Butyric) and the inhibitory DNA (gamma-aminobutyric acid 1). Spectrophotometric measurements, high-performance liquid chromatography, serial injection measurements, and automated spectrum measurements were performed to determine the drug’s GBP.[7] The interaction of potassium permanganate (KMnO4) as a potent oxidative
ORIGINAL
AR
agent with alginate in the alkaline medium was performed. The spectral method was used at the maximum absorption spectra of 605 nm. The GBP was shown with the oxidative factor of green color in the visible and ultraviolet region of the spectrum.[8]
The Objective of the Study
The objective of the study was to study the development of a new spectral method of high and simple selectivity for the determination of GBP in pharmaceutical drugs.
EXPERIMENTAL
All spectral absorption values were performed using a German-made high-sensitivity spectrometer operating in the two visible areas of the spectrum and ultraviolet (A Jena Model 1100).
MATERIALS AND METHODS
Materials
• GBP pharmaceutical grade 99.5% from Sun Pharmaceuticals, Mumbai, India.
• 100 mg Gaba Plus capsules purchased from Platinum Pharma (Pvt.) Ltd.
• Karachi, (Pakistan) and Gabapin-300 (300 mg GBP per capsule) from Intas Pharmaceuticals, Dehradun, India. • Neurontin capsules (Labeled to found 300 mg GBP)
were product from Godecke AG/Germany.
• Potassium permanganate (KMnO4) (Merck, Germany). • Sodium hydroxide (NaOH) from (Merck, Germany). • Hydrochloric acid (HCl) from (Merck, Germany).
Molecular Formula of GBP
Methods
Preparation of reagent and standard solutions
All the solvents and reagents used for the experiment were 99.9% pure. Deionized water was also used with a high purity of 0.055 µs/cm.[9] A standard solution of 100 ml of 250 mg/L
of standard pharmaceuticals was prepared in distilled water. A concentration of 0.158 KMnO4 was prepared in 100 ml of distilled water. 0.5 m of sodium hydroxide was prepared by dissolving 2 g of NaOH in 100 ml distilled water and calibrating sodium hydroxide solution with standard hydrochloric acid.[10]
Procedure of analysis standard material and pharmaceuticals
The working solution was prepared with a combination of GBP concentrations (2.0–20 mg/L) and the transfer of these concentrations, respectively, to 25 ml of volumetric flasks, plus 2 ml of KMnO4 solution (0.1 m) and 1.5 ml of sodium hydroxide solution. Then complete the volume with deionized water. After 15 min, absorption was measured at a 605 nm wavelength and compared with a detector set at the same time. The calibration curve of the absorption values was plotted against the final concentration of the mg/L unit.[11,12]
A range of sample concentrations (1–1000) mg/L were prepared by dissolving 27 mg GBP in deionized water and taking 25 ml of each concentration for analysis. From the range of selected concentrations the standard curve was drawn.
RESULTS
The absorption spectrum at the maximum value (λmax) for GBP was recorded at 200 nm using deionized water as a solvent. GBP was mixed and mixed with potassium permanganate at 25°C, as shown in Figures 1. The absorption spectra of the green mix solution (maximum absorption at 605 nm) were recorded against an blank.
Gapapentin was estimated in two methods. The first was the reaction of GBP with potassium permanganate at the concentration of 0.8 × 10⁻² m. The absorbance of the reaction mixture was measured at a maximum wavelength of 605 nm, and the other comparison method was made using GBP with
Figure 1: (A) Absorption spectrum of gabapentin (GBP) with
potassium permanganate at 0.6 × 10⁻⁴ m concentration at
the same maximum wavelength. Two types of curves were obtained according to Figure 1a and b, which shows the effect of different concentrations of potassium permanganate as a potent oxidative agent on the kinetics of interaction with GBP. The effectiveness of GBP toward oxidizing agents such as potassium permanganate explains its uses extensively to relieve pain, especially nerve pain, and epilepsy of all kinds.
DISCUSSION
Reliability of Interaction Variables
The effect of different parameters on the development of single-color amygdala solutions was studied separately, and all factors studied and confirmed for subsequent studies were observed. These variables include KMnO4 concentration effect, sodium hydroxide concentration effect, temperature, and time. GBP was found to interact with KMnO4 in the center of alkali to produce a green solution with a peak of 605 nm [Figure 1]. The various experimental factors that influence the evolution and stability of the reaction output at this wavelength have been carefully studied, and several studies have been conducted for the purpose of improving them.[12-14]
Effect of Potassium Permanganate Concentrations
The KMnO4 concentration effect was studied on the absorbance in the range (0.2 × 10⁻²–1.6 × 10⁻² m) by GBP
concentration constant at 0.6 × 10⁻⁴ m. The absorbance
was increased with increasing the potassium permanganate concentration [Figure 2]. 2 ml of (0.8 × 10⁻² m) KMnO4
solution was used to obtain the maximum absorbance value in 15 min.[15]
Effect of Sodium Hydroxide Concentrations
The effect of sodium hydroxide concentrations was studied by taking a constant concentration of GBP (0.6 × 10⁻⁴ m)
plus 2.0 ml of potassium permanganate solution at 0.1 m concentration and different volumes of sodium hydroxide at 0.5 m concentration within a range of volumes (0.5–4.0) ml. As shown in Figure 3, the highest absorption value was obtained when adding 1.5 ml of 0.5 M (3 × 10⁻² m) sodium hydroxide
solution, the increase in the volume of sodium hydroxide added to the low spectral absorption values.[16,17]
Effect of Time Required for Reactance
The effect of the time needed for interaction between GBP and KMnO4 was studied in the basal medium [Figure 4]. The oxidation reaction was performed for periods of 2–35 min.
The oxidation reaction was achieved within 15 min, and the maximum wavelength was obtained at 605 nm. The solutions turned into sour solutions after 50–60 min. Absorption values increase over time.[18]
Effect of Temperature Required for Reactance
At 25°C, GBP reaction with potassium permanganate was observed. The reaction rate was significantly increased with the increase in the color of the mixture, but avoiding work at high temperatures caused the release of MnO2 from the oxidation reaction.[19]
Study of Kinetics of Materials Reactant
Rate=K[Drug]n[KMnO4]m
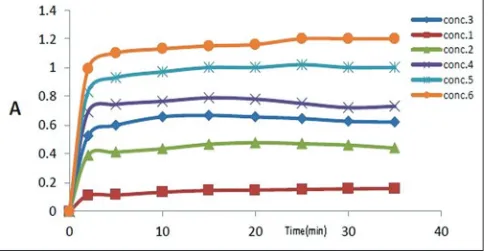
The gradual changes in color intensity over time were due to differences in energy kinetics of the reaction of GBP with potassium permanganate in the basal medium as shown in Figure 5. Where the concentrations of potassium permanganate were within the linear range of the reaction (0.8 × 10⁻² m), the equation of kinetics of reaction can be
written as follows:
Rate=K` [Drug]n
Figure 2: Effect of KMnO4 volume on absorbance
K` is the constant of the ratio of the reaction order and n represents the order of the interaction. The above equation can be considered the logarithmic form of the reaction as follows:
Log rate=log K`+n log [Drug]
At a range of GBP concentrations, initial reaction rates at 605 nm were determined by measuring the value of the initial contact tangent of the time curves during the first 35 min of the reaction as shown in Figure 5.
When plot the logarithm rate versus logarithm [Drug] the linear equation can be represented as the following:
Log rate = 1.135 log [Drug]+3.663
With correlation coefficient equal to R2 = 0.9049. The value of n in the former equation shows that the reaction is first order.
The Credibility of the Kinetic Method
To determine the ranges of GBP concentrations, several experimental tests were performed using the relationship between fixed absorption values and time values.
1/t = 0.027 [Drug] + 3 × 10⁻⁵ with correlation coefficient equal to R2 = 0.989
Absorbance Method
GBP reaction rate data were recorded within the range (2.0–20.0 mg/L). The selective absorption period was determined as shown in Table 1 and time was measured in seconds.[20] The standard calibration equation was also obtained by the time-frame (1/t) versus the initial concentration of the GBP drug [Table 2].
When the calibration graphs were plot at 15 min, the most acceptable linearity was obtained as shown in Table 3. The calibration graph was on the linearity range of 2.0–20.0 mg/L. The equation of the analysis data represented as the following:
A = 0.067C + 0.021
With correlation coefficient (R²) equal to 0.9990. Where A represented the absorbance and C represented the concentration of GBP drug.[21]
Figure 4: Effect of time on absorbance
Figure 5: At varying concentration of gabapentin
drug absorbance-time curves for the initial rate of the
reaction (conc.1 = 1.25 × 10⁻⁵ m), (conc.2 = 3.7 × 10⁻⁵ m),
(conc.3 = 5.024 × 10⁻⁵ m), (conce.4 = 6.280 × 10⁻⁵ m,
(conce.5 = 11.304 × 10⁻⁵ m, andconc.6 = 12.560 × 10⁻⁵ m)
keeping [KMnO4] = 0.8 × 10⁻² m and [NaOH] = 0.3 m
Table 1: Values of (1/t) at different concentrations of GBP drug
t (s) 1/t [Drug]
1200 0.83×10⁻⁴ 0.5×10⁻⁴
900 1.11×10⁻³ 0.6×10⁻⁴
600 1.66×10⁻³ 0.8×10⁻⁴
300 3.33×10⁻³ 1.2×10⁻⁴
GBP: Gabapentin
Table 2: Analytical parameters for determination of GBP with KMnO4
Time (s) Calibration
equation Correlation coefficient (R²)
300 y=0.058x+0.024 R²=0.995
600 y=0.061x+0.034 R²=0.995
900 y=0.067x+0.021 R²=0.999
1200 y=0.063x+0.038 R²=0.995
1500 y=0.064x+0.030 R²=0.997
1800 y=0.065x+0.027 R²=0.998
2100 y=0.068x+0.025 R²=0.998
Verification of the Credibility of the Analytical Method
The analytical method was validated by linear values, accuracy, sensitivity, precision, and recovery.[22]
The Linearity and Sensitivity[23]
The relationship between absorption values and GBP concentration values was determined within the range 2.0– 20.0 mg/L at 605 nm at optimal conditions. It was observed that the relationship was linear for all values of GBP concentrations, as shown in Figure 6.
The calibration graph can be described by the following equation: y = 0.067 x + 0.021
(R² = 0.9990, n = 6) where Y is represented the absorption, and X equal to the concentration of GBP in concentration with mg/L.
The analytical parameters such as correlation coefficient, molar absorptivity, Sandellʼs sensitivity, limit of detection (LOD), and limit of quantification (LOQ) are calculated and
listed in Table 3. The correlation coefficient, intercept and slope for the calibration data are summarized in Table 3. The below formula was used to calculate (LOD) and (LOQ): LOQ=10s/b
LOD=3:3s/b
Whereas is equal to the standard deviation of the intercept, and b represented the slope of the calibration curve.[24]
The Precision and Accuracy[25]
The precision and accuracy of the spectral study showed four levels of GBP concentration using five concentrations per sample.
Table 2 shows the high repeatability and precision of the current method by relying on the relative standard deviation values for results that did not exceed 2%. The analysis values obtained for GBP in pharmaceuticals were appropriate due to the high reproduction and accuracy of the method used. The percentage of heights obtained in the range of 99.38– 100.50%. Using a standardized and internationally accepted method, the value of t-test and F-test was calculated. The result indicates that the t-test and the F-test values were obtained below the allowable range, which improved the precision and accuracy of the proposed method [Table 4].
The Applications of Method
The current method of analysis has been used successfully in the estimation of GBP in pharmaceutical preparations. The results of the method used indicate the precision and accuracy of the good evaluation of the drug GBP. Table 5 shows the results of application of the current method where the recovery values ranged from 103.020 to 97.470%. The current method is also free of interferences.
CONCLUSION
The results obtained from the measurement of the GBP interaction variables indicate that the proposed method is simple, fast, and high-sensitivity and can be easily applied to determine GBP in its pure form as standard and pharmaceutical preparations at a maximum absorption of 605 nm. A range of temperatures can be controlled during the interaction of GBP with potassium permanganate. The current spectral measurement method can be used in quality control laboratories for GBP in pharmaceuticals and biological samples.
ACKNOWLEDGMENTS
The authors are thankful to the professors of pharmaceutical chemistry and pharmaceuticals to assist us in this research
Table 3: Analytical parameters for determination of GBP with KMnO4
Parameter Value
Wavelength 605 nm
Beer’s law limits (μg/ml) 2–20
Sandell’s sensitivity (μg cm−2) 0.0149
SD of intercepts 0.013
LOD (μg/mL) 0.640
LOQ (μg/mL) 1.940
Slope,b 0.067
Intercept,a 0.021
Correlation coefficient 0.9990
Regression equation Y=a + bx y=0.067x+0.021
LOD: Limit of detection, LOQ: Limit of quantification, SD: Standard deviation, GBP: Gabapentin
work. The authors also thank to the scholars working in the Department of Pharmaceutical Chemistry at the College of Pharmacy, University of Basrah. We also offer our special thanks and appreciation to the head of pharmaceutical chemistry thanks.
CONFLICTS OF INTEREST
There are no conflicts of interest.FUNDING OF RESEARCH
The research was funded by the researcher himself.REFERENCES
1. Rossi S, Vigani B, Bonferoni MC, Sandri G, Caramella C, Ferrari F, et al. Rheological analysis and mucoadhesion: A 30 year-old and still active combination. J Pharm Biomed Anal 2018;156:232-8.
2. Abdulrahman SA, Basavaiah K. Sensitive and selective spectrophotometric determination of gabapentin in capsules using two nitrophenols as chromogenic agents. Int J Anal Chem 2011;2011:1-9.
3. Themelis DG, Tzanavaras PD, Boulimari EA. Generic automated fluorimetric assay for the quality controlof gamma-aminobutyric acid-analogue anti-epileptic drugs using sequential injection. Anal Lett 2010;43:905-18. 4. Galande VR, Baheti KG, Dehghan MH. UV-Vis
spectrophotometric method for estimation of gabapentin and methylcobalamin in bulk and tablet. Int J Chem Tech Res 2010;2:695-9.
5. Siddiqui FA, Arayne MS, Sultana N, Qureshi F, Mirza AZ, Zuberi MH, et al. Spectrophotometric determination of gabapentin in pharmaceutical formulations using ninhydrin and pi-acceptors. Eur J Med Chem 2010;45:2761-7.
6. Refat MS, El-Zayat LA, Yeşilel OZ. Spectroscopic characterization of charge-transfer complexes of morpholine with chloranilic and picric acids in organic media: Crystal structure of bis(morpholinium 2,4,6-trinitrocyclohexanolate). Spectrochim Acta A Mol Biomol Spectrosc 2010;75:745-52.
7. Manera M, Miro M, Ribeiro MFT. Rapid chemo-luminometric determination of gabapentin in pharmaceutical formulations exploiting pulsed-flow analysis. Luminescence 2009;24:10-4.
8. Rao BU, Maqdoom F, Nikalje AP. Determination of gabapentin in bulk drug and in pharmaceutical dosage form by HPLC method. J Chil Chem Soc 2009;54:424-7. 9. Gujral RS, Haque SM. A validated method without
derivatization for the determination of gabapentin in
Table 4: Accuracy and precision studies of GBP
Amount
taken (μg/ml) found (μg/ml)Amount % Recovery* RSD % method mean±SDProposed Ref method (20) mean±SD t-test (**) F-test (**)
6 6.03 100.50 0.3459 99.912±0.3456 100.80±0.84 t=1.88 F=1.49
8 7.95 99.38
12 12.04 100.33
16 15.91 99.44
*Mean value of five determinations, **The t‑value at the 95% confidence level is 2.78; and F‑value at the 95% confidence level is 6.39,
RSD: Relative standard deviation, GBP: Gabapentin, SD: Standard deviation
Table 5: GBP pharmaceutical method of preparation
Pharmaceutical preparations Concentration (μg/ml) Recovery % RSD %
Taken Found*
Neurontin 4 3.899 97.470 0.932
8 8.034 100.420 0.995
16 16.055 100.340 1.131
Gabapin 4 4.121 103.020 0.965
8 7.984 99.800 0.643
16 16.152 100.950 1.128
Gaba Plus 4 3.921 98.020 1.338
8 8.212 102.650 0.998
16 16.099 100.610 0.699
bulk, pharmaceutical formulation and human urine samples. Int J Biomed Sci 2009;5:169-74.
10. Gujral RS, Haque SM. Development and validation of a new HPLC method for the determination of gabapentin. Int J Biomed Sci 2009;5:63-9.
11. Al-Salman HN, Hussein H, Al-Nuaim M. Quantitative analysis of cephradine using the modern high-performance liquid chromatographic method. Asian J Pharm 2018;12:288-34.
12. Al-Salman HN, Ekhlas QJ. Analytical methods for diagnosis a mixture of narcotic substances in seized materials. Int J Green Pharm 2018;12:216-26.
13. Taherali F, Varum F, Basit AW. A slippery slope: On the origin, role and physiology of mucus. Adv Drug Deliv Rev 2018;124:16-33.
14. Mackie AR, Goycoolea FM, Menchicchi B, Caramella CM, Saporito F, Lee S, et al. Innovative methods and applications in mucoadhesion research. Macromol Biosci 2017;17:1-32.
15. Schattling P, Taipaleenmäki E, Zhang Y, Städler B. A polymer chemistry point of view on mucoadhesion and mucopenetration. Macromol Biosci 2017;17:1-20. 16. Liu S, Dozois MD, Chang CN, Ahmad A, Ng DL,
Hileeto D, et al. Prolonged ocular retention of mucoadhesive nanoparticle eye drop formulation enables treatment of eye diseases using significantly reduced dosage. Mol Pharm 2016;13:2897-905.
17. Loftsson T, Jansook P, Stefánsson E. Topical drug delivery to the eye: Dorzolamide. Acta Ophthalmol 2012;90:603-8.
18. Fonseca-Santos B, Chorilli M. An overview of polymeric
dosage forms in buccal drug delivery: State of art, design of formulations and their in vivo performance evaluation. Mater Sci Eng C Mater Biol Appl 2018;86:129-43. 19. Morales JO, Brayden DJ. Buccal delivery of small
molecules and biologics: Of mucoadhesive polymers, films, and nanoparticles. Curr Opin Pharmacol 2017;36:22-8.
20. Pengo P, Şologan M, Pasquato L, Guida F, Pacor S, Tossi A, et al. Gold nanoparticles with patterned surface monolayers for nanomedicine: Current perspectives. Eur Biophys J 2017;46:749-71.
21. Capek I. Polymer decorated gold nanoparticles in nanomedicine conjugates. Adv Colloid Interface Sci 2017;249:386-99.
22. Lok CN, Zou T, Zhang JJ, Lin IW, Che CM. Controlled-release systems for metal-based nanomedicine: Encapsulated/self-assembled nanoparticles of anticancer gold(III)/platinum(II) complexes and antimicrobial silver nanoparticles. Adv Mater 2014;26:5550-7. 23. Ajnai G. Trends of gold nanoparticle-based drug delivery
system in cancer therapy. J Exp Clin Med 2014;6:172-8. 24. Abadeer NS, Murphy CJ. Recent progress in cancer
thermal therapy using gold nanoparticles. J Phys Chem C 2016;120:4691-716.
25. Kharlamov AN, Tyurnina AE, Veselova VS, Kovtun OP, Shur VY, Gabinsky JL, et al. Silica-gold nanoparticles for atheroprotective management of plaques: Results of the NANOM-FIM trial. Nanoscale 2015;7:8003-15.